Efficiency in Taiwan Sign Language and Mandarin
著者(英) Jane Tsay, James Myers, James Tai journal or
publication title
Senri Ethnological Studies
volume 101
page range 133‑145
year 2019‑06‑21
URL http://doi.org/10.15021/00009423
133
SENRI ETHNOLOGICAL STUDIES 101: 133 –145 ©2019 Minpaku Sign Language Studies 1
Edited by Kikusawa Ritsuko and SaNO Fumiya
9. A Longitudinal Study of Communicative Efficiency in Taiwan Sign Language and Mandarin
Jane Tsay
National Chung Cheng University, Taiwan
James Myers
National Chung Cheng University, Taiwan
James Tai
National Chung Cheng University, Taiwan
Abstract
Bellugi and Fischer (1972) studied the rate of articulation in sign and speech and found that the rate of words per second was higher for spoken English than for American Sign Language. However, a proposition took about the same amount of time to produce in either sign or speech. Myers et al. (2011) conducted a follow up study with an explicit quantification method for measuring communicative efficiency in sign and speech. They proposed that communicative efficiency should be addressed both as representation efficiency (propositions per syllable) and as transmission efficiency (propositions per second). Following Myers et al. (2011), this study investigates communicative efficiency in sign and speech with a focus on changes over time. Narratives from TSL signers and Mandarin speakers were elicited using a picture story book. Comparing the data collected in 2005 and 2015 from the same participants, Taiwan Sign Language showed a slight increase in both transmission efficiency and representation efficiency after ten years, while Mandarin had a slight decrease in transmission efficiency and no change in representation efficiency. Statistical analysis showed that Taiwan Sign Language changed significantly more than Mandarin overall, but the difference in the direction of change across languages did not quite reach statistical significance. Since all participants were middle-aged throughout the duration of the study (maximum age was 53 for the Taiwan Sign Language group and 50 for the Mandarin group), the weak longitudinal effect is not surprising. A study with elderly participants (over 65) is needed to further explore the effect of aging on communicative efficiency.
9.1. Introduction
Linguists have identified parallels in the linguistic structures of sign languages and spoken languages (Stokoe 1960, 1980, 2005; Fischer and Siple 1990; Siple and Fischer 1991; Valli and Lucas 1992; Meier et al. 2002; Sandler and Lillo-Martin 2006; among others). However,
sign and speech have different means of production. Spoken language is articulated with speech organs, while sign language is articulated with the hands and the body. Because the articulators for sign language are much larger and the movements are thus much slower, the comparison of the rate of articulation between sign and speech has naturally attracted researchers’ attention.
Bellugi and Fischer (1972) (see also Bellugi, Fischer and Newkirk 1979), in investigating the biological foundations of language, studied the rate of articulation in sign and speech.
The study was concerned about how many words were produced per second and how much time it took to produce a proposition in American Sign Language (ASL) and spoken English.
They found that the rate of words per second was higher for speech than for sign. However, a proposition took about the same amount of time to produce in either sign or speech.
Although they only focused on the temporal aspect of transmitting information by studying the rate of articulation, they suggested that sign language compensates for its relatively slower articulation with more compact phonological representations.
Myers et al. (2011) further argued that to have a complete understanding of the communicative efficiency of sign and speech, it is not enough just to measure the rate of articulation, which they call transmission efficiency. More crucially, communicative efficiency should also include the rate of information that a linguistic structure or representation unit (e.g. a syllable) can convey, which they call representation efficiency. They found that representation efficiency (defined as propositions per syllable) in Taiwan Sign Language (TSL) was significantly higher than in Mandarin, although there was no significant difference in transmission efficiency (defined by propositions per second) between TSL and Mandarin.
Since representation efficiency is measured based on linguistic structure and transmission efficiency is measured based on the use of language, the former can be considered as related to linguistic competence and the latter to linguistic performance. With this distinction between these two types of efficiencies, a natural follow-up issue is raised concerning whether these two types of efficiencies would show different changes over the signer’s and speaker’s lifetimes.
This chapter reports a longitudinal study conducted to examine whether there are changes over time in communicative efficiency by studying the same participants (data collected in 2005 and reported in Myers et al. 2011) after ten years in 2015-2016.
9.2. Rate of Articulation
Since the articulators in sign and speech are very different physically, Bellugi and Fischer (1972) were interested in the consequences resulting from the different biological foundations of production of sign and speech. They address this issue by comparing the rate of signs produced in ASL with the rate of words produced in spoken English. They compared the rate of articulation in two aspects: how many words are produced per second and how much time it takes to produce a proposition.
In their definition, a proposition is “equivalent to a simple underlying sentence,” but
“an actual produced sentence may contain one or several propositions” (p. 187). Thus, propositions were counted by main verbs or predicates which had overt or covert subjects.
9. A Longitudinal Study of Communicative Efficiency in Taiwan Sign Language and Mandarin 135 Semi-auxiliary verbs and repetitions of verbs were not counted.
Three native hearing bilinguals were asked to tell a story in three ways: (i) in American Sign Language (ASL) only; (ii) in spoken English only; (iii) in ASL and spoken English simultaneously.
They compared each subject’s three productions and found that, for stories told in one modality only (ASL or spoken English), the rate of words per second was twice as high for speech than for sign as shown in Table 9-1. That is, within the same period of time, bilinguals could produce about twice as many spoken words as signs.
Table 9-1 Rate of articulation in producing sign or speech (excluding pauses) SigNed stOry Average
sigNs per secONd SpOkeN stOry Average wOrds per secONd
Subject A 2.3 4.0
Subject B 2.3 4.9
Subject C 2.3 5.2
(Bellugi and Fischer 1972: 180)
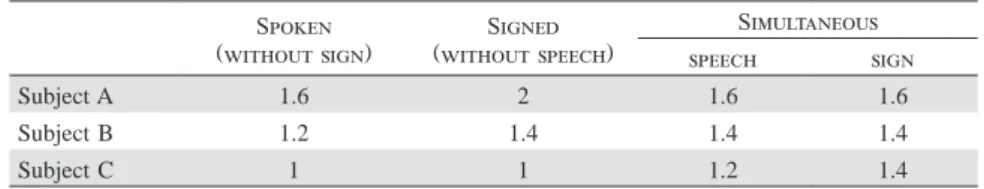
This finding shows the modality constraints on the speed of articulation. However, the mean duration (in seconds) of the propositions was about the same in both languages as shown in Table 9-2. That is, a proposition takes about the same amount of time to produce in either sign or speech.
Table 9-2 Mean seconds per proposition SpOkeN (withOut sigN)
SigNed (withOut speech)
SimultaNeOus
speech sigN
Subject A 1.6 2 1.6 1.6
Subject B 1.2 1.4 1.4 1.4
Subject C 1 1 1.2 1.4
(Bellugi and Fischer 1972: 184)
The results show equal efficiency in transmitting information (or meaning, as conveyed by propositions) in ASL and spoken English.
As to signing and speaking simultaneously, when native bilinguals told the story in ASL and English simultaneously, the English narratives had lower spoken word rates compared with English only, while their ASL narratives had about same sign rates and proposition rates compared with ASL only. That is, in simultaneous communication, speech was less efficient than sign for native bilinguals.
In summary, although it takes longer to produce signs, a sign language is as efficient as a spoken language in terms of the propositions being expressed. When signing and speaking simultaneously, English is less efficient than ASL.
9.3. Communicative Efficiency
Compared to English, ASL has a slower sign rate with a similar proposition rate. That is, although the articulation of signing is slower, it can transmit the same amount of information (or meaning) as speech within the same period of time. This type of efficiency related to speed or time is termed transmission efficiency in Myers et al. (2011).
Bellugi and Fischer (1972) suggest that the reason why the ASL proposition rate is higher might be due to certain properties of sign languages, including less redundancy (by using fewer grammatical morphemes) and simultaneity (the incorporation of location, number, and manner in temporal overlap).
The use of fewer grammatical morphemes and simultaneity is related to linguistic structure and representation. For example, the phonological form of a sign might convey more information by simultaneously incorporating the verb with its aspect markers or agreement and hence be more efficient than a spoken word. This type of efficiency is termed representation efficiency in Myers et al. (2011).
Therefore, communicative efficiency is not just about speed or time (i.e. transmission efficiency), it is also about linguistic structure and representation (i.e. representation efficiency). Both representation efficiency and transmission efficiency were studied in Myers et al. (2011).
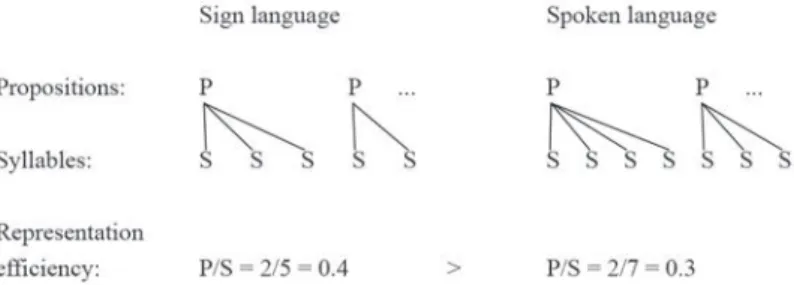
They measured representation efficiency by the number of propositions per syllable.
Following Perlmutter (1992), movement is taken to be the peak of sonority in a syllable;
a prototypical syllable in a signed language is a PMP sequence, where P refers to the position of the articular and M refers to a (path) movement. Other syllable types include MP, PM, M, and a P with hand-internal local movement.
We schematize it in Figure 9-1.
P = position (held at a location) M = movement (path movement) + = local movement
Figure 9-1 Sign syllables and sonority
The calculation of the rate of representation efficiency (propositions per syllable) can be schematized as in Figure 9-2 (Myers et al. 2011: 173). There are 5 syllables (S) in 2 propositions (P) in the sign language example. Therefore, the rate of representation efficiency is 2/5=0.4. In the case of the spoken language example, there are 7 syllables (S) in 2 propositions (P) and the rate of representation efficiency is 2/7=0.3.
9. A Longitudinal Study of Communicative Effi ciency in Taiwan Sign Language and Mandarin 137
Figure 9-2 Representation effi ciency (Myers et al. 2011: 173)
The transmission efficiency is calculated as propositions per second in Myers et al.
(2011), inverse calculation of Bellugi and Fischer (1972), as schematized in Figure 9-3.
The calculations are the same as in representation efficiency, except that physical time units (T), like seconds, are measured rather than phonological constituents like syllables.
Figure 9-3 Transmission effi ciency (Myers et al. 2011: 174)
9.4. Method
The same method was used in both Myers et al. (2011) and the current longitudinal study.
9.4.1 Data Elicitation Method
Narratives were elicited from TSL signers and Mandarin speakers using a wordless picture book “Frog, where are you?” (Mayer 1969; see Figure 9-4). There are advantages of using a wordless picture book to elicit data. First, higher consistency in content can be obtained. Second, the interference of the writing system, which is in favor of the spoken language, can be avoided.
Participants read this picture book first to get a general understanding of the story. They were then asked to tell the story page by page either in TSL (for deaf participants) or in Mandarin (for hearing participants). The storytelling process
was video recorded for each participant. Figure 9-4 “Frog, where are you?”
(Mayer 1969)
9.4.2 Transcription
The TSL videos were transcribed (translated) into signs with Chinese glosses using ELAN (Crasborn and Sloetjes 2008), computer software developed by the Max Planck Institute for Psycholinguistics, Nijmegen, the Netherlands. The Mandarin sound files were transcribed into Chinese characters using Praat (Boersma and Weenink 2017).
The recordings were transcribed independently by two transcribers and checked by a third transcriber to confirm consistency.
9.4.3 Measurements and Calculation
Transmission efficiency refers to how much information is transmitted in a certain amount of time. In this study, it is measured by the rate of propositions per second. Representation efficiency refers to how much information can be expressed by a structural unit. In this study, it is measured by the rate of propositions per syllable.
The steps in the measurements and calculation were thus as follows:
Step 1: Identify and count the number of propositions (the P’s in Figures 9-2 and 9-3) Step 2: Measure the duration of the propositional contents (the T’s in Figure 9-3) Step 3: Count the number of syllables in the propositions (the S’s in Figure 9-2) Step 4: Calculate the efficiency rates: Transmission P/T and Representation P/S
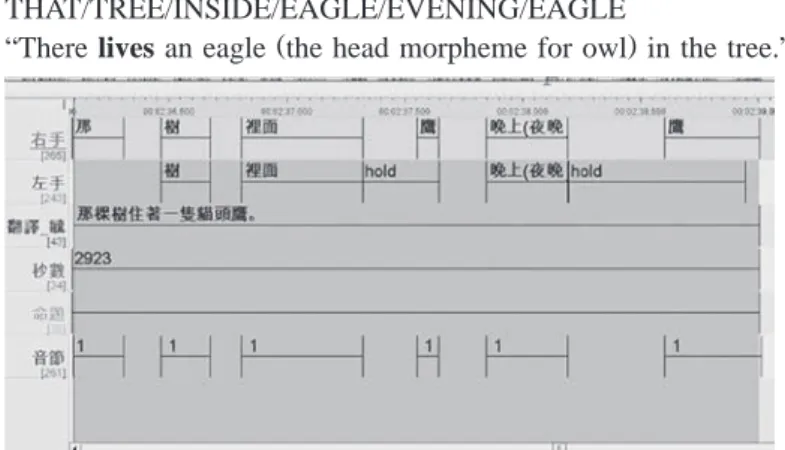
Figure 9-5 shows an example in ELAN of a TSL sentence with one proposition (indicated by the verb glossed as “lives”) from our data.
THAT/TREE/INSIDE/EAGLE/EVENING/EAGLE
“There lives an eagle (the head morpheme for owl) in the tree.”
Figure 9-5 TSL example: “There lives an eagle (owl) in the tree”
The duration is 2.923 seconds and there are 6 syllables in this TSL sentence with one proposition. The rate of representation efficiency is 1/6=0.16 and the rate of transmission efficiency is 1/2.92=0.34.
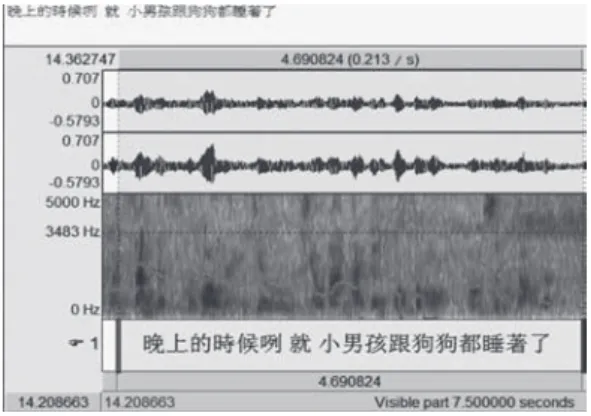
Figure 9-6 shows an example in Praat of a Mandarin sentence with one proposition (indicated by the verb glossed as “fell asleep”) from our data.
9. A Longitudinal Study of Communicative Efficiency in Taiwan Sign Language and Mandarin 139 晚上的時候咧,就小男孩跟狗狗都睡著了。
Wanshang de shihou lie, jiu xiao nanhai gen gougou dou shuizhao le.
“In the evening, the boy and the dog fell asleep.”
Figure 9-6 Mandarin example: “In the evening, the boy and the dog fell asleep”
The duration is 4.691 seconds and there are 17 syllables in this Mandarin sentence with one proposition. The rate of representation efficiency is 1/17=0.05 and the rate of transmission efficiency is 1/4.69=0.21.
9.5. Results of Myers et al. (2011)
Myers et al. (2011) investigated both representation efficiency and transmission efficiency in TSL and Mandarin Chinese spoken in Taiwan. Page-by-page narratives of the picture book “Frog, where are you?” were elicited from 26 deaf TSL signers (mean age 41) and 31 hearing Mandarin speakers (mean age 40) in 2003-2005 as shown in Table 9-3. The data are referred to as 2005 data.
Table 9-3 Number of participants and mean ages and ranges (2005 data) 2005
TSL (N=26) 41 (23~61)
Mandarin (N=31) 40 (17~61)
As described in the Method section above, three measurements were done in both TSL and Mandarin. First, propositions in narratives were identified and counted. Second, durations of the propositional contents (phrases/sentences/utterances) were measured. Third, syllables in the propositional contents were counted. Transmission efficiency (propositions per second) and representation efficiency (propositions per syllable) were then calculated.
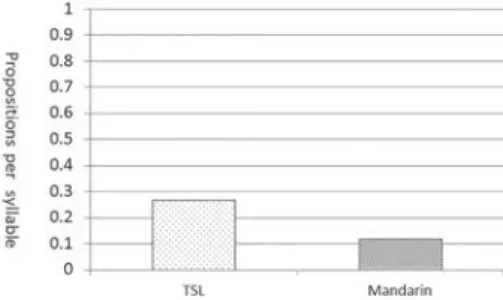
The results show that TSL and Mandarin had the same mean rate of transmission efficiency (0.52 propositions per second) and the mean rates of representation efficiency were 0.27 for TSL and 0.12 for Mandarin as shown in Table 9-4.
Table 9-4 Results of 2005 data
TSL (N=26) MaNdariN (N=31)
Transmission efficiency 0.52 0.52
Representation efficiency 0.27 0.12
TSL and Mandarin had the same mean rate in transmission efficiency. This means they can transmit the same amount of information in the same period of time. This is consistent with the results in the rate of articulation in Bellugi and Fischer (1972): a proposition takes about the same amount of time to produce in either sign or speech.
The representation efficiency was quantified explicitly in this study and TSL showed much higher representation efficiency than Mandarin. As reported by Myers et al. (2011), shown in Figure 9-7, there was a significant difference in representation efficiency between TSL and Mandarin in the 2005 data.
Figure 9-7 Mean representation efficiency (2005 data): significant
9.6. The Current Study: A Longitudinal Comparison
Results from Myers et al. (2011) have implications for the distinction between transmission efficiency and representation efficiency in sign and speech. No difference in transmission efficiency between sign and speech suggests that the two modalities are equally efficient in transmitting information.
However, since transmission efficiency is related to the use of language (i.e. linguistic performance), it might be more vulnerable to the decline of motor control caused by aging.
By contrast, since representation efficiency is related to grammatical competence or the knowledge of language, we expect it to be less affected by normal aging. Therefore, the current longitudinal study further examined the changes over time in transmission efficiency and representation efficiency in users of TSL and Mandarin.
Using the same method as in Myers et al. (2011), narratives were collected in 2015
-2016 from 7 of the deaf TSL signers and 11 of the hearing Mandarin speakers who participated in the original study (data collected in 2004-2005 and reported in Myers et al.
2011). The mean age of the TSL group was 43 in 2005 and 53 in 2015. The mean age of the Mandarin group was 40 in 2005 and 50 in 2015 as shown in Table 9-5. Both groups can be classified as being in the middle age stage.
9. A Longitudinal Study of Communicative Efficiency in Taiwan Sign Language and Mandarin 141
Table 9-5 Longitudinal: mean ages and ranges
2005 2015
TSL (N=7) 43 (39~48) 53 (49~58)
50 Mandarin (N=11) 40 (29~51) (40~61)
Results of the longitudinal comparison are given below (Table 9-6).
Table 9-6 Longitudinal results
TSL (N=7)
MeaN age 53 (49~58) MaNdariN (N=11) MeaN age 50 (40~61)
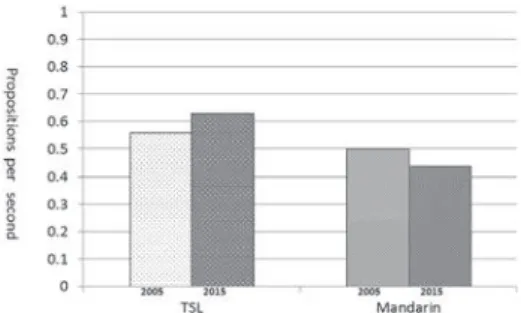
Transmission 2005 0.56 0.50
Transmission 2015 0.63 0.44
Representation 2005 0.29 0.12
Representation 2015 0.32 0.12
TSL showed higher transmission efficiency and representation efficiency than Mandarin.
TSL had a slight increase after ten years in both transmission efficiency (+0.07) and representation efficiency (+0.03) as shown in Figure 9-8, while Mandarin had a slight decrease (-0.06) in transmission efficiency and no change in representation efficiency as shown in Figure 9-9.
Figure 9-8 Longitudinal study: transmission efficiency
Figure 9-9 Longitudinal study: representation efficiency
A 3-way ANOVA statistical test was conducted (year and efficiency type as within- group variables and language as between-group variables). There was a significant main effect of language (F(1,16) = 38.63, p <.0001), indicating a difference between TSL and Mandarin in both efficiency types. A significant two-way interaction of language × year was also found (F(1,16) = 9.72, p =.006), showing that across both types of efficiency, TSL improved more than Mandarin across the years. There was no main effect of Year (F
< 1), and the three-way interaction among year, language, and efficiency type did not quite reach statistical significance (F(1,16) = 4.03, p =.06).
9.7. Discussion and Conclusion
Compared to 10 years ago, the changes in transmission efficiency and representation efficiency in both TSL and Mandarin seem to be very small. This may be because both groups were in the middle age stage in 2015 (mean age 53 for TSL and 50 for Mandarin in the new study), so normal aging has not yet shown strong effects.
However, an interesting phenomenon might be worth exploring. Regarding transmission efficiency, there was a slight increase in TSL, while a slight decrease in Mandarin.
We further examined the raw data in the transmission efficiency and found that the number of propositions might be a crucial factor. In 2015, five out of the seven TSL signers had a large increase in the number of propositions, while nine out of the eleven Mandarin speakers had a clear decrease.
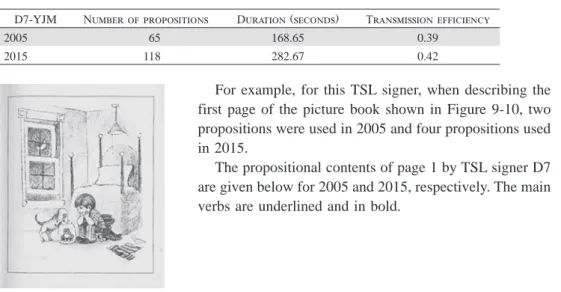
For example, for TSL signer D7, the number of propositions increased by more than 80%, from 65 propositions in 2005 to 118 propositions in 2015. But the duration only increased about 60%, causing the increase in transmission efficiency (propositions per second) in 2015 as shown in Table 9-7.
Table 9-7 Data of TSL D7
D7-YJM Number Of prOpOsitiONs DuratiON (secONds) TraNsmissiON efficieNcy
2005 65 168.65 0.39
2015 118 282.67 0.42
For example, for this TSL signer, when describing the first page of the picture book shown in Figure 9-10, two propositions were used in 2005 and four propositions used in 2015.
The propositional contents of page 1 by TSL signer D7 are given below for 2005 and 2015, respectively. The main verbs are underlined and in bold.
Figure 9-10 Page one of “Frog, where are you?” (Mayer 1969)
9. A Longitudinal Study of Communicative Efficiency in Taiwan Sign Language and Mandarin 143 Propositional contents of page 1 by D7 in 2005 (two propositions)
Proposition-1 在/晚上/家/有/孩子/
IN/EVENING/HOME/HAVE/CHILD Proposition-2
小/孩子/和/狗/看/玻璃^瓶/的/青蛙
/LITTLE/CHILD/AND/DOG/LOOK/GLASS^BOTTLE/DE (location)/FROG Propositional contents of page 1 by D7 in 2015 (four propositions)
Proposition-1 在/晚上/有/在/小/孩子
IN/EVENING/HAVE/AT/LITTLE/CHILD Proposition-2
在/家/小/孩子
BE/HOME/LITTLE/CHILD Proposition-3
小/孩子/和/狗/玻璃/青蛙/(p-)青蛙在瓶缸裡面/
LITTLE/CHILD/AND/DOG/GLASS/FROG/(using classifier p) the frog stands inside the bottle
Proposition-4
看(right hand)/看(left hand)
LOOK (right hand) /LOOK (left hand)
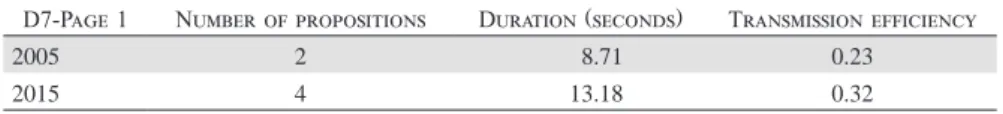
For TSL D7, although the number of propositions increased by 100% in 2015, the duration only increased by 66%. Therefore, there was an increase from 0.23 to 0.32 in transmission efficiency in 2015 as shown in Table 9-8.
Table 9-8 Data of Page 1 of TSL D7
D7-Page 1 Number Of prOpOsitiONs DuratiON (secONds) TraNsmissiON efficieNcy
2005 2 8.71 0.23
2015 4 13.18 0.32
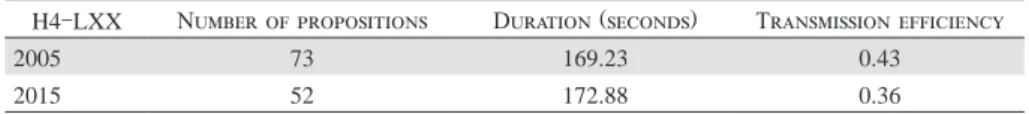
By contrast, most of the Mandarin speakers showed a decrease in the number of propositions. For example, the Mandarin participant D2 had a decrease of about 30% from 73 propositions in 2005 to 52 propositions in 2015, as shown in Table 9-9. However, the duration did not decrease. Instead, it increased by about 2%, causing a decrease from 0.43 to 0.36 in transmission efficiency.
Table 9-9 Data of Mandarin H4
H4-LXX Number Of prOpOsitiONs DuratiON (secONds) TraNsmissiON efficieNcy
2005 73 169.23 0.43
2015 52 172.88 0.36
Although increase or decrease in the number of propositions seems to have a correlation with the increase or decrease in transmission efficiency, it is not clear yet why the propositions increased in TSL and decreased in Mandarin over time. Further examination is needed.
In conclusion, we made a distinction between transmission efficiency and representation efficiency with an explicit calculation method. TSL has greater representation efficiency than Mandarin, while both languages are similar in transmission efficiency. A syllable in a sign language represents more propositions than a syllable in spoken language, causing signing to have higher representation efficiency than speech.
Regarding changes over time, we found that TSL had a slight increase after ten years in both transmission efficiency and representation efficiency, while Mandarin had a slight decrease in transmission efficiency and no change in representation efficiency, though this interaction did not quite reach statistical significance. Since both the TSL group and the Mandarin group were in the middle age stage, they may not have begun to show the effects of normal aging on their language use. Another study with elderly participants (over 65) is being conducted to further explore the effect of aging on communicative efficiency.
Acknowledgements
This study was supported by a research grant from the Ministry of Science and Technology, Taiwan (MOST 104-2410-H-194-079-MY3, 2015/08-2018/07), to the first author. The authors are also members of the Center for Innovative Research on Aging Society, National Chung Cheng University. We thank the deaf and hearing participants, especially those who participated in both 2005 and 2015-2016. Research assistant Shihkai Liu helped in various aspects of the current study. Another assistant, Yuyi CheN (Deaf) was very helpful in providing a native signer’s observations and perspectives, as well as in transcribing TSL videos. MA students, Yushan YeN and Hokwei WONg (Hard of Hearing) helped in the transcription of the Mandarin sound files and TSL videos, respectively. We also thank the audience at the 5th Meeting of Signed and Spoken Language Linguistics (SSLL 2016) for helpful comments and discussions. Any errors or weaknesses are of course our responsibilities.
References
Bellugi, U. and S. D. Fischer
1972 A Comparison of Sign Language and Spoken Language. Cognition 1(2-3): 173-200.
Bellugi, U., S. D. Fischer, and D. Newkirk
1979 The Rate of Speaking and Signing. In E. S. Klima and U. Bellugi (eds.) The Signs of Language, pp. 181-194. Cambridge: Harvard University Press.
9. A Longitudinal Study of Communicative Efficiency in Taiwan Sign Language and Mandarin 145 Boersma, P. and D. Weenink
2017 Praat: Doing Phonetics by Computer. (Computer Program). Version 6.0.36, retrieved 03 January 2017 from http://www.praat.org/
Crasborn, O. and H. Sloetjes
2008 Enhanced ELAN functionality for sign language corpora. In Proceedings of LREC 2008, Sixth International Conference on Language Resources and Evaluation.
ELAN [Computer Software]. Version 5.2.
Nijmegen: Max Planck Institute for Psycholinguistics, retrieved from https://tla.mpi.nl/
tools/tla-tools/elan/ (Accessed on 4th April, 2018) Fischer, S. D. and P. Siple (eds.)
1990 Theoretical Issues in Sign Language Research (Vol. 1): Linguistics. Chicago: University of Chicago Press.
Mayer, M. (ed.)
1969 Frog, Where Are You? New York: Dial Press.
Meier, R. P., K. Cormier, and D. Quinto-Pozos.
2002 Modality and Structure in Signed and Spoken Languages. Cambridge: Cambridge University Press.
Myers, J., J. Tsay, and S.-f. Su
2011 Representation Efficiency and Transmission Efficiency in Sign and Speech. In J.-H. Chang (ed.) Language and Cognition: Festschrift in Honor of James H-Y. Tai on His 70th Birthday, pp. 171-199. Taipei: The Crane Publishing.
Perlmutter, D.
1992 Sonority and Syllable Structure in American Sign Language. Linguistic Inquiry 23(3):
407-442.
Siple, P. and S. D. Fischer (eds.)
1991 Theoretical Issues in Sign Language Research (Vol. 2): Psychology. Chicago: The University of Chicago Press.
Sandler, W. and D. Lillo-Martin
2006 Chapter 5: Classifier Constructions. Sign Language and Linguistic Universals, pp. 76-93.
New York: Cambridge University Press.
Stokoe, W. C.
1960 Sign Language Structure. Studies in Linguistics: Occasional Paper 8. Buffalo, NY:
University of Buffalo.
1980 Sign Language Structure. Annual Review of Anthropology 9(1): 365-390.
2005 Sign Language Structure: An Outline of the Visual Communication Systems of the American Deaf. Journal of Deaf Studies and Deaf Education 10(1): 3-37.
Valli, C. and C. Lucas
1992 Linguistics of American Sign Language: A Resource Text for ASL Users. Washington DC:
Clerc Books.