Energy Metabolic Changes during Induced Hyperthermia
Hideo IWASAKA, Kaoru SETOGUCHI, Takaaki KITANO, Yoshio HAYANO, Takayuki NocucHi, Shunsuke ODA, Kazuo TANIGUCHI and Natsuo HONDA
Department of Anesthesiology, Oita Medical University, 1 - 1 Idaigaoka, Hasama-machi, Oita-gun, Oita 879-55, Japan
Abstract: The influence of induced hyperthermia on energy metabolism was investigated by elevating body temperature up to 43℃ with warm water in anesthetized 8 mongrel dogs.
This study showed that both the oxygen consumption and carbon dioxide production increas‑
ed 8‑10% for a body temperature rise of one centigrade degree, and also increased about 50% and 40%, respectively at 43℃ although non‑protein respiratory quotient was kept cons‑
tant. Blood glucose level has been kept more than 100g/dl during experiment. On the other hand, both arterial acetoacetate and β‑hydroxybutyrate levels increased significantly about 60% and 100%, respectively at 43℃. These results may show that both carbohydrate and fat utilization for energy expenditure tends to be higher during hyperthermia.
Key words: Energy metabolic changes, Blood glucose, Arterial acetoacetate, │3‑hydroxy‑
butyrate
INTRODUCTION
Malignant hyperthermia is one of the most commoncause of death in anesthetized pa- tients, although mortality has decreased over the last 20 years from 80% to less than 10%
(Kaplan, 1991). Previous experiments have shown that the hyperthermia is associated with an increase in oxygen consumption and carbon dioxide production (Honda et al., 1980).
It was uncertain however whehter this hypermetabolic state could effect on energy re- quirements. The present study examines the influence of induced hyperthermia by surface warming on fuel utilization in mongrel dogs which were hypermetabolic.
SUBJECTS AND METHODS
The study was approved by the Institutional Committee for Animal Use and Care of the Oita Medical University.
The experiments were carried out in eight mongrel dogs of male and weighing 13.6±0.9 kg (mean±SE). Anesthesia was induced with pentobarbital (25 mg/kg) and pan- curonium bromide (0.2 mg/kg); the trachea was intubated; and ventilation volume was con-
Received for Publication, April 24, 1992.
trolled at 12-15 ml/kg using an Aika Respirator for Animals. The frequency of respiration was adjusted so as to maintain endtidal carbon dioxide pressure between 33 mmHg and 38 mmHg.Anesthesia was maintained with nitrous oxide in oxygen and by a continuous infu- sion of pentobarbital (1 mg/kg). Pnacuronium bromide was given incrementally for muscle relaxattion to prevent increasing the oxygen cost of panting. Ventilation and fractional ox- ygen concentration were adjusted to maintain normoxia and normocapnia.
External juglar or femoral vein canulation was performed for the infusion of IV fluid, central venous pressure monitoring, and the measurement of blood temperature (Nihonkoden Co, Ltd., M 631 thermal unit). A femoral arterial catheter was used for blood sampling and blood pressure monitoring (Nihonkoden Co, Ltd., P200 pressure transducer).
A left thoracotomy at the fifth intercostal space was performed; An electomagnetic flowmeter probe (Nihonkoden Co, Ltd., MOT1200 flowmeter) were placed at the origin of the aorta. After midline abdominal incision, hepatic arterial blood flow was measured con- tinuously using electromagnetic flow probe. On the other hand, portal venous blood flow was measured simultaneously utilizing an ultrasonic transit-time volume flowmeter (Adbance Co, Ltd., T101 flowmeter). Total hep'atic blood flow (THBF) was calculated as hepatic arterial blood flow plus portal venous blood flow. Saline was administered at 20 ml/kg/hr during the surgical procedure by drip infusion and at 30-40 ml/kg/hr during the temperature elevation to maintain central venous pressure at level 3-5 mmHg.Glucose was also administered at 0.6 g/kg/hr. Oxygen consumption and carbon dioxide production were measured with indirect calorimetry (breath by breath method) using Medical Gas Analyzer MG360 and Respiromonitor RM300 (Minato Co, Ltd.).
The respiratory quotient (RQ; in this case, nonprotein RQ) means the ratio of the volume of carbon dioxide production to the volume of oxygen consumption. Arterial blood concentration of acetoacetate and /3-hydroxybutyrate were measered by enzymic determina- tion of Williamson method with spectrophotometer Keto340 (Iharadenshi Co, Ltd.). The temperature was raised by wrapping the dogs with vinyl sheet and immersing them in hot water as high as 45°C in 2 to 3 hr. Water temperature was regulated with the Heater (Taiyou Co, Ltd., Thermal Unit 302) to keep the temperature difference between water and body within 101C.
The measurement of following paramenters and blood sampling were done 6 times, at 38°C as a control, and 39, 40, 41, 42 and 43°C.; cardiac index, hepatic arterial blood flow, por- tal venous blood flow, oxygen consumption, carbon dioxide production, blood glucose, arterial blood concentration of acetoacetate and /3-hydroxybutylate.
Data were analyzed using analysis of variance and Student's t test. Statistical significance was set at P<0.05. Data are presented as the mean±SE.
RESULTS
1) Changes in energy metabolism (Table 1)
As shown Table 1 the control oxygen consumption (V02 was 122 ml/min. V02 increased 8- 10% for a body temperature elevation of one centigrade degree, and also increased 52% at 43°C. The control carbon dioxide production (VC02) was 100 ml/min. VC02 also increased about 10% for a body temprature elevation of one centigrade degree, and 56% at 43°C. Both V02 and VC02 increased similarly according to body temperature elevation. So the respiratory quotient was kept constant (from 0.81 to 0.84) during hyperthermia.
2) Acetoacetate, /3-hydroxybutyrate and blood glucose (Table 1)
Arterial acetoacetate concentration increased significantly at more than 42%, and 134%
at 43°C. Changes in arterial /3-hydroxybutyrate concentration show similar tendency to the blood concentration of acetoacetate. Arterial /3-hydroxybutyrate increased 67% at 43 °C. Blood glucose concentration decreased significantly at 43 °C , but we could not find out hypoglycemia during hyperthermia.
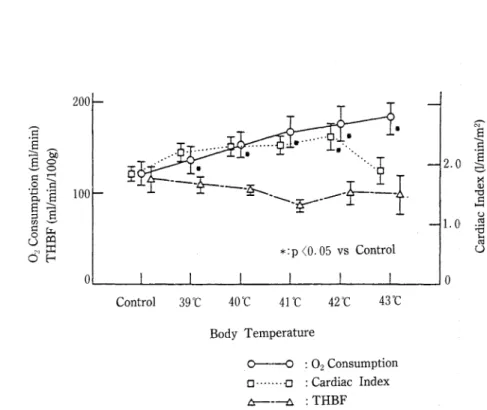
3) Cardiac index and total hepatic blood flow (THBF) (Fig. 1)
Cardiac index increased significantly 35% at 42°C, showing the parallel increase with the oxygen consumption, but cardiac index decreased at 43°C, not in parallel with an increase in V02. THBF was well maintained at the control level. And there were also no significant differences in hepatic arterial and portal venous blood flow at different hyperthermic body temperature.
Table 1. 02 consumption, C02 production, respirratory quotient (R), acetoacetate, /3-hydoxybutyrate and blood glucoses
Control 39 °C 40r 41°C 42°C 43°C
V02 (ml/min) 122± 13 137+15* 154+14*
VCO2 (ml/min) 100+12 112±13* 123+13*
R 0.82±0.03 0.82+0.02 0.81±0.01
Acetoacetate 35.0±6.0 35. 8±5. 9 36.0+2. 5
168+17* 177±19*
137±12* 143±15*
0.82+0.02 0.81±0.03
54.1±5.6 73.2+8.5*
/3-hydoxybutyrate 32.2+3.7 30.2±2.8 37.4±5-7 38.7+5.2 48-4±6-5*
Blood glucose 185±25 182+24 187±20 162±11 156+14
185±20*
156±16*
0.84±0.02
81.9+6.7*
53.8+2.2*
118±13*
(M ±SE)
*P<0.05 vs Control
200
<§à"
<-( 1-1
2 *
IIt» ---
a«
d'H 100
*:p <0.05 vs Control
2.0
1.0
Control 39 °C 40 °C 41 °C 42 °C 43 °C
Body Temperature
O O : 02 Consumption D -a : Cardiac Index
a a :THBF
Fig. 1. Changes in 02 consumption, cardiac index and total hepatic blood flow (THBF).
Values are means±SE.
Control 39°C 40°C 4It 42°C 43°C
Body Temperature
O O : 02 Consumption D D : /3-Hydroxybutyrate A A : Blood Glucose
Fig. 2. Changes in 02 consumption, /3-hydroxybutyrate and blood glucose. Values are mean±SE.
!U
0
0 o
SL
I g
"R w
00.
*:p <0.05 vs Control 200
100 .s
^ ^a 5
ii^^S o
4§o S
DISCUSSION
Although the complex metabolic reactions to hyperthermia are not actually understood, it is well known that oxygen consumption will increase with increasing body temperature ac- cording to van't Hoff's rule. The effect of increasing body temperature on metabolic rate is related to acceleration of the rates of biochemical reactions. In biochemical reactions, the ex- pected Qio may be between 2 and 3. In our study muscle relaxants were given sufficiently to prevent panting. So it seems quite resonable to neglect that the increase in work of breathing participates in producing the increased V02 (Usinger, 1968). Our data show V02 increase 8-
10% rise for a body temperature rise of one centigrade degree, and 52% at 43%. Since metabolic rate is correlated with V02, we could estimate that a body temperature of 43°C may also increase metabolic rate by about 50%. This result may well correlate with earlier studies. Du Bois (1954) summarized his studies of the influence of body temperature on metabolic rate, stating that metabolic rate increased 13% per degree Celsius (Du Bois, 1954).
The respiratory quotient is a helpful part of indirect calorimetry determination, since it establishes the caloric equivalent of oxygen. Our data show unequivocally an increase in VC02 during hyperthermia associated with an increase in VX>2. Since an increase in VC02 showed parallel increase with V02, nonprotein respiratory quotients were well preserved at control value. Although metabolic rate increased by 50%, this constant RQ in our study is considered to represent the oxidation of carbohydrate and fat as a fuel is increased equally with pro- gressive rise of body temperature. In other words, there was continued utilization of both en- dogenous fat and carbohydrate for energy, even though the hypermetabolic state was induc- ed by the progressive hyperthermia. Because a general value for RQ is 0.84 resulting from the arithmetic mean of the RQ of the foodstuffs: 1 for carbohydrate, 0.89 for protein, and 0.707 for fat (Burszttein, 1989). The proportions of nonprotein energy derived from either fat or carbohydrate oxidation, represented by the nonprotein RQ. In our study, we did not measure nitrogen excretion, but we think this factor may be neglectable. This is because pro- tein represents only about 15% of the total calories in the fuel mixture of the average daily diet and has an RQ in mid-range between fat and carbohydrate.
Carpentier et al. (1979) reported that fat oxidation tends to be higher in hypermetabolic patients than in normal subjects or than in malnourished patients (Carpentier, 1979). Increas- ed fat oxidation will be confirmed to measure the concentration of acetoacetate or /3-hydrox- ybutyrate (the "ketone" bodies) which are oxidized products of fatty acids. In our study, both acetoacetate and /3-hydroxybutyrate increased significantly at more than 42°C of body temperature, but the increase of acetoacetate is about twice higher than that of /3-hydrox- ybutyrate at 43°C. The reduction of acetoacetate is effected by /J-hydroxybutyrate dehydrogenase and yields /3-hydroxybutyrate. Although this reaction is reversible, it is said that when liver glycogen is abundant, the formation of /3-hydroxybutyrate is favored; when liver glycogen is relatively low, acetoacetate predominates (White, 1978). Therefore we think liver glycogen is relatively low at 43°C when metabolic rate seems to be 50% higher than con- trol value. This finding is coincident with a decrease in blood glucose at 43°C, although
hypoglycemia did not occur. In our progressive hyperthermic study, we speculate the follow- ing adaptaions will occur owing to increased metabolic rate. In hyperthermic state, terminal glucose combustion mainly occur in the brain and the remainder organism-heart, kidney, skeletal muscle and so forth-uses either fatty acids released directly into the circulation or fat- ty acids oxidized to acetoacetate or /3-hydroxybutyrate by liver (Sherwood, 1970).
Although liver is at the center of the adaptive mechanism, Collins et al (1980) reported that hepatic metabolic and biosynthetic functions are impaired at higher temperatures, as are many other metabolic functions (Collins, 1980). Our data show cardiac index increased at body temperatures of up to 42°C, showing the parallel increase with the metabolic rate and deareased at 43°C. But total hepatic blood flow was well maintained at control value even though at 43°C. According to hepatic blood flow, hepatic circulation may be well maintained in our induced hyperthermia.
We have discussed energy metabolic changes in induced hyperthermia in dogs. Our preliminary results suggest that hypermetabolic state induced by hyperthermia uses both glucose and fat as a fuel for increased energy demand. But our induced hyperthermic time course is short (3 to 4 hr), so we need further analysis about muscle protein brakdown, fuel sources and its utilization.
REFERENCES
1 ) Burszttein. S., Elwn, D. I., Askanazi, J. & Kinney, J.M. (ed.) (1989): The Theoretical Framework of Indirect Calorimetry and Energy Balance, pp. 27-84. In Energy Metabolism, Indirect Calori- metry, and Nutrition. Williams & Wilkins Co. Balitimore.
2 ) Carpentier, Y.A., Askanazi, J. & Elwyn, D.H. (1979): Effects of hypercaloric glucose infusion on lipid metabolism in injury and sepsis. J. Trauma, 19, 649-654.
3 ) Collins, F.G., Mitros, F.A. & Skibba, J.L. (1980): Effects of palmitate on hepatic biosynthetic func- tions of hyperthermic temperatures. Metabolism, 29, 524-531.
4 ) Du Bois, E.F. (1954): Energy metabolism. Ann. Rev. Physiol., 16, 125-134.
5 ) Honda, N., Oda, S., Matsushima, S., Nishino, M., Honda, Y. & Gotoh, Y. (1980): Some physiological changes during progressive hyperthermia in dogs. Hiroshima J. Anes., 16, 115-121 (in Japanese).
6 ) Kaplan. R.F. (1991): Malignant hyperthermia. 1991 Ann refresher course lectures. 231, 1-7.
7 ) Sherwood, L.M. & Parris, E.E. (1970): Starvation in man. N. Engl. J. Med., 282, 668-675.
8 ) Usinger, P.S.W. & Alber, C. (1968): Oxygen cost of panting in anesthetized dogs. Respir. Physiol.,
5,302-315.
9 ) White, A., Handler, P., Smith, E.L., Hill, R.L. & Lehman, I.R. (ed.). (1978): Lipid Metabolism 1. pp.
568-606. In Principles of Biochemistry 6th ed. McGraw-Hill Co. New York.