31
DOI: http://dx.doi.org/10.14246/irspsd.2.3_32
Copyright@SPSD Press from 2010, SPSD Press, Kanazawa
The Research on China's Urban Spatial Expansion and Its Time-space Stability Since 2000
Wang Kaiyong1* and Qi Wei2
1 Institute of Geographical Sciences and Natural Resources Research, Chinese Academy of Sciences
2 University of Chinese Academy of Sciences
* Corresponding Author, Email: [email protected] Received 12 September, 2013; Accepted 10 Feberuary 2014
Key words: Urban Spatial Expansion, Municipal District, Built-Up Area, Time-Space Path, Time-Space Stability
Abstract: Municipal district expansion and built-up area expansion are two main forms in urban spatial expansion. In China, the two processes are very drastic and unstable under high-speed urbanization. Geographical time-space stability emphasizes both time and space. With the help of geometry, this paper constructs a coordinate system of the standardized built-up area and municipal district area. Furthermore, the paper draws the spatial expansion path of some main prefecture cities from 2000 to 2010 and classifies the paths by the standardized mean value. Finally, three indexes called mov, tor and sd are given to calculate time-space stability. The study shows (1) Since 2000, municipal district expansion mainly happens in Yangtze River Delta, Pearl River Delta, southeast of Fujian and the provincial capitals of mid-west areas as well as the surrounding cities which are close to these capitals. However, built-up area expansion doesn’t show the obvious polarization effect and each urban agglomeration’s own high speed. (2) The types of time-space path can be divided into stable type and crossing type. Most of the stable types are Low- Low which means both municipal district and built-up area are under the mean value. And most of the cities which transfer its type only have one time change among four types. (3) Those cities which are high ranked are sensitive to mov and sd, both of which keep consistent characteristics between the cities and the whole nation. But those cities which are middle ranked are sensitive to tor which reflects an obvious change when a city carries out an administrative division adjustment in different years.
1. INTRODUCTION
With the acceleration of urbanization, the urban space has expanded rapidly. Under the background of the strictest land control system, the steadiness and ordering of the urban spatial expansion becomes an important issue to current academic circles and governments. Steadiness can often be seen statistically as time steadiness, meaning that the random character in the random process doesn’t vary from time to time (Li and Sun, 2001). As for the geographic space, steadiness reflects not only the process of steadiness on the time series, but also zone bit steadiness on space sections. Thus the time-space steadiness is formed. Since 2000, China’s urbanization level has steadily risen,
which increases the demand of urban land utilization. Competition between the urban-use and rural-use of lands becomes more intensified, and urban spatial expansion becomes the most striking features of cities of different grades. The urban spatial expansion mainly has two forms: administrative division spatial expansion and construction land spatial expansion. The administrative division spatial expansion is to add the administrative area by administrative division adjustment, mainly meaning the area expansion of the municipal districts under China’s administrative division system; the construction land spatial expansion refers to the process of transformation from the agriculture land to urban land, which is a form of entity in urban expansion. From 2000 to 2010, the population urbanization in China has increased from 36.22% to 49.68%, putting itself in a high-speed developing level, and this period of time is also an active stage for urban spatial expansion.
Meanwhile, the researchers are also paying more attention to the current surpassing administrative division urbanization and the wave of new district or new town construction (Zhou, 2006; Dai et al. 2010). Therefore, exploring the steadiness of urban spatial expansion is helpful to deepen the research on the spatial pattern of urban development and the regional effect of the administrative division adjustment, thus to provide references when developing the urban areas healthily and making relative policies.
Currently, there is little research on the time-space steadiness of urban spatial expansion, and the research of steadiness mainly focuses on the research of time steadiness in econometrics with methods including DF test, ADF test, PP test, Hall Instrumental Variable Method, DF-GLS test, KPSS test, LMC test, et al (Yi, 2011; William, 2011). But the traditional econometrical methods take less consideration of the geographic spatial autocorrelation features, and they are not fairly applicable to research the time- space features of urban development (Shen et al. 2011; Wang et al. 2005).
While in the field of urban spatial expansion, a lot of good research has been done. On the aspect of administrative division expansion, researchers like Wang and Chen (2011) concluded the experience of administrative division adjustment in foreign countries; Qu (2012) concluded the modes of administrative division adjustment in China’s urbanization process. On the aspect of land expansion, researchers like Liu et al (2008) summarized the spatial patterns of changes in urban land use into historic morphology pattern, location economics pattern, decision behaviour pattern as well as political economy pattern; Batty made use of the fractal and shoe-shaped automata model to carry out an empirical study on the urban land expansion (Batty et al. 1997; Batty, 1998); Zhang et al (2011) used the rank-size rule to explore the driving mechanism of the urban land expansion. Thus, it can be seen that more attention is paid to research on urban land expansion in the time-space perspective than on the time-space steadiness.
Therefore, this paper brings in the geometric method to the research of urban time-space steadiness, and it is not a new way to reflect the time-space features of space with the help of geometrics in the area of geography, such as the geographic orthocentre loci method. Researchers like Fan et al (2010) just used the two coefficients of spatial overlay and variation consistency as the measurement of geography orthocentre loci to measure its time-space feature.
The application of the geographic polygon method is another example.
Researchers like Qi and Wang (2010) used the polygon method to show the time-space features of city competiveness during the study of zone-city mode construction in Jiangsu Province. In addition, GIS and its administrative division also attach importance to geometrics. When Rey (2004) structured the LISA time-space evolution path through spatial autocorrelation features, they put forward some measurements targeting at time-space paths and time-
space steadiness to characterize the time-space dynamic process of the regional economic development (Rey and Janikas, 2006; Anselin and Rey, 1991). The paper tries to adopt a similar method, through the standardization to structure a coordinate system to reflect the urban spatial expansion, and then to analyse the time-space path and its steadiness features of urban spatial expansion in China in the most recent 10 years, in order to offer a reference to the research and practice on the urban spatial regulation and administrative division adjustment.
2. DATA SOURCES AND RESEARCH METHODS 2.1 Overview of the research areas and data sources
The research areas are 263 prefecture cities under the administrative organization system in 2000 and 2010. The space data adopts the 1:1000000 national boundaries (Albers Equivalent Intersection Conical Projection) provided by the National Geomantic Centre of China from the year of 2000 to 2010, and the main data comes from the China City Statistic Yearbook from 2001 to 2011. Because of the inter-annual difference of the statistical calibre, part of the data is revised according to the China City Statistic Yearbook and the Administrative Division Book of the People’s Republic of China.
2.2 Structure of the time-space path
In order to show the time-space features of urban spatial expansion, this paper uses urban built area to measure the urban land expansion, and uses municipal district area to measure the administrative division expansion, both of which together form the measurement of the urban spatial expansion.
Generally the built area and municipal district area of a city both keep in a relative position compared with the national level, and the yearly variation of this relative position is an important direction index to reflect the time-space steadiness of urban spatial expansion. According to this, the paper firstly standardizes the built area and municipal district area of every city in every year, and adopts maximum and minimum values to process the non- quantization. The processing result can not only guarantee the comparability between each year, but also reflects the variation of a city’s spatial expansion compared with other cities in the country. The specific standardized method is as follows:
min( )
max( ) min( )
i i
i
i i
X X
Y X X
(1)
In Equation (1), Yi is the value coming from the standardization of the city i index factor; min(Xi), max(Xi) relatively correspond to the minimum value and maximum value of the city i index factor. We construct a standardized coordinate system with built-up area standardized coefficient as the Y-axis, and municipal district area standardized coefficient as X axis. To each city, there is a corresponding point in each year in the coordinate system. By linking these points into a polygonal line, it forms the time-space path of spatial expansion in the urban built area. If all the cities’ time-space paths are put into this standardized coordinate system, a collection of time-space paths of urban spatial expansion is formed. The spatial expansion of a city itself and other cities will all affect its position in this standardized coordinate system. The
more the time-space path varies, the less the steadiness is; otherwise, it is more stable.
Figure 1. Time-space path diagram for urban spatial expansion
2.3 Measurement of the time-space steadiness
In order to further quantize the features of time-space steadiness of urban spatial expansion, this paper brings in 3 indexes from the geometric aspect to demonstrate the time-space path features of the urban spatial expansion, which are Index mov, Index tor, Index sd:
, , 1
1
1 1 , , 1
( , )
( , )
n
i t i t t
i N n
i t i t i t
N d L L
mov
d L L
(2)In Equation (2), Li,t refers to the point location of city i at time-point t in the time-space path diagram; d(Li,t,Li,t1) is the segment length between the two points; N represents the total city number, which is 263; n represents intervals of the time points, namely, 10; movi>1 shows that the moving length of the city at this period of time exceeds the national average value, and when it is less than 1, the length is under the average value. movi reflects the time-space steadiness of city i comparing with the total number of cities.
, , 1
1
,1, , 1
( , )
( )
n
i t i t t
i
i i n
d L L tor d L L
(3)In Equation (3), the meanings of indexes are the same as those in Equation (2), while tori represents a city’s curvature degree of its time-space path. The bigger the value is, the greater the curvature degree is. tori reflects the time- space steadiness of city i itself on a time series.
N
i i
i i
sd N
1
*
(4)
In Equation (4), i refers to the standard deviation of each neighbour time points’ length d(Li,t,Li,t1) of each city, sdi represents the fluctuation degree of the city compared with all cities, sdi reflects the steadiness of city i’s time-space moving speed.
3. RESULTS AND ANALYSES
3.1 The basic pattern of urban spatial expansion
Applying breakpoint method, the increasing rate distribution characteristics of the urban municipal district areas of above of prefecture- level cities is analysed from 2000 to 2010, which can reflect the basic urbanization pattern of the urban administrative divisions in China. From 2000 to 2010, the average value of the 263 cities’ municipal district area increased from 1664.94 km2 to 2099.40 km2, and the maximum value of the cities’
municipal district area appears in Yichun City, not Chongqing. As is showed in the Figure 2 (a), the main active regions of administrative division urbanization appears in the Yangtze River Delta, the Pearl River Delta, South- eastern of Fujian province and central regions such as Henan, Hubei, Anhui etc. Meanwhile Beijing and Tianjin provinces, the North-East coastal area and the alongside area of “Harbin-Dalian” railway, part of western China, also appear to have the active characteristics. It can be concluded that in the most recent 10 years, China’s administrative division urbanization was demonstrated with a pattern of thickness in the east and sparseness in the west.
In those eastern cities with higher regional economy levels, the “point-axle”
system of the cities has been networked. Many cities’ existing municipal district areas suffer a bottleneck period. On the one hand, the dependence of city development on land and water resources is growing. On the other hand, cities in the east area are relatively densely located, whose industrial chains and traffic lines promote the integration between regions, so the demand of the urban-rural areas integration and city-town systems integration is relatively strong. However, in the west region, “point-plane” pattern is still the main pattern of regional development. But on the important point, there is also similar demand for municipal district expansion. In addition, there are also municipal districts of some special cities with their increasing rates in negative values, such as Suizhou City in Hubei province. In 2009, part of the administrative division area of the original Zengdu District in Suizhou City was lined out to set up Sui County, achieving the optimum of the “One District, One County” administrative pattern in Suizhou.
(a). Urbanization in China by the adjustment of administrative divisions
(b). Urbanization in China by the expansion of built-up areas Figure 2. The basic pattern of urban spatial expansion
Also, the increasing rate distribution characteristics of the urban built areas of cities at the prefecture level and above is analysed from 2000 to 2010, which can reflect the basic pattern of the urban built land urbanization in China. The difference is that the whole increasing range of the spatial expansion for the built area of the 263 cities is not as large as the spatial expansion range of the municipal district. As is shown in Figure 2 (b), the polarization degree of the spatial expansion in the construction land is not as prominent as that in the municipal district. The eastern coastal areas generally showed higher increasing rate, especially the cities in Shandong Peninsula. In the west and central areas, the active regions of built area expansion are not only located in those provincial capital cities. The Chengdu-Chongqing Metropolitan Area, the Central Henan Urban Agglomeration, the Wuhan Urban Agglomeration, the Changsha-Zhuzhou-Xiangtan City Group, the Poyang Lake-Surrounding urban Agglomeration and Northeast “Harbin- Dalian” Axle also have high growing rates. To those traditional “monopole”
increasing areas, there is still active construction and land expansion around them, such as in Yinchuan and its surrounding cities, Yunnan and its surrounding cities. However, it is not difficult to find that there is difference between the east and the west in the spatial expansion of built areas.
From 2000 to 2010, urban construction in China had experienced rapid development. On the one hand, the improvement of population-urbanization level and the development of urban economy increased the demand of urban land. The administrative division adjustment in some regions provided urban construction with enough reserved land, by including the construction land in non-municipal districts before moving into the urban construction system.
However, there are also some cities without a very prominent expansion of built areas. These cities are mainly located in the central and western areas as well as Northeast China, with features of strong dependence on regional development and increasing polar and a low equilibrium level of regional economic development. Especially in the western areas, some cities suffer the bottleneck of the bearing capacity of environmental resources; so many cities are still lacking driving forces to develop themselves.
3.2 The space-time path and form of urban spatial expansion
The paper has calculated the average values of the municipal district area and the built area in 263 cities every year from 2000 to 2010, respectively, and also calculated the standardized value of the relevant average value according to the Equation (1). It depicts the standardized average values of each year in the space-time path coordinate system, as is shown in the Figure 3. The y-axis refers to the standardized value of municipal district area, and the x-axis refers to the standardized value of built area, so the mean value line perpendicular to the y-axis represents the standardized values of municipal district area every year, and the mean line perpendicular to the x-axis represents the standardized values of construction land value every year. The lines with deeper colour are closer to the year of 2010, while the lighter, closer to the year of 2000. Figure 3(a) shows that the average values of municipal district area and built area are both low, with standardized values almost always under the value of 10. In addition, from the perspective of time series, both of the average standardized values show a growing trend from 2000 to 2010. In fact, the absolute values of these two average values are also increasing year by year. If magnifying the interval between 6 and 7 on the y-axis and 6 and 10 on the x-axis, as is shown in Figure 3(b), the variation characteristics of these two mean values’
standardized line can be explored. It can be found that the average standardized values in some years are lower than the year before them. For example, the average value of built area in 2000 is 9.98, and in 2001 it is 7.72, and in 2002 it decreases to 6.65 and then it begins to rise back gradually.
Although the absolute value of the mean value is rising, the standardized average value in every year still relates to the maximum and minimum values.
If the difference between the maximum and minimum values of the built area or the municipal district area is low in a certain year, the average standardized value of that year will be high. In other words, space-time unsteadiness of the average standardized value exists.
(a). (b).
Figure 3. The changes of average standardized line for urban land
Setting the average standardized values of the municipal district area and the built area as boundaries, the standardized coordinate system can be divided into four sectors: ① High-High quadrant (HH), both of them are higher than the average value. ② High-Low quadrant (HL), the standardized value of the municipal district area is higher than the average value, while the standardized value of the built area is lower than the average value. ③ Low-High quadrant (LH), which is contrary to the HH quadrant. ④ Low-Low quadrant (LL), both of them are lower than the average value. Because the average value lines of each year are different, the quadrants of each year are also unsteady.
0 50 100
0 50 100 6
7 8
6 7 8 9 10
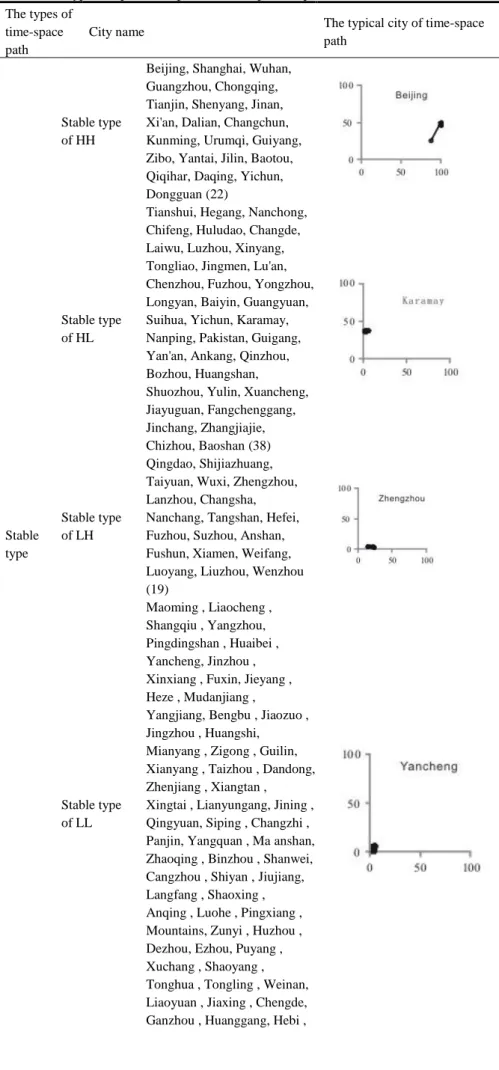
Table 1. The types of space-time path of urban spatial expansion The types of
time-space path
City name The typical city of time-space
path
Stable type
Stable type of HH
Beijing, Shanghai, Wuhan, Guangzhou, Chongqing, Tianjin, Shenyang, Jinan, Xi'an, Dalian, Changchun, Kunming, Urumqi, Guiyang, Zibo, Yantai, Jilin, Baotou, Qiqihar, Daqing, Yichun, Dongguan (22)
Stable type of HL
Tianshui, Hegang, Nanchong, Chifeng, Huludao, Changde, Laiwu, Luzhou, Xinyang, Tongliao, Jingmen, Lu'an, Chenzhou, Fuzhou, Yongzhou, Longyan, Baiyin, Guangyuan, Suihua, Yichun, Karamay, Nanping, Pakistan, Guigang, Yan'an, Ankang, Qinzhou, Bozhou, Huangshan, Shuozhou, Yulin, Xuancheng, Jiayuguan, Fangchenggang, Jinchang, Zhangjiajie, Chizhou, Baoshan (38)
Stable type of LH
Qingdao, Shijiazhuang, Taiyuan, Wuxi, Zhengzhou, Lanzhou, Changsha, Nanchang, Tangshan, Hefei, Fuzhou, Suzhou, Anshan, Fushun, Xiamen, Weifang, Luoyang, Liuzhou, Wenzhou (19)
Stable type of LL
Maoming , Liaocheng , Shangqiu , Yangzhou, Pingdingshan , Huaibei , Yancheng, Jinzhou , Xinxiang , Fuxin, Jieyang , Heze , Mudanjiang ,
Yangjiang, Bengbu , Jiaozuo , Jingzhou , Huangshi, Mianyang , Zigong , Guilin, Xianyang , Taizhou , Dandong, Zhenjiang , Xiangtan , Xingtai , Lianyungang, Jining , Qingyuan, Siping , Changzhi , Panjin, Yangquan , Ma anshan, Zhaoqing , Binzhou , Shanwei, Cangzhou , Shiyan , Jiujiang, Langfang , Shaoxing , Anqing , Luohe , Pingxiang , Mountains, Zunyi , Huzhou , Dezhou, Ezhou, Puyang , Xuchang , Shaoyang , Tonghua , Tongling , Weinan, Liaoyuan , Jiaxing , Chengde, Ganzhou , Huanggang, Hebi ,
Jingdezhen, Linfen , Tieling , Yibin , Zhangzhou, Chaozhou , Neijiang, Chaoyang , Xiaogan, Matsubara , Deyang ,
Meizhou , Hengshui , Jinzhong , Meishan, Heyuan , Yunfu, Wuzhou , Beihai, Zhoushan , Loudi , Zhumadian, Jincheng , Hanzhong , Xianning , Qujing, Dazhou , Zhoukou , Chuzhou , Huaihua, Guang'an , Ji'an , Yuncheng , Sanmenxia , Yulin , Sanming , Shangrao , Ziyang, Wuzhong , Lhasa, Ya'an , Yingtan, Yuxi , Heihe , Ningde, Lishui (109)
Leapfr og type
One time leapfrog
Shantou, Nanjing, Chengdu, Foshan, Harbin, Hangzhou, Shenzhen, Xuzhou, Zhanjiang, Jiangmen, Ningbo, Handan, Suqian, Huainan, Zhuhai, Haikou, Shaoguan, Hohhot, Benxi, Zaozhuang,
Qinhuangdao, Zhongshan, Jixi, Zhangjiakou, Xining, Yichang, Anyang, Yingkou, Tai'an, Quanzhou, Jiamusi, Liaoyang, Rizhao, Zhuzhou, Kaifeng, Yueyang, Baoji, Anyang, Panzhihua, Fuyang, Weihai, Hakusan, Shuangyashan, Wuhai, Putian, Suzhou, Tongchuan, Suining,
Shizuishan, Yiyang , Suizhou, Xinyu, Taizhou, Sanya, Quzhou, Chaohu, Anshun, Xinzhou (58)
Multiple leapfrog
Linyi, Nanning, Changzhou, Datong, Huai'an, Wuhu, Xiangyang, Nantong, Hengyang, Dongying, Leshan, Jinhua, Baicheng, Huizhou, Baoding, Yinchuan, Qitaihe (17)
Putting the space-time tracks of the urban spatial expansion from 2000 to 2010 into the standardized coordinate system of the space-time path, and overlaying them onto the average standardized lines of each year, we can make a classification of the space-time tracks of urban spatial expansion: ① steady space-time path: its track stabilizes in the same type quadrant, and the standardized line doesn’t span over the boundaries. ② spanning space-time path: the track appears in at least two of the four quadrants during the 10 years, and the standardized line spans over the boundaries. The specific classification result is illustrated in Table 1 with two broad headings and six subclass types.
The first type is steady HH. The cities of this type always have their built area and municipal district area stabilizing above the average value, most of
which are cities with high primacy ratio in China, such as Shanghai, Beijing and Guangzhou, which are the central cities of the Yangtze River Delta area, Beijing-Tianjin-Hebei region and the Pearl River Delta area, respectively.
Wuhan, Chongqing, Tianjin, Shenyang, Jinan, Xi’an, Changchun, Kunming, Urumqi and Guiyang are also important provincial capital cities, which mainly are the provincial capitals in the western area. Those cities’ developing patterns are always “monopole core” in their corresponding provincial area.
The organization systems and development of these cities have already gained a certain scale. Other cities are not the regional central cities, but also have high urban development levels. For example, Baotou, Tsitsihar, Daqing are historical large-size industrial and mining cities, and Dongguan, as one of the few prefecture-level cities without county-level cities in China, has witnessed a rapid expansion of the urban space driven by the policy of Three-processing and One-compensation since the reform and openness.
The second type is steady HL. The cities of this type have a large administrative area in the organization system, but most of them belong to second-tier cities in China’s regional development pattern, specially located in the western and central areas of China. On the one hand, these cities keep the same pace with the whole county on the administration organization system, and municipal districts are also separated from the original “region”
administration organization system. On the other hand, influenced by the nation’s “gradient transfer mode” regional development pattern, these secondary cities in the western and central areas have a relatively weak competiveness and limited urban expansion.
The third type is steady LH. The region of this style has a lower municipal district area, but these cities have already achieved certain urban developmental level, with high rankings in China’s city list. Many of them are provincial capital cities in western and central areas such as Zhengzhou, Shijiazhuang, Taiyuan, Changsha, Nanchang, Hefei, Lanzhou, and some secondary central cities in the east such as Qingdao, Wuxi, Tangshan, Suzhou, Xiamen and Wenzhou. The fourth type is the steady LL, cities of this type are scattered over the whole country. They are mainly middle-sized and small cities with weak city competiveness and secondary position in every urban agglomeration system. The fifth type is the once spanning type, namely only having one transformation of types. Many cities transform to HH or LH. The transformation process is realized by the expansion of the administrative division. Provincial capitals like Nanjing, Chengdu, Hangzhou, and Harbin all transformed from LH to LL. There are also many cities transforming to LL because of the expansion of the built areas or municipal district areas, such as Rizhao, Kaifeng, Fuyang, Yiyang, Chaohu, Xinzhou. Taking the typical city Foshan as an example, in 2002, Foshan modified its escrowed county-level cities Nanhai, Shunde, Shanshui and Gaoming into its municipal district.
Therefore, its municipal district area gained more than 40 fold increase, and its construction land also leaped from 38 km2 in 2001 to 115 km2 in 2002, which was mainly due to the large built areas owned by the four county-level cities. Due to this administrative adjustment, Foshan transformed from LL to HH. The sixth type is the multi-spanning type, with at least two types of transformations. From the aspect of the average values of the whole country, these cities show a great unsteadiness on the space-time level. Taking the typical city Nanning as an example, in 2000 and 2001, as the municipal district area and construction area of the whole country were in a low level, Nanning as the capital city in Guangxi Province stayed in the HH type. However, with the adjustment of municipal district and expansion of construction land in other cities (especially eastern cities), the integral level of the country’s urban space had ascended, and Nanning gradually became the city of LH type with
a lower municipal district area. In 2004, Nanning adjusted its administrative division by including its Yongning County into the municipal district. After that, the city’s municipal district area gained more than 4000 km2, which made it back to the HH type.
On the whole, among cities of steady types, there are less HH and LH cities and more HL cities, and the numbers of cities of LL types is the most, which almost always accords with the “ranking-size” of the urban systematic structure. Among cities of spanning types, there are mainly cities of one spanning type and fewer cities transforming their types. In the perspective of the types, the cities of spanning types and their space-time paths of spatial expansion can be considered unsteady.
3.3 Space-time steadiness of urban spatial expansion
(a) mov index
(b) tor index
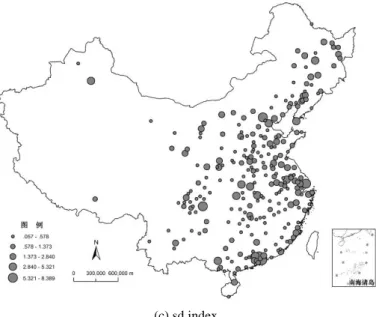
(c) sd index
Figure 4. The spatial distribution of urban space-time stability index
The paper further explores the space-time steadiness of urban spatial expansion which, as it is shown in Figure 4, calculates the mov index, tor index and sd index by the Equation (2), (3), and (4), according to the space- time path of every city’s spatial expansion, and then classifies them with the natural breakpoint method. The top 10 cities of the mov index are Shanghai, Chongqi, Urumqi, Dongguan, Shenzhen, Nanjing, Wuhan, Tianjing, Haerbin, and Dalian. Almost all the mov indexes of provincial capitals or metropolises are among the top 30. In addition, cities with high economic development levels such as Dongguan, Shenzhen, Dalian, Foshan and Ningbo are also among the top. The only exception is Suizhou, which is because of the lining out of Sui County. The mov index reflects the total length of space-time path relating to the average value of the whole country. The provincial capitals and other developed cities have large basic values of municipal district and built area themselves, and are also the most active regions on urban construction, with prominent changes and variation ranges in value between years and after being standardized. Furthermore, these active regions also see the expansion of administrative division, making the space-time path between years gain an outstanding lenghtening, so their mov indexes are higher and mainly focus on the “coastal-reverside” T-axis and knots of the provincial capital cities. The unsteadiness of these cities can be explained as their active behavior on urban development. But other middle-sized and small cities are on the contrary, so they get lower mov indexes.
The top ten cities of the tor index are Zhengzhou, Nanchang, Fuzhou, Zhangzhou, Hefei, Nanyang, Qingdao, Qujing, Mianyang, Jining, among which are both some provincial capitals and middle-size and small cities. The tor index is used to reflect flexing degree of each city’s inter-annual variation.
On the one hand, the development of the city itself will increase the flexing degree. On the other, the variation of the upstream cities in high development level and downstream cities in low development level areas will also make standardized values of these cities’ municipal district and built area flex, and these cities are more sensitive to this kind of external flexing. From the spatial distribution, cities with higher tor indexes are mostly located in the central areas, for example Chengdu Plain, coastal southeast Fujian and Shandong peninsula, which are also the intensive areas for cities in the middlestream of developmental level. Of course, not all cities in these areas have higher tor indexes. From the distribution features of lower tor index, cities with lower
tor indexes are distributed all over the country, which shows that the spatial expansion fluctuations of most cities are still steady.
The top ten cities of the sd index are Chongqing, Shanghai, Shenzhen, Beijing, Dongguan, Suizhou, Urumqi, Wuhan, Nanjing, Nanning, which are almost all similar with the order and spatial distribution characteristics of the mov index. This is because both the two indexes reflect relative situations relating to the average values path of the whole country, while the sd index attaches more importance to the variation degree of every path segment between every year and reflects the fluctuating degree on the time sequences.
Therefore cities with high path variation range have stronger fluctuations.
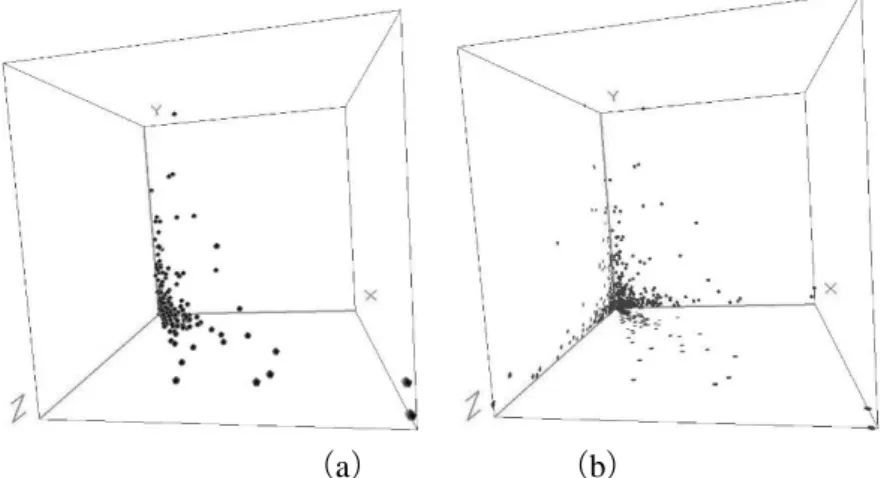
(a) (b)
Figure 5. Three-dimensional coordinate system of space-time stability index
On this basis, the paper puts the three indexes into the same three- dimensional coordinate system, as it is shown in Figure 5. Coordinates x, y and z represent the mov index, tor index and sd index respectively, and the diagram on the left is a 3D scatter diagram, and on the right is a 3D projection chart. It is not difficult to find that the 3D scatter diagram is almost all on one section of the 3D coordinate system. This is because the mov index and sd index are similar to each other. Seen from the x-z coordinate system’s projection, the two indexes are in a positive corelation relationship. But the distribution of the two indexes are not totally the same. For example, Beijing, Nanning have higher sd indexes, while Guangzhou, Nanjing have higher mov indexes. On the y-axis cities with a high tor index always have low sd and mov index, with the subpoints of x-y coordinate, y-z coordinate almost all in the inclined half area, which shows an inverse correlation. Above all, the
“ranking-size” structure of cities in China’s urban system has influenced their spatial expansion scale. Those developed eastern and central cities in the
“polar nucleus” positions of the western areas have relatively high degreed of economic agglomeration and urban competiveness, so the spatial expansions in both municipal district and built district are fairly active. And with their own large basic values, their variation shows a more prominent unsteadiness on the mov and sd index. The cities, with their own specific situations, also have differences in their mov and sd values; while those cities in the middle of the “ranking-size” level system also have an active urban spatial expansion as well as a high sensitiveness to the variation in the national city rankings due to their high tor index; cities in the downstream of the “ranking-side” level system are located all over the country, most of which are in western and central areas. Because they have small basic values, the variation ranges are relatively low, and their expansions of municipal district and built area are also limited.
4. CONCLUSION AND DISCUSSION
Based on the two important variables which are municipal district expansion and built area expansion, this paper establishes correlation models reflecting the urban spatial expansion and its steadiness, and draws conclusions as follows:
(1) From 2000 to 2010 China stepped into an active stage with rapid urban development. During this period of time many cities expanded their municipal district areas and got enough reserve land resource through the administrative division adjustment. These cities are mainly located in the areas of Yangtze River Delta, Pearl River Delta, Beijing-Tianjin Region, southeast Fujian or surrounding the provincial capitals of the western and central areas.
With rapid economic development, urban constructionis also developing quickly. As for the pattern of the built area expansion, its agglomeration characteristics are not as polarized as that of the municipal district, but it has a rapid development scale in each large urban agglomeration. The pattern almost always accords with China’s fundamental realities in the times of rapid urbanization development.
(2) The method of structuring coordinate system with the standardized built area and municipal area to draw the space-time path diagram of spatial expansion in each city can satisfy not only the comparability of a certain city relating to other cities in the country, but also the comparability between each year. The result shows that basically both average lines rise year by year, while few years get a short period of decrease influenced by the national maximum and minimum values. With the average lines as boundaries, the urban spatial expansion tracks can be divided into four quadrants. The result shows that there are more cities stablizing in the four quadrants, with most cities in the LL quadrant, and cities that show unsteadiness and span over quadrants are mainly within the once stepping type. Every city has its own characteristics of the spatial expansion. The conflict between the municipal district areas and built land areas has become an acute probelm during the rapid urbanization period. Cities should be fully aware of the demand of the urban development.
They should firstly consider the rankings and positions of the city in its urban system or urban agglomeration, should meet the demand of the built up area saturation through administrative division adjustment, and at the same time should avoid the overexpansion of the municipal district and thus enter into the HL development pattern, in order to guarantee the order and healthy spanning over the types.
(3) According to the geometric property of the fold line, the paper uses mov, tor and sd indexes to explore the space-time steadiness characteristics of the urban spatial expansion. The result shows that the space-time steadiness characteristics in different “ranking-size” levels have a large discrepancy, as the cities in the east coastal areas and center of western and central areas are more sensitive to the mov index and sd index of the national level, for which there are obvious changes both in the absolute lengths and the variation degree of interannual segmentation. Meanwhile, those cities which are middle ranked are sensitive to tor which reflects an obvious change when a city carries out an administrative division adjustment in different years. Apparently, the regional developmental pattern in China has deeply influenced the spatial expansion in urban areas. In the eastern areas the point-axle net system has been increasingly improved, while in the western areas there are still many regions with a point-section pattern, and the functional position of each city to its surrounding areas is greatly different. The space-time path of spatial expansion in urban areas themselves becomes dependent on the regional economic background.
This paper studies the space-time path of spatial expansion in urban area and its steadiness with the help of geometry, which is a new attempt and exploration, in order to offer a reference to the administrative division adjustment and urban construction. However, the process of spatial expansion in urban areas is a complex systematic process, so there are still many driving factors behind the municipal district expansion and built up area expansion.
Therefore, exploring the mechanism of the urban spatial expansion and its space-time steadiness considering multi-elements including society, economy, eco-system, agriculture, et cetera, is the key issue for the future research.
REFERENCES
Anselin, L., Rey, S. (1991). “Properties of tests for spatial dependence in linear regression models”, Geographical analysis, 23(2), 112-131.
Batty, M. (1998). “Urban evolution on the desktop: Simulation with the use of extended cellular automata”, Environment and Planning A, 30(11), 1943-1967.
Batty, M., Couclelis, H., et al. (1997). “Urban systems as cellular automata”, Environment and Planning B: Planning and Design, 24(2), 159-164.
Dai, J.L., Gao, X.L., et al. (2010). “Expansion of urban space and land use control in the process of urbanization”, Geographical research, 29(10), 1822-1832.
Fan, J., Tao, A.J., et al. (2010). “The coupling mechanism of the centroids of economic gravity and population gravity and its effect on the regional gap in China”, Progress in Geography, 29(1), 87-95.
Li, J. and Sun, Y.B. (2007). “Time stability test on Time series econometric models”, Statistics and Decision, (7), 18-19.
Liu, S.H., Chen, T., et al. (2008). The spatial and temporal patterns of urban land use in coastal area, Commercial Press, Beijing.
Qi, W. and Wang, S.M. (2010). “The construction of urban-regional spatial development pattern based on geographical polyline method”, Economic geography, 30(7), 1080-1084.
Qu, S.M. (2012). “The administrative division adjustment mode during urbanization process in China”, Urban exploration, (7), 6-7.
Rey, S.J. (2004). “Spatial analysis of regional income inequality”, in: Goodehild M, Janelle D (eds.), Spatially Integrated Social Science: Examples in Best Practice, , USA, Oxford University Press, Oxford, 280-299.
Rey, S.J. and Janikas, M.V. (2006). “STARS: space–time analysis of regional systems”, Geographical Analysis, 38(1), 67-86.
Shen, T.Y., Feng, D.T., et al. (2011). Spatial Econometrics, Peking University Press, Beijing.
Wang, J.F., Wu, J.L., et al. (2005). “Techniques of spatial data analysis”, Geographical research, 24(3), 464-472.
Wang, K.Y. and Chen, T. (2011). “The experience reference of administrative division adjustment in abroad and the apocalypses for China”, World regional studies, 20(2), 57-64.
William, H.G. (2011). Econometric Analysis (Sixth Edition), Renmin University of China Press, Beijing.
Yi, D.H. (2011). The method and application of Time series analysis, Renmin University of China Press, Beijing.
Zhang, L., Lei, J., et al. (2011). “The features and influencing factors of urban expansion in China during 1997-2007”, Progress in Geography, 30(5), 607-614.
Zhou, Y.X. (2006). “The thinking and discussion on China's urbanization rate”, City planning, 30(B11), 32-35.