Development of Combined Downscaling Method for High‑resolution Rainfall Estimation and
River‑Runoff and Inundation Simulation under Global Warming Condition
著者 チアン アン クワン
著者別表示 Tran Anh Quan journal or
publication title
博士論文要旨Abstract 学位授与番号 13301甲第4832号
学位名 博士(工学)
学位授与年月日 2018‑09‑26
URL http://hdl.handle.net/2297/00053079
doi: 10.1186/s40645-018-0185-6
Creative Commons : 表示 ‑ 非営利 ‑ 改変禁止 http://creativecommons.org/licenses/by‑nc‑nd/3.0/deed.ja
Summary
Development of Combined Downscaling Method for High-resolution Rainfall Estimation
and River-Runoff and Inundation Simulation under Global Warming Condition
Graduate School of
Natural Science and Technology Kanazawa University
Division of Environmental Design
Student ID No: 1524052013 Name: Tran Anh Quan
Chief Advisor: Associate Professor. Kenji TANIGUCHI
Date of submission: 2018/06
1 Abstract
In this study, the present and future rain-fall-runoff and inundation conditions of Cau- Thuong-Luc Nam river basin during rainy season (Jun-July-August) were also examined using the combination of the Weather Research and Forecasting (WRF) and River Run-off and Inundation model (RRI). The essential future precipitation inputs for RRI were achieved by using the WRF model nested inside GFDL-CM3, and MIROC-5 models. The future climate and hydraulic condition indicated heavier rainfall conditions in the mid-21st century and consequently cause severe inundation with higher depth, wider radius and longer period. Heavy rainfall and inundation were expected to increase in the second half of rainy season. Future inundation condition will affect mostly the agricultural and residential areas in the lower Cau- Thuong-Luc Nam river basin. Since dynamical downscaling is computational expensive, we propose a new dynamical-statistical downscaling technique by incorporating WRF with artificial neural networks (ANN) for rainfall dowsncaling. The simulation results of the coupling method produced high-resolution rainfall patterns that are highly correlated with WRF (r = 0.91) and have low RMSE (12 mm/day). Running WRF-ANN coupling method for high-resolution rainfall downscaling is 89% less computational expensive than running WRF high-resolution simulations.
I. OBJECTIVES
There is a growing trend in the demands of using high-resolution climatological data for planning and management activities and that thus, raising the need of adopting weather downscaling techniques. The drawbacks of the available methods hinder the further application of these techniques while they are neither too costly nor too limited in reliability. The first aim of this study is to investigate the ability to couple both dynamical downscaling with statistical downscaling for high-resolution rainfall forecasting that can be easily adopted whilst maintaining the accuracy. The case study chose in the Red River Delta in Vietnam. Secondly, the inundation and flood problems in future condition will be addressed in this study, using the combination of weather researching model and hydrological model driven by CMIP5 multi- model dataset. Finally, giving the key findings, research limitations and suggestion for future works in upgrading the proposed methods and extend its applicability.
II. DATA AND METHODOLOGIES
Researching rainfall runoff and inundation in Cau-Thuong-Luc Nam watershed in Vietnam under global warming
To research the rainfall run-off and inundation condition in Cau-Thuong-Luc Nam
(CTLN) watershed in Vietnam under global warming, the WRF model version 3.4 was used
for downscaling climate data and River Run-off and Inundation model (RRI) version 2.1.1 was
used for simulation of hydrological condition over the river basin. Figure 1 shows the basin of
2
the CTLN watershed with annual normal flow of average 22 l/s per km
2. The flow of the whole CTLN region varies upon rainfall regime which distinguished into 2 seasons, the flood season from Jun to August and low flow season from September to May. At first, the reproducibility of WRF model for the CTLN regions was assessed by comparing the simulation results with observation daily rainfall from 2002 to 2009. Meanwhile, the verification for the configuration of RRI model was conducted using observation rainfall and discharge data for 2009 rainy season. Then, the future climate conditions for the region was given by the MIROC5 and GFDL-CM3 using RCP8.5 scenario and inputted into RRI model to investigate the future hydrological condition of the river basin.
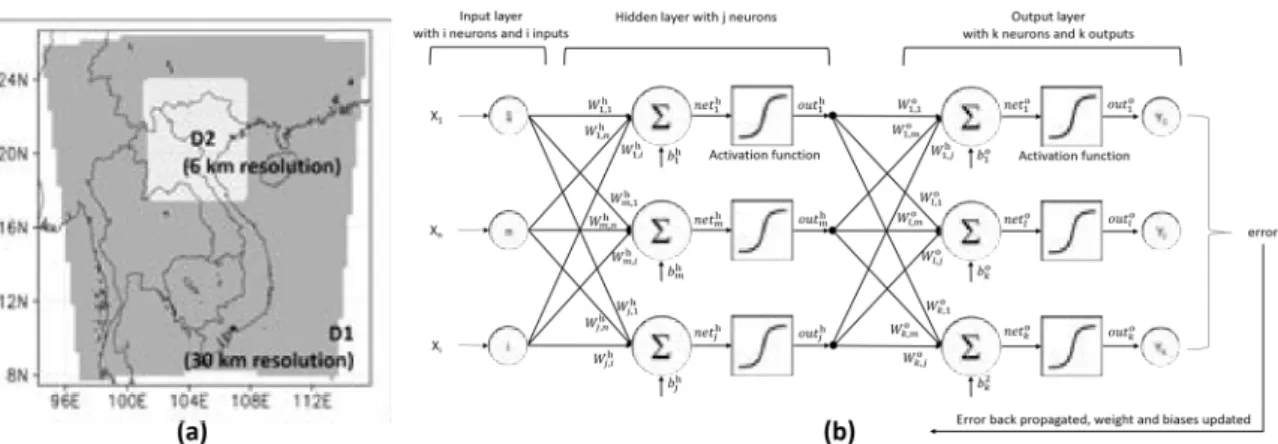
Coupling dynamical and statistical downscaling for high-resolution rainfall forecasting In this dissertation, coupling dynamical and statistical downscaling for high-resolution rainfall forecasting was conducted using the Weather Research and Forecasting model (WRF) version 3.6 combined with Artificial Neural Network model (ANN). For WRF, a two-domain, two-way nesting grid system was used over the Red River Delta in Vietnam with the spatial resolution of the mother and child domains were 30km and 6km respectively (Figure 2(a)). For ANN model configuration, the three hidden layers Feed Forward Artificial Neural Network (FFANN) was adopted using Levenberg Marquardt training algorithm. The simple multilayer perceptron ANN of the kind used in this study is shown in Figure 2(b).
Figure 1 The target areas for WRF and ANN models, in which (a) The outer 30 km resolution (D01) and inner 10 km resolution domains (D02) are shown in the grey and white colors, respectively, the red rectangular indicate the locations of the researching area. The blue region represents the area of CTLN river basin.
Figure 2 (a) the target domains and (b) simple multilayer perceptron ANN
3
The essential of coupling method is to feed the downscaling results from WRF into ANN for training and testing. The intermediate 30-km resolution output for 17 climate variables will be taken as the predictors for ANN while the rainfall output of the high-resolution 6-km domain will be taken as predictand. Figure 3 illustrate the principle of predictors and predictand grids selection.
During the preliminary stage, numerous ANN models were tested to find the most effective network design for rainfall downscaling. In this section, several distinctive models, whose structures were considered as the most presentable for the trial-and-error tests, are presented, with the details of these models summarized in Table 1.
III. RESEARCHING RAINFALL RUNOFF AND INUNDATION IN CAU-THUONG- LUC NAM WATERSHED IN VIETNAM UNDER GLOBAL WARMING
Reproducibility of WRF model
Figure 4 compares the JJA rainfall averaged for 56 rain gauges and corresponding grids from 2002 to 2009. It can be seen from the results that JJA rainfall reproduced by simulation results for historical climate condition (or control simulation - CTL) varied from 72.1% to 90.0% of observation data and consistently underestimated. Average spatial correlation coefficient for 8 years (2002-2009) calculated between CTL and OBS was 0.78, indicates the relatively good agreement between simulation results and observation. Verification result indicates the WRF model can be used for rainfall downscaling in CTLN watershed with reasonable accuracy.
Figure 3 Predictor and predictand grid selection principles
4
T abl e 1 D is tinc tive A N N m ode ls c ons ide re d in the pr el im ina ry te st
Mo d el Ar ch ite ct u re
a)Tr an sf er Tr ai n in g d at a Tr ai n in g s et d im en si o n fu n ct io n M1 n 16 -10 -5 -3 -1 LS
b)slp, t2, hgt, pblh 4 NV s
d)x 4 g ri d s M1 a 4 -4 -4 -4 -1 LS slp, t2, hgt, pblh 4 AV s
e)M1 s 4 -4 -4 -4 -1 LS slp, t2, hgt, pblh 4 S V s
f)M2 n 20 -12 -8 -5 -1 LS Rd 1 , s lp , t 2 , h g t, p b lh 5 NV s x 4 gr ids
M2 a 5 -5 -5 -5 -1 LS Rd 1 , s lp , t 2 , h g t, p b lh 5 AV s
M2 s 5 -5 -5 -5 -1 LS Rd 1 , s lp , t 2 , h g t, p b lh 5 S V s
M2 d 20 -12 -8 -5 -1 HTS
c)Rd 1 , s lp , t 2 , h g t, p b lh 5 NV s x 4 gr ids
M2 e 20 -20 -10 -5 -1 HTS Rd 1 , s lp , t 2 , h g t, p b lh 5 NV s x 4 gr ids
M3 n 28 -20 -10 -7 -1 HTS slp, tk, hgt, pblh, u10, v10 , gr df lx 7 NV s x 4 gr ids
M4 n 32 -25 -20 -10 -1 HTS Rd 1 , t k , h g t, sl p , g rd fl x , p sf c, p b lh , q 2 8 NV x 4 gr ids
M4 a 8 -6 -5 -5 -1 HTS Rd 1 , t k , hgt, slp, gr df lx, psf c, pblh, q2 8 AV s
M4 as 16 -10 -5 -3 -1 HTS Rd 1 , t k , h g t, sl p , g rd fl x , p sf c, p b lh , q 2 8 (AV s+ S V s)
M5 n 32 -25 -20 -10 -1 HTS Sa m e as M4 n b u t f o r r ai n fa ll ev en ts
a)
Mo d el a rc h ite ct u re in d ic at es th e n u mb e r o f n eu ro n in e ac h la y er o f a 5 la y ers M L P n et w o rk , w h e re in fi rs t n u mb er is n eu ro n s o f input, the f ollow ing 3
num be rs ar e ne ur ons of hidde n la ye rs, a nd the la st one is ne ur ons of the output la ye r.
b) LS : Lo g is tic S ig mo id .
c) HTS : H ype rbolic Ta nge nt S igm oid
d, e, f) NV, AV and S V cor re spond to nor m al va ri able , a ve ra ge d v ar ia ble a nd sta nda rd de via tion va ria ble , r espe ctive ly; in w hic h:
- NV s ar e dir ec tly extr ac te d fr om the 4 -pr edic tor g rids, so the a ctua l nu m be r of va ria bl e are m u lti p lie d to 4 ;
- AV s ar e the ne w fe atur es cr e ate d by com puting the m ea n of e a ch va ria ble in the 4 -pr edic tor
5 Simulation of RRI models for historical flood events
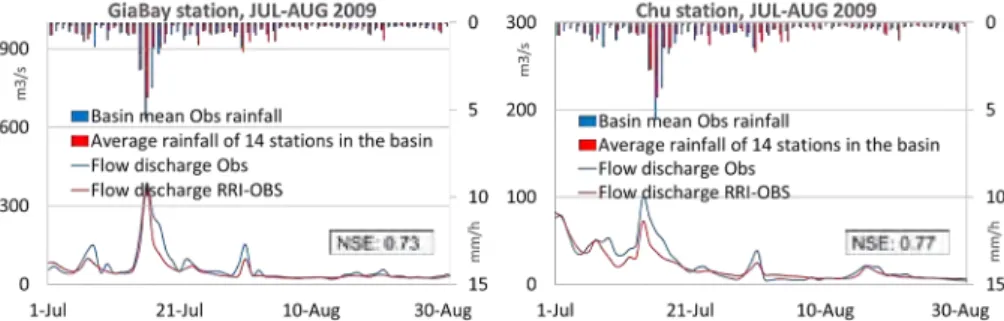
Observation rainfall data in July-August 2009 was fed into RRI model to examine the accuracy of the model to represent the flood events. Comparison of river discharge between RRI simulated results (RRI-CTL) and observation data was shown in Figure 5. Nash- Sutcliffe efficiency coefficient (NSE) results showed the good match between simulated results and OBS in the decreasing trend of river discharge at the end of the rainy season. Since the NSE index in sensitive to extreme value, the high NSE results also suggested that extreme discharge periods were relatively well predicted.
Simulation results slightly overestimated the peaks of river discharge. However, peaks of large and small floods are correctly reproduced for each stations in RRI simulation. Verification results show the good applicability of adopting RRI model to further investigation of the future hydrological condition of CTLN river system.
Future trend in rainfall intensity
WRF daily rainfall outputs during JJA for 10-years periods of CTL (2000-2009), GFDL- CM3 and MIROC-5 (2060-2069) was used as inputs for RRI model to examine the variation of rainfall distribution over the CTLN river basin. Spatial distribution of 10-years average JJA rainfall clearly shows the future higher intensity of rainfall throughout the watershed. Average JJA rainfall indicated by CTL, GFDL-CM3, and MIROC-5 were 607 mm, 872 mm, and 682 mm, respectively. Future scenario forecasted by both GFDL-CM3 and MIROC-5 indicated the similar rainfall distribution patterns with present where the major amount of JJA rainfall concentrated on the upper river basin, especially the far north and eastern corner
Future trend of flood and river runoff
Future precipitation was predicted to increase during mid-21st century. Increasing river discharge is found in Figure 6. RRI simulated river runoff in CTL (2000-2009) were comparable with GFDL-CM3 and MIROC-5 (2060-2069) in the first period of the rainy season with no significant difference in average river discharge. Differences caused by higher rainfall intensity in the future scenario was found mostly in the latter half of the rainy season when future river discharge was projected larger than CTL. Future river discharge in MIROC-5 is slightly larger than in CTL at during the peak runoff period and equal to CTL at the end of rainy season. In Gia Bay station which locates in the largest branch of CTLN watershed, MIROC-5 show clear higher average discharge than in CTL. In Chu station, MIROC-5 exhibited higher discharge at late July-early August and similar to CTL at the end of JJA.
Figure 4 JJA rainfall averaged for 56
observation sites and corresponding grids in
CTL from 2002 to 2009 (mm)
6
Figure 7 illustrates the maximum inundation depth by CTL and future projections. The distribution map for maximum depth was prepared by selecting the highest value of depth for every grid in the CTLN watershed during a 10-year period. Projection by GFDL-CM3 and MIROC-5 both indicate the more severe inundation in the lower river basin, about 0.5-1 meters higher than in CTL. Extreme flood (inundation depth > 3 meters) occur in more locations with extended inundation radius. Closer to main river channels at the downstream, the common inundation depth caused by the worst future flood situation in GFDL-CM3 and MIROC-5 are 2-3 meters, much higher than CTL
Duration of extreme flood events
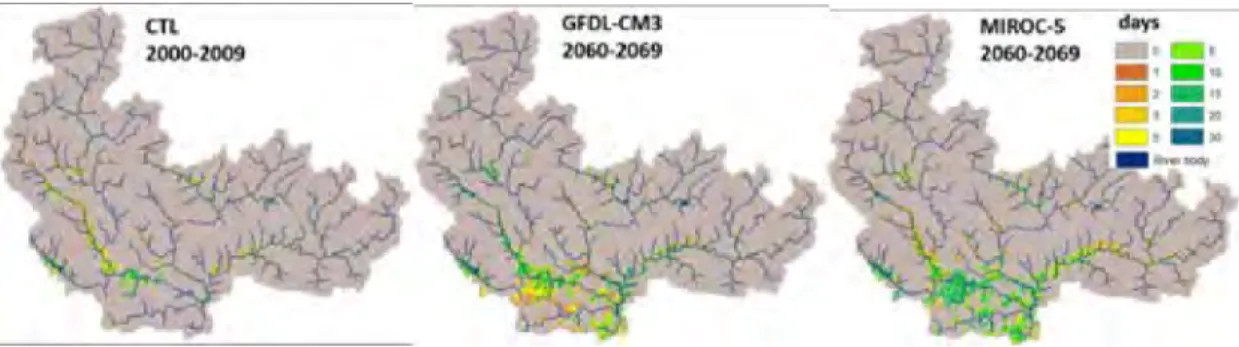
To obtain the overview of future flood condition in CTLN watershed, we further assessed the influences of the heavy flood by calculating the duration of inundation depth of over 100cm (IDO100) during JJA. The maximum duration of IDO100 were calculated for every grid in 10- year periods in present (2000-2009) and future condition (2060-2069).
Figure 8 compares the average duration of IDO100 between CTL, GFDL-CM3, and MIROC-5. According to CTL results, some areas adjacent to the left downstream river branch and some small areas in the right branch are frequently affected by the heavy flood with an average period of 0.5 – 0.8 days. The lower river basin region is quite safe without significant
Figure 5 Basin mean precipitation and river discharge by RRI model and observation data in Gia Bay and Chu stations during JJA in 2009
Figure 6 Daily precipitation and river discharge for present and future condition
at Chu and Gia Bay stations
7
impacts by a long flood. In contrast, Both GFDL-CM3 and MIROC-5 projected more severe flood trend not only at near river channel but also in the lower river basin.
III. COUPLING DYNAMICAL AND STATISTICAL DOWNSCALING FOR HIGH- RESOLUTION RAINFALL FORECASTING
Dynamical Downscaling Experiment
This section evaluates WRF’s ability to reproduce weather conditions in research domain Table 2 shows evaluation statistics for the spatial distribution of mean rainfall from WRF simulation for D1 and D2 as compared with observed rainfall at 38 rain gauges in 1996, 1997, 1998, and 2006, along with the statistical measures R and IOA. Results indicate reasonable accuracy for the WRF outputs in reproducing the spatial distribution of rainy season (JJA) rainfall.
Results of the ANN preliminary training stage
Table 2 (a, b) indicates the training stage results of rainfall downscaling, using the MLP- based ANN on different model configurations as mentioned in Table 1. To compare the predicted model outputs with the desired rainfall output of the target domain (RD2T), various statistical measurements were adopted. Results of the training stage show substantial variations in performance among the models. The training results improved with regard to higher model complexity; however, there was clear consistency in network performance, with most models exhibiting similar correlation coefficients in the training and test sets. The cross-validation
Figure 7 Maximum level of inundation depth in CTLN watershed during JJA
Figure 8 Maximum period of inundation depth of over 100 cm
8
method was proven to be effective in detecting the best generalization point and stopping the training process before the model shifted to over-learning. The M4 series and M5n were clearly better than the other models, as their predictions were close to that of target data, yielding significantly lower RMSE. The study results indicate that a combination of AV and SV features might be better in detecting dry-day events (DDE). Adding more predictor variables have proven to be helpful in increasing model accuracy. The RE-ANN calibration method was employed for the M5 model to successfully map a total of 27.43% DDE grid cells, which was smaller than that of target data by a small margin.
Results of WRF-ANN downscaling of an independent dataset
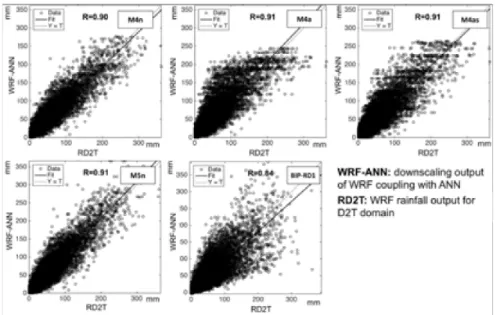
The second testing stage in this study aimed to further assess the applicability of coupling ANN to WRF output for high-resolution rainfall downscaling and compare it with the interpolated data using a bilinear interpolation method. We selected the ANN architectures that demonstrated the most promising global approximation abilities during the training stage (the M4 model series and M5n) to apply for an independent dataset for the year 2006. In addition, we also used bilinear interpolation to downscale RD1T from 30 km to 6 km (denoted BIP- RD1). The regression plots for the target and forecast rainfall are plotted in Figure 4.
Differences in correlation coefficient metrics were observed, although they were insignificant. The correlation coefficients (> .9) for simulation outputs in this stage were comparable to results from the preliminary stage, indicating good model reproducibility. ANN incorporates the dynamical processes given by WRF during the training processes. This added value provided by ANN helped to capture fine-scale variations in the downscaling results. It is therefore reasonable to find that downscaling with ANN outperformed the bilinear interpolation method.
Table 2a RMSE and R
2for training and test sets of different ANN model configurations
M1n M1a M1s M2n M2a M2s M2d M2e
R
2of Training set 0.32 0.25 0.19 0.91 0.92 0.85 0.91 0.91 R
2of Test set 0.29 0.23 0.13 0.85 0.85 0.76 0.85 0.88 RMSE for all dataset (mm/day) 32.53 35.53 35.94 13.24 12.95 18.49 14.52 12.93 DDE in full-dataset (%) 0.01 0.01 0.04 10.34 3.24 21.94 11.14 11.84
Table 2b RMSE and R
2for training and test sets of different ANN model configurations
M3n M4n M4a M4as M5n RD2T
R
2of Training set 0.62 0.92 0.92 0.93 0.92
R
2of Test set 0.51 0.92 0.91 0.92 0.92
RMSE for all dataset (mm/day) 28.47 9.44 8.67 8.94 10.42
DDE in full-dataset (%) 2.32 14.53 11.59 20.53 27.43 27.74
9
Comparisons between the ANN models and target data with regard to the frequency of dry days, wet days, and extreme rainfall events is shown in Figure 10. ANN downscaled the rainfall in all models, clearly demonstrating a good pattern-correlation. The highest rainfall areas were accurately located in the southwestern corner of D2T, and rainfall gradually decreased towards the northeast. All models exhibited larger estimation errors in the northwestern part of target domain, especially in the high terrain and surrounding area. Since M5n neglected very small rainfall values during calibration, it potentially avoided bias intensification by small rainfall values during training. The model behavior suggests that small
Figure 9 Regression plots for target and forecasted rainfall in 2006
Figure 10 Spatial distribution of cumulative rainfall (mm) in JJA of 2006
10
rainfall values, which accounted for 10% to 40% of the dataset, were difficult to reproduce by ANN. However, they can be addressed using the RE-ANN calibration methods.
Predictor sensitivity analysis
To obtain a comprehensive view on the applicability of coupling WRF and ANN to downscaling, the influence of each input predictor on the output should be investigated. RD1 has the largest impact on the predictand. Excluding RD1 substantially reduced network performance. Meanwhile, the model indicated the second largest impact by q2, while the third and fourth most important parameters were tk and slp, whose results were very similar to each other. Among the remaining variables, grdflx differed from the others by a higher RMSE, achieving the fifth position. The remaining variables pblh, psfc, and hgt were the least important, since the models trained without them were comparable to the original M5n model.
While NV features tend to yield more error, they can resolve the spatial variability of rainfall. Meanwhile, generalized features such as AV and SV can better control the bias in prediction values, but have lower effective resolution. NV features were concluded to be the best fit for making WRF-ANN models.
Computational Cost
The expected results when adopting WRF-ANN over WRF include a comparable
downscaling quality with reduced computational load and time. Since the step of downscaling
from 30-km to 6-km resolution using ANN gives results instantly, the advantage of using WRF-
ANN methods was measured by comparing the time consumption needed by WRF to
downscale rainfall to 30 km or to 6 km. Our measured results indicate that WRF downscaling
to 6-km resolution took 9.3 times longer than downscaling to 30-km resolution. Rainfall
downscaling using the WRF-ANN method can therefore save up to approximately 89% of the
computational cost, as compared to downscaling using WRF alone.
平成3 0年 8月 9日 1. 学位論文題目
学位論文審査報告書(甲)
(外国語の場合は和訳を付けること。)
D
匂Y!;)lQP互粗麒_9f..\;_9_mhi煕.cJ..如�n�.Galing__ m!'lthQcJ..far .. hi-gl;\:r.!'l�.Ql!!t.iaQn.xamfaU.
煕l!t.iamatiQn.. and J:iY!;)!'.:!:!!!l-.Q灯.an.d.in!!-.叫邸i
叩.§i
煕!!latiQ!1.!!-;叫!'lrnlQhaLw
忠:m-.ing.i;Qnm.tifl!l-... .
塊惑盪暖北.に伴立流城水循環蛮侶
.咬.�志.:'::.ど
.亡 1/ 旦/.と廣解像度降惑売測
.咬.た
.む翌猿金 的ダウンスケ
ーリング手法の開発
---···
2. 論文提出者(1)所
属
環境デザイン学専攻
ふり がな ち あ ん あ ん く わ ん
(2)氏 名 TRAN ANH QUAN 3. 審査結果の要旨(600~650字)
....