熊本大学学術リポジトリ
Pulsed streamer discharges generated by sub‑microsecond pulsed power in air
journal or
publication title
Digest of Technical Papers‑IEEE International Pulsed Power Conference
volume 2005
page range 997‑1000
year 2005‑06
URL http://hdl.handle.net/2298/9716
doi: 10.1109/PPC.2005.300469
PULSED STREAMER DISCHARGES
GENERATED BY SUB-MICROSECOND PULSED POWER IN AIR D. Wang, M. Jikuya, S. Yoshida, T. Namihira
ξ, S. Katsuki, H. Akiyama
Department of Electrical and Computer Engineering, Kumamoto University 2-39-1 Kurokami, Kumamoto 860-8555, JAPAN
ξ
email: [email protected]
Abstract
The non-thermal, chemically active plasma is one of the promising technologies for the removal of the hazardous environmental pollutants. Pulsed streamer discharges in atmospheric pressure gases have received a great deal of interest for many years. It is very important to know the propagation mechanism of streamer discharges in order to improve the energy efficiency of pulsed discharge systems.
In the present work, a Blumlein generator that has a pulse width of 100 ns was used to investigate the streamer discharge propagation. The propagation images in a coaxial reactor were taken by a streak camera for both positive and negative polarities of the applied voltage.
From the results, primary and secondary streamers were observed propagating from the inner wire electrode to the outer cylinder electrode, and the maximum propagation velocity of the streamer head were 0.6 - 1.2 mm/ns in the range of 43 - 93 kV of the absolute value of the applied voltage. The propagation velocity of the positive streamer was faster than that of the negative polarity. The electric field at the wire electrode for streamer onset was 12 MV/m for the positive streamer and 20 MV/m for the negative streamer.
I. INTRODUCTION
Pulsed streamer discharges in atmospheric pressure gases have been studied for many years since it is one of the promising technologies for the removal of the hazardous environmental pollutants [1, 2]. A number of researches have been reported in the structures, the propagation velocity, the temperature, and the formation mechanisms of the streamer [3, 4]. The detailed investigation of the development of streamer discharge is beneficial for the understanding of the mechanisms of the pollution control, and then can open the road to the success of practical applications [5, 6].
In the present work, the pulsed streamer discharges produced by both positive and negative voltages were observed using a streak camera. The propagation velocity and electric field for streamer onset are reported.
II. EXPERIMENTAL APPARATUS AND PROCEDURE
Fig. 1 shows a schematic diagram of the experimental arrangement. A three-staged Blumlein line generator with a pulse width of 100 ns was used [7]. This generator was charged at 20, 25, and 30 kV. To reduce the switching jitter, a thyratron switch (CX1685, E2V Technologies, Ltd., UK) which has smaller jitter than spark gap switches was employed as the closing switch of the Blumlein line generator. A concentric coaxial cylindrical reactor was employed as a discharge electrode.
A rod made of stainless steel, 0.5 mm in diameter and 10 mm in length, was placed concentrically in a copper cylinder. The cylinder electrode was grounded and its diameter was 76 mm. A short length of the electrodes was necessary to render clear images of the streamer discharge.
Dry air at 0.1 MPa was filled up to the electrodes. Either positive or negative voltage polarity was applied to the rod electrode and was measured using a voltage divider (1Ω : 10 kΩ). The discharge current through the electrodes was measured using a current monitor (Pearson current monitor, Model 2877, Pearson Electronics Inc., USA), which was located on the return current to the ground. A digital oscilloscope (54855A Infiniium, Agelint Technologies, USA) with a maximum bandwidth of 6 GHz and a maximum sample rate of 20 G samples/sec recorded the signals from the voltage divider and the current monitor. A high dynamic range streak camera (C7700, Hamamatsu Photonics, Japan) with a sensitive MCP (Micro Channel Plate, maximum gain 10,000) was used to observe the images of streamer
Blumlein Generator
Oscilloscope
Personal Computer
Camera Trigger
Voltage Signal Current Signal
ThyratronTrigger
Thyratron Trigger Monitor Delay Generator
Digital Image Discharge
Electrode
Blumlein Generator
Oscilloscope
Personal Computer
Camera Trigger
Voltage Signal Current Signal
ThyratronTrigger
Thyratron Trigger Monitor Delay Generator
Digital Image Discharge
Electrode
Figure 1. Schematic diagram of the apparatus.
discharge propagation. The sweep time for one flame was fixed at 200 ns. The slit of the camera was adjusted to focus the central part of the discharge electrode, where the rod electrode was fixed at the center of streak image.
The width of the camera slit was fixed at 50 µm. A digital delay generator (DG535, Stanford Research Systems, Inc., USA) controlled trigger signals for the oscilloscope, the thyratron, and the camera.
Fig.2 shows a typical streak images taken by the streak camera. It is to explain the details of the following results.
The upper image shows a still view from the camera slit.
The lower image is a streak image; it displays the change of discharge position in reactor with the sweep time of camera. In this case, the streamer head propagated from the inner rod to the outer cylinder electrode. Our previous result showed that the streamer heads propagate straight from the inner electrode toward the outer electrode due to the influence in electric field distribution of neighboring streamers [8], therefore the streak image in Fig. 2 follows the tracks of a single streamer head.
III. RESULTS AND DISCUSSIONS
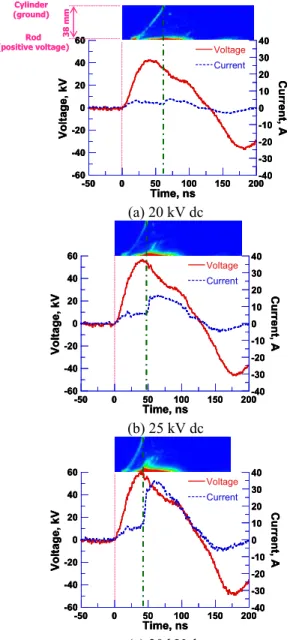
A. Positive streamers
The positive streamers were generated in the case that the voltage with positive polarity was applied to the rod electrode. Fig.3(a), (b), (c) show typical applied voltage to and the discharge current in the electrode gap and streak image for different dc charging voltages to the generator in case of positive streamers. The streak images shown in Fig.3 are corresponding to the half images of that in Fig.2, since the position of the streamer head is line symmetry of the rod electrode. In Fig.3, the vertical direction of the streak image indicates the position of the streamer head, and the horizontal direction indicates the time progress of the streamer head, since it corresponds to the time scale of the voltage and current waveforms. The images had good reproducibility under the same
Inner Rod Outer cylinder
50 µm (Camera slit width)
Time, 0 ~ 200 ns
Position, 0 ~ 38 mm
Brightness
Reference Image
Streak Image Inner Rod Outer cylinder
50 µm (Camera slit width)
Time, 0 ~ 200 ns
Position, 0 ~ 38 mm
BrightnessBrightness
Reference Image
Streak Image
Figure 2. Typical images taken by the streak camera.
experimental conditions. It is observed from Fig. 3 that the primary positive streamers (PPS) propagate from the rod electrode to the cylinder electrode. The track of the streamer head recorded a line shape. This is because the high electric field is generated around the streamer head which resulted from the surrounding positive charges, therefore only the streamer head is bright in the early stage of the propagation [9-13]. At the time of the PPS arrived to the cylinder electrode, a large flow of current was observed in the discharge current waveform. On the other hand, after the PPS left the rod electrode, the secondary positive streamer (SPS) was generated from the rod electrode and propagated toward the cylinder electrode. The SPS disappeared before it arrive to the cylinder electrode, because the electric field between the
-60 -40 -20 0 20 40 60
-40 -30 -20 -10 0 10 20 30 40
-50 0 50 100 150 200
Voltage Current
Voltage, kV Current, A
Time, ns
38 mm
Rod (positive voltage)
Cylinder (ground)
-60 -40 -20 0 20 40 60
-40 -30 -20 -10 0 10 20 30 40
-50 0 50 100 150 200
Voltage Current
Voltage, kV Current, A
Time, ns -60
-40 -20 0 20 40 60
-40 -30 -20 -10 0 10 20 30 40
-50 0 50 100 150 200
Voltage Current
Voltage, kV Current, A
Time, ns
38 mm
Rod (positive voltage)
Cylinder (ground)
(a) 20 kV dc
-60 -40 -20 0 20 40 60
-40 -30 -20 -10 0 10 20 30 40
-50 0 50 100 150 200
Voltage Current
Voltage, kV Current, A
Time, ns -60
-40 -20 0 20 40 60
-40 -30 -20 -10 0 10 20 30 40
-50 0 50 100 150 200
Voltage Current
Voltage, kV Current, A
Time, ns -60
-40 -20 0 20 40 60
-40 -30 -20 -10 0 10 20 30 40
-50 0 50 100 150 200
Voltage Current
Voltage, kV Current, A
Time, ns
(b) 25 kV dc
-60 -40 -20 0 20 40 60
-40 -30 -20 -10 0 10 20 30 40
-50 0 50 100 150 200
Voltage Current
Voltage, kV Current, A
Time, ns -60
-40 -20 0 20 40 60
-40 -30 -20 -10 0 10 20 30 40
-50 0 50 100 150 200
Voltage Current
Voltage, kV Current, A
Time, ns -60
-40 -20 0 20 40 60
-40 -30 -20 -10 0 10 20 30 40
-50 0 50 100 150 200
Voltage Current
Voltage, kV Current, A
Time, ns
(c) 30 kV dc
Figure 3. Applied voltage to and the discharge current in the electrode gap and streak image for different dc charging voltages to the generator. (Positive streamers)
998
gap is not strong enough to sustain the ionization of the air surrounding the SPS head after the arrival of the PPS.
The light emission of the SPS was still observed after the PPS arrived to the cylinder electrode. The time between from voltage rise time and the beginning of the PPS propagation can be explained as the charging time of the electrode gap. The results in Fig.3 showed a good agreement with our previous report [3].
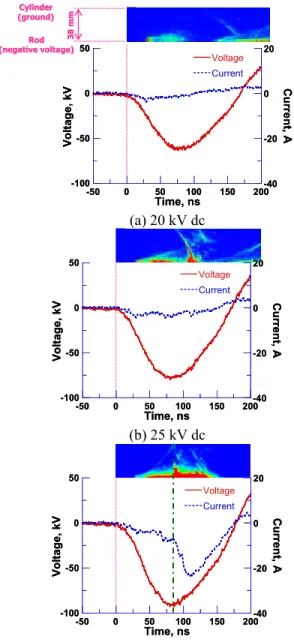
B. Negative streamers
The negative streamers were generated in case of that the voltage with negative polarity was applied to the rod electrode. Fig.4(a), (b), (c) show typical applied voltage to and the discharge current in the electrode gap and streak image for different dc charging voltages to the generator in case of negative streamers. It is observed from Fig.4 that the primary negative streamers (PNS) propagate from the rod electrode to the cylinder electrode, this is particularly clear in (c). For the lower dc charging voltages (Fig.4(a) and (b)), the discharge current in case of negative streamer is comparatively smaller than that of positive streamers, therefore fully development of the light emission from the PNS was not observed. The propagation of secondary negative streamer (SNS) is observed from Fig.4. After the peak of voltage waveform, the propagation of light emission form the cylinder electrode to the rod electrode is also observed after the peak voltage in Fig.4.
C. Velocity of streamer heads and the electric field for the streamer onset
From Fig.3, it can be observed that the time from initiation of PPS to its arrival to the cylinder electrode is shorter at higher dc charging voltages to the generator.
The propagation velocity of the streamer heads, v
streamer, is given by
t v
streamerL
∆
= ∆ (1)
where ∆L, ∆t are the developed distance from wire surface to the tip of streamer, and the time progress for its propagation in Fig.3, respectively. This is also applicable to Fig.4(c).
Fig.5 shows the dependence of the velocity of streamer heads on the applied voltage for the electrodes in both cases of positive and negative streamers. It is observed form Fig.5 that the velocity of positive streamer is same at certain voltages for all dc charging voltages, and the velocity increased with increasing the applied voltage for the wire electrode. The curved shape in the end of velocity line is due to the fell voltage following the positive peak in the Fig.3. The velocity for negative streamer is approximately half of positive streamers.
Table 1 shows the averaged velocity of the streamer heads. The results are calculated by the time from the initiation of the streamer head on the rod electrode to its arrival to the cylinder electrode divided by the gap distance.
-100 -50 0 50
-40 -20 0 20
-50 0 50 100 150 200
Voltage Current
Voltage, kV Current, A
Time, ns
38 mm
Rod (negative voltage)
Cylinder (ground)
-100 -50 0 50
-40 -20 0 20
-50 0 50 100 150 200
Voltage Current
Voltage, kV Current, A
Time, ns
38 mm
Rod (negative voltage)
Cylinder (ground)
(a) 20 kV dc
-100 -50 0 50
-40 -20 0 20
-50 0 50 100 150 200
Voltage Current
Voltage, kV Current, A
Time, ns -100
-50 0 50
-40 -20 0 20
-50 0 50 100 150 200
Voltage Current
Voltage, kV Current, A
Time, ns
(b) 25 kV dc
-100 -50 0 50
-40 -20 0 20
-50 0 50 100 150 200
Voltage Current
Voltage, kV Current, A
Time, ns -100
-50 0 50
-40 -20 0 20
-50 0 50 100 150 200
Voltage Current
Voltage, kV Current, A
Time, ns
(c) 30 kV dc
Figure 4. Applied voltage to and the discharge current in the electrode gap and streak image for different dc charging voltages to the generator. (Negative streamers)
0 0.5 1 1.5 2 2.5 3
0 20 40 60 80 100
20kV(positive) 25kV(positive) 30kV(positive) 30kV(negative)
Ve lo ci ty , m m /n s
|Voltage|, kV
Charging voltage
Figure 5. Dependence of the velocity of streamer heads
on the applied voltage for the electrodes.
In the present work, the applied voltages to the electrodes for the streamer onset of PPS on wire electrode were constant at 15 kV for all different dc charging voltages in Fig.3. Likewise, the applied voltage at the streamer onset time of PNS was -25 kV in case of dc charging voltage in Fig.4. Therefore, the electric field, E
0, on the surface of the rod electrode at the streamer onset is given by
1 2 0
ln r r r
E = V
applied(2)
where V
applied, r, r
1, and r
2are the applied voltage to the electrodes at the streamer onset time of PPS or PNS, the distance from the center of rod electrode, the radius of the rod electrode, and the radius of the cylinder electrode, respectively. In the present work, r is provided r = r
1. According to the Meek’s criteria (equation (3)), the streamer onset occurs when the electric field caused by positive ions that left after avalanche, E
s, reached to the electric field on the surface, E
0[13].
(3)
kE
0E
s=
where k (k = 0.1 - 1) is the constant. In the present work, k is provided k = 1. Table 2 shows the electric field at the streamer onset time in the present work.
Table 1. Averaged velocity of streamer heads.
Charging voltage
Polarity
20 kV dc 25 kV dc 30 kV dc
Positive
(Vapplied-peak)
0.8 mm/ns (43 kV)
1.0 mm/ns (56 kV)
1.2 mm/ns (60 kV) Negative
(Vapplied-peak)
- - 0.6 mm/ns
(-93 kV) Table 2. Electric field for the streamer onset.
Polarity
Factor
![Fig. 1 shows a schematic diagram of the experimental arrangement. A three-staged Blumlein line generator with a pulse width of 100 ns was used [7]. This generator was charged at 20, 25, and 30 kV](https://thumb-ap.123doks.com/thumbv2/123deta/5661506.2007394/2.918.455.811.851.1006/schematic-diagram-experimental-arrangement-blumlein-generator-generator-charged.webp)
![[第 1 章]](data:image/gif;base64,R0lGODlhAQABAIAAAP///wAAACH5BAEAAAAALAAAAAABAAEAAAICRAEAOw==)