Should energy efficiency be traded off for other product attributes? : an analysis of air‑conditioner regulation in Japan
著者 Kubo Kensuke, Watanabe Mariko, Kojima Michikazu
権利 Copyrights 日本貿易振興機構(ジェトロ)アジア
経済研究所 / Institute of Developing
Economies, Japan External Trade Organization (IDE‑JETRO) http://www.ide.go.jp
journal or
publication title
IDE Discussion Paper
volume 607
year 2016‑06‑01
URL http://hdl.handle.net/2344/1570
INSTITUTE OF DEVELOPING ECONOMIES
IDE Discussion Papers are preliminary materials circulated to stimulate discussions and critical comments
* Deputy Director, Microeconomic Analysis Studies Group, Development Studies Center, Institute of Developing Economies, JETRO. E-mail: [email protected]
** Professor, Gakushuin University. E-mail: [email protected]
*** Chief Senior Researcher, Inter-Disciplinary Studies Center, Institute of Developing Economies, JETRO. E-mail: [email protected]
IDE DISCUSSION PAPER No. 607
Should Energy Efficiency Be Traded Off for Other Product Attributes? An Analysis of Air-Conditioner Regulation in Japan
Kensuke KUBO*, Mariko WATANABE** and Michikazu KOJIMA***
June 2016
Abstract
This paper examines the functioning of energy efficiency standards and labeling policies for air conditioners in Japan. The results of our empirical analysis suggest that consumers respond more to label information, which benchmarks the energy efficiency performance of each product to a pre-specified target, than to direct performance measures. This finding provides justification for the setting, and regular updating, of target standards as well as their use in calculating relative performance measures.
We also find, through graphical analysis, that air conditioner manufacturers face a tradeoff between energy efficiency and product compactness when they develop their products. This tradeoff, combined with the semi-regular upward revision of minimum energy efficiency standards, has led to the growth in indoor unit size of air conditioners in
recent years. In the face of this phenomenon, regulatory rules were revised so that manufacturers could adhere to less stringent standards if the indoor unit size of their product remains below a certain size.
Our demand estimates provide no evidence that larger indoor unit size causes disutility to consumers. It is therefore possible that the regulatory change was not warranted from a consumer welfare point of view.
Keywords:
energy efficiency standard and labeling, promotion policiesJEL classification:
F15, O14, O30The Institute of Developing Economies (IDE) is a semigovernmental, nonpartisan, nonprofit research institute, founded in 1958. The Institute merged with the Japan External Trade Organization (JETRO) on July 1, 1998.
The Institute conducts basic and comprehensive studies on economic and related affairs in all developing countries and regions, including Asia, the Middle East, Africa, Latin America, Oceania, and Eastern Europe.
The views expressed in this publication are those of the author(s). Publication does not imply endorsement by the Institute of Developing Economies of any of the views expressed within.
INSTITUTE OF DEVELOPING ECONOMIES (IDE), JETRO 3-2-2, WAKABA,MIHAMA-KU,CHIBA-SHI
CHIBA 261-8545, JAPAN
©2016 by Institute of Developing Economies, JETRO
No part of this publication may be reproduced without the prior permission of the IDE-JETRO.
1
Should Energy Efficiency Be Traded Off for Other Product Attributes?
An Analysis of Air-Conditioner Regulation in Japan
Kensuke Kubo, Mariko Watanabe, and Michikazu Kojima
Abstract
This paper examines the functioning of energy efficiency standards and labeling policies for air conditioners in Japan. The results of our empirical analysis suggest that consumers respond more to label information, which benchmarks the energy efficiency performance of each product to a pre-specified target, than to direct performance measures. This finding provides justification for the setting, and regular updating, of target standards as well as their use in calculating relative performance measures.
We also find, through graphical analysis, that air conditioner manufacturers face a tradeoff between energy efficiency and product compactness when they develop their products. This tradeoff, combined with the semi-regular upward revision of minimum energy efficiency standards, has led to the growth in indoor unit size of air conditioners in recent years. In the face of this phenomenon, regulatory rules were revised so that manufacturers could adhere to less stringent standards if the indoor unit size of their product remains below a certain size.
Our demand estimates provide no evidence that larger indoor unit size causes disutility to consumers. It is therefore possible that the regulatory change was not warranted from a consumer welfare point of view.
1. Introduction
Since the 1970s, governments have actively employed energy efficiency standards to reduce energy consumption from several classes of consumer durables. The popularity of such policies has been based partly on their greater political feasibility, relative to energy taxes (Knittel, 2012). At the same time, energy efficiency standards have been criticized as being less cost-effective at reducing the energy consumption than taxes on energy or fuel, especially in the short run (Goldberg, 1998; Austin and Dinan, 2005; Klier and Linn, 2012). This is mainly because standards only affect product design by firms and not product usage by consumers.
2
In addition, energy efficiency standards tend to induce firms to distort their product design and pricing strategies, which generates additional inefficiencies. For instance, Klier and Linn (2012) demonstrate how, after the introduction of Corporate Average Fuel Economy (CAFE) standards, the horsepower and weight of new vehicles in the United States dropped dramatically as manufacturers sought to fulfill the standards by selling smaller, less powerful cars. Because consumers positively value power and weight in their automobiles, such changes in product design led to significant losses in consumer surplus.
One way to prevent such product design distortions is to set different standards for different product segments. For instance, the CAFE standards differentiate between cars and light trucks (including SUVs), and applies a far lower fuel efficiency standard to the latter group. In general, however, policymakers are likely to have difficulty in specifying in advance how products should be segmented for the purpose of standard setting. In addition, if the standards are regularly updated according to the average performance within a product group, segmentation into narrow product groups could undermine the ability of standards to promote energy efficiency for certain product segments. This effect is apparent in the US passenger vehicle market, where the segmentation into cars and light trucks has meant that light truck manufacturers continue to enjoy low fuel efficiency standards1.
To the extent that narrow segmentation could lead to weaker regulatory pressure for certain product segments, manufacturers may have an incentive to push for finer product segmentation in their discussions with regulators. Given that firms have more accurate information regarding the market demand for their products than government regulators, they are in a position to argue convincingly that products should be segmented on the basis of a certain product attribute (such as vehicle weight).
This can be achieved, for instance, by claiming that without segmentation, stringent energy efficiency standards would force firms to stop developing or reduce the output of products that possess some desirable attribute (such as vehicles with large passenger load). If the existence of such products is deemed to be of sufficient social value to warrant some sacrifice in energy efficiency, then a weaker energy efficiency standard may be set specifically for such products. It thus appears that this type of “regulatory capture” would be relatively easy to implement in industries characterized by a large degree of product differentiation.
In this paper, we examine the functioning of energy efficiency standards and
1 See Figure 2 in Knittel (2012). Note, however, that CAFE standards have tended to be stagnant even for the car segment.
3
labeling policies for room air conditioners (henceforth simply referred to as “air conditioners”) in Japan. Since its inception, the Japanese regulatory system has assigned different energy efficiency standards for different classes of air conditioners, as defined by cooling capacity. Since 1999, the government has employed the “Top Runner” method for setting standards, whereby the maximum energy efficiency level within a given product segment at a given point in time is employed as the future standard for that product segment, to be enforced several years later.
In addition to energy efficiency standards, Japanese regulators have imposed labeling requirements for air conditioners. Since 2000, manufacturers have been required to post a label showing the ratio (called the “achievement rate”) between the energy efficiency of their product and a target energy efficiency standard set by the regulator. In addition, retailers have been required since 2006 to post another label showing the energy efficiency “score” of each air conditioner – which is a translation of the achievement rate – as well as annual electricity costs under normal usage and typical electricity prices.
While there is general consensus that these standards and labeling policies have been effective at improving the energy efficiency of air conditioners, there has been a perception that firms, in their efforts to comply with stringent standards, have been forced into producing air conditioners with undesirable design traits – specifically, excessively large indoor units. Partly to address such concerns, beginning with the standards for air conditioners with 4 kilowatts of cooling capacity or less set in 2006, separate values have been provided for products with large indoor units and those with small indoor units. Since the small-indoor-unit segment has less stringent standards, manufacturers have focused their product development efforts and sales on that segment.
In this setting, our research questions are as follows. First, how effective have standards and labeling been for the promotion of energy efficiency of air conditioners in Japan? Second, did the design of energy efficiency regulations lead to a growth in the size of air conditioner indoor units? Third, have consumers been made worse off as a result of larger indoor units? Fourth, was the segmentation of air conditioners into groups defined by indoor unit size warranted?
The remainder of the paper is structured as follows. In Section 2, we describe the regulatory framework for air conditioners in Japan. In Section 3, we describe the evolution of energy efficiency and indoor unit size of air conditioners over time. We show graphically that standards have indeed been effective at improving energy efficiency. We also show that the same standards are likely to have been responsible
4 for the growth in indoor unit size.
In Section 4, we describe the demand model which is used to evaluate the effectiveness of standards and labeling policies. The model is also used for assessing the relevance of indoor unit size to consumers. Section 5 describes the data used for estimation, and Section 6 presents the results. Section 7 concludes by summarizing the results and stating the implications for future policy-making.
2. The Japanese Regulatory Framework for Air Conditioner Energy Efficiency
2.1. Efficiency Measures
The energy efficiency of air conditioners, as well as that of other electrical appliances, is regulated by the Agency for Natural Resources under the Ministry of Economy, Trade and Industry. There have historically been two measures of energy efficiency used for regulatory purposes. The first, called the Coefficient of Performance (COP), is the ratio between the cooling capacity of an air conditioner and its electricity consumption when the appliance is run under fixed conditions. This measure was used until the mid-to-late-2000s, when it was replaced by the Annual Performance Factor (APF), which is the ratio between the total cooling/heating capacity of an air conditioner during the entire year and its overall power consumption during the same period. APF is considered to be a more accurate measure of air conditioner efficiency because it is measured under typical running conditions and takes into account intra-seasonal temperature variability (CLASP et al., 2011).
2.2. Energy Efficiency Standards
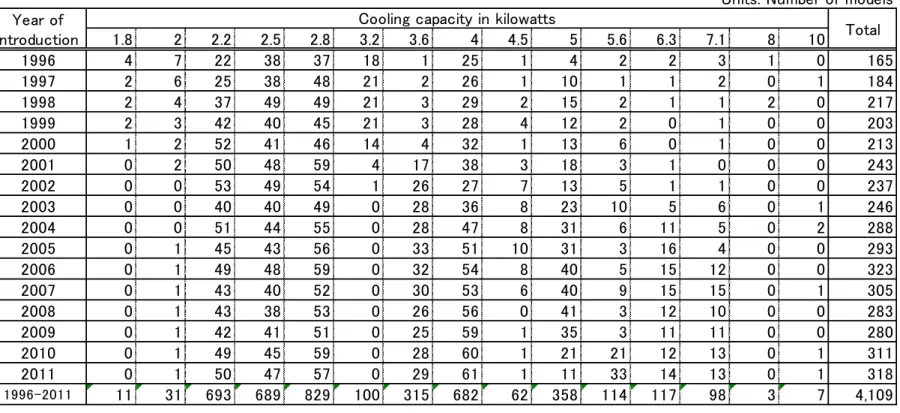
In the Japanese air conditioner market, products are clustered at distinct values of cooling capacity. This is seen in Table 1, which shows the number of new product introductions in each cooling capacity class.
Energy efficiency standards, which are separately set for each cooling capacity class, serve two purposes (Agency for Natural Resources and Energy, 2015). First, for a given cooling capacity class at a given point in time, the regulator specifies a “minimum standard” to be satisfied by each firm. Specifically, each manufacturer must ensure that the weighted harmonic mean of the energy efficiency measure (COP or APF) of its products in that class (using quantity sold as weights) is greater than or equal to the minimum standard currently in force. This is shown in Equation (1), where 𝛩̅𝑐 stands for the minimum standard of cooling capacity class c, 𝜃𝑗 is the efficiency measure of
5
product j, 𝑞𝑗 is the quantity of product j sold, and 𝐼𝑓𝑐 is the set of all products that firm f sells in class c.
(∑𝑗∈𝐼𝑓𝑐𝑞𝑗) [∑⁄ 𝑗∈𝐼𝑓𝑐(𝑞𝑗⁄ )𝜃𝑗 ]≥ 𝛩̅𝑐 (1)
Second, the regulator specifies, for each cooling capacity class in each point in time, a “target standard” which forms the basis for labeling information. Firms must calculate the relative energy efficiency performance of each of their products relative to the target standard, and print that information on the energy efficiency labels affixed to their products. Tables 2 and 3 provide an illustration of how this is done for air conditioners in the 2.8-kilowatt and 5-kilowatt cooling capacity classes.
While the minimum standards are meant to be applied at the corporate level (meaning that individual products need not satisfy the standard as long as the manufacturer’s product portfolio as a whole clears the standard), in practice, manufacturers generally design their products to satisfy the standard on an individual product basis, as illustrated in Figure 12..
As mentioned in the Introduction, the target standard for future years is set on the basis of current maximal efficiency levels, according to the Top Runner formula. To illustrate, the 2004 target standard for air conditioners with cooling capacity of 4 kilowatts or less came into effect in 2000 (see Table 2). Its value was fixed in 1998 on the basis of the maximum efficiency level among products in the same class during 1997-1998, and was used for calculating the relative performance values contained in energy efficiency labels as described in Section 2.3. The same value came to be used as the minimum standard in October 2003, replacing the previous minimum standard set in 1997. Meanwhile, a new target standard was decided on in mid-2006 on the basis of the maximum efficiency level in 2005. This new target standard was put in place in October 2006. Finally, this same value also became the minimum standard in April 2010, so that as of March 2016, the minimum standard and target standard are of the same value.
2.3. Labeling
There are three main types of energy efficiency labeling information for air conditioners in Japan. The first type is the ratio between the energy efficiency
2 This does not necessarily imply that the minimum standard is cleared by nearly all products sold by a manufacturer in a given year, since products launched in earlier years continue to be sold. The average vintage (years since launch) of an air
conditioner with positive sales during the 1996-2011 period covered by our data is 1.35 years.
6
measure of the product and the target standard for the product’s cooling capacity. This ratio is called the “achievement rate”. Hence, the achievement rate of a 2.8-kilowatt air conditioner measuring less than 800 millimeters in width and less than 295 milllimeters in height, with APF equal to 6.0, would have been 6.0 5.8⁄ = 103 percent in 2008 (see Table 2 for the applicable target standard). Achievement rates have been printed on labels, and made visible to consumers, from August 2000 onward. The energy efficiency measure used for assessing the achievement rate has shifted from COP to APF over the years. For air conditioners with cooling capacity of 4 kilowatts or less, the shift from COP to APF took place in 2006. For air conditioners with cooling capacity above 4 kilowatts, the change to APF happened in 2009.
The second type of labeling information is the relative energy efficiency performance of the product, expressed as a “score” between 1 and 5, which is calculated from the achievement rate usimg pre-specified threshold levels. According to Table 2, the air conditioner described in the previous paragraph would have been labeled with a score of 5 in 2008, since its achievement rate of 103 percent surpassed the score-5 threshold level for that year. Score information has been labeled, and made visible to consumers, since October 2006. As can be seen from Table 2, the threshold levels for scoring have been revised at two or three-year intervals.
The third type of labeling information is the annual electricity cost under typical usage patterns. This is calculated by multiplying the annual power consumption of the product under typical usage (i.e., the denominator of APF) by the national-average tariff rate for electricity. Annual electricity cost information has been printed on labels since October 2006.
3. Evolution of Energy Efficiency and Product Characteristics Over Time
This section describes how the energy efficiency of air conditioners has evolved in recent years, and relates this evolution to how the standards and labeling regulations have changed over time. We also describe how the size of the indoor unit, keeping cooling capacity constant, has grown in pace with the rise in energy efficiency. We explain how these two developments may be closely related.
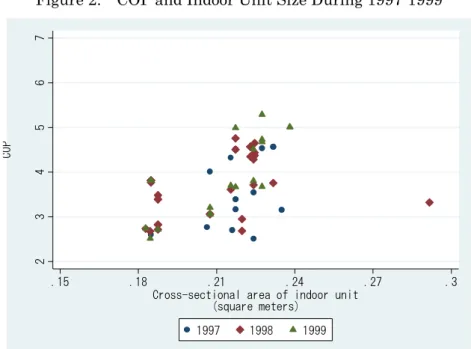
Figures 2 to 6 show how the energy efficiency, as measured by COP, and the size of indoor units, as measured by cross-sectional area (width times height), of newly launched 2.5-kilowatt air conditioners have evolved during 1997-2011. Until 1998, the size of indoor units was mostly concentrated in a relatively narrow range between 0.18 m2 and 0.24 m2, and there was no discernible relationship between COP and indoor unit
7
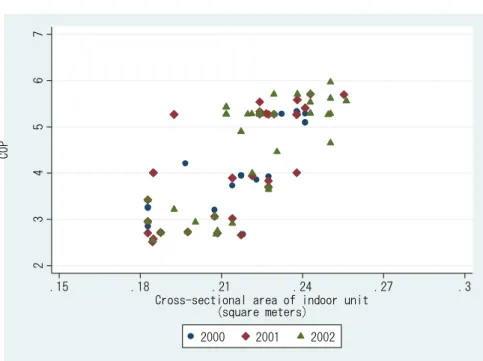
size. This began to change in 1999 when a positive relationship between COP and indoor unit size appeared, and this relationship continued to strengthen up to 2002.
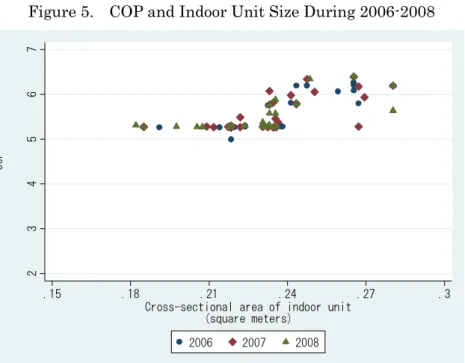
In 2003, there was a sudden shift in energy efficiency as 83 percent of the new models came to have COP above 5.27, which was the minimum standard for 2.5-kilowatt air conditioners from October 2003 to March 20103. Between 2004 and 2007, there were very few models with COP below the minimum standard, while many models attained COP values above 6.25. The indoor unit size of the most energy-efficient air conditioners continued to grow, and by 2007, the largest indoor units had cross-sectional areas of around 0.28 m2, which was around 17 percent greater than the largest indoor units in 2000.
The positive relationship between energy efficiency and indoor unit size suggests that manufacturers sought to improve energy efficiency by increasing the size of the indoor unit. In fact, a 2009 report of the government working group that sets the energy efficiency standards of air conditioners stated that “the main method of improving the energy efficiency of air conditioners is to increase the size of the heat exchangers” contained in both the indoor and outdoor units (Working Group on Classification Standards for Air Conditioners, 2009).
To the extent that consumers value the compactness of indoor units, this suggests a tradeoff between two desirable traits for air conditioners: energy efficiency and compactness. This is analogous to the observed tradeoff between fuel efficiency on the one hand and horsepower and vehicle weight on the other for automobiles (Knittel, 2011; Klier and Linn, 2012). Just as automobile manufacturers in the 1970s and 1980s sacrificed horsepower and weight for fuel efficiency, Japanese air conditions during the 2000s sacrificed product compactness in their pursuit of energy efficiency.
Interestingly, the movement towards larger, more efficient air conditioners slowed down rather abruptly after 2007. As seen in Figure 6, the indoor unit size of new models came to be concentrated at or below 0.24 m2. At the same time, fewer new models came to have COP levels above 6, and by 2011, several new models had COP levels below 5.27.
The reason for these sudden changes can be traced to two important regulatory changes that took place between 2006 and 2010. First, it was decided that the COP measure would be replaced by the APF measure starting with target standards that were set in 2006, and that became effective the same year, for air conditioners with
3 By contrast, the proportion of new models with COP above 5.27 in 2002 was 59 percent.
8
cooling capacity of 4 kilowatts or less4. This was based on the idea that APF is a more accurate measure of actual energy efficiency than COP, as the former is based on more realistic usage patterns. Since the relationship between COP and APF is non-monotonic, models that have a high APF may not necessarily have a high COP, which explains why the COP of new models decreased in 2011 as seen in Figure 6.
The second regulatory change was the regulator’s decision in 2006 that air conditioners with cooling capacity of 4 kilowatts or less would be given separate energy efficiency standards according to the size of indoor unit. Target standards that would come into force in October 2006, as well as minimum standards that would enter into force in April 2010 (which would equal the October 2006 target standards), were to be set at a lower level for air conditioners with smaller indoor units of up to 800 millimeters in width and up to 295 millimeters in height5. Products adhering to these size restrictions are called “prescribed-size” products, while air conditioners with larger indoor units (with width greater than 800 millimeters or height greater than 295 millimeters) are called “free-size” products. This segmentation and the corresponding change in efficiency standards can be seen in Table 2.
The decision to create separate product segments based on the size of indoor unit was motivated by the perception, among policymakers and industry, that air conditioners were becoming excessively large, as manufacturers installed increasingly large heat exchangers in their products in the pursuit of energy efficiency. This thinking is apparent in the aforementioned 2009 report, which states that “the continued growth in indoor unit size would make air conditioners unsuitable for installation in homes”, because the typical Japanese dwelling has limited space for installing indoor air conditioner units (Working Group on Classification Standards for Air Conditioners, 2009).
Nevertheless, there appears to have been little serious consideration of whether or not the more energy-efficient air conditioners were in fact becoming excessively large for consumers. After all, air conditioners that are “unsuitable for installation in homes”
would find themselves without a market, so that manufacturers would have no incentive to develop them. Given that firms were enthusiastically developing larger-sized indoor units, it is natural to think that there was a market for such products.
Whatever the merits of the policy change, it had a clear impact on indoor unit size.
4 For air conditioners with cooling capacity above 4 kilowatts, the new APF-based target standards were set in 2009 and put into force the same year.
5 Till date, no such segmentation based on indoor unit size has been done for air conditioners with cooling capacity above 4 kilowatts.
9
As can be seen from Figure 7, the indoor unit size of 2.5-kilowatt air conditioners increased from around 2001 to 2006. However, it stagnated thereafter and a majority of newer units since 2009 have been in the prescribed-size segment. Even though manufacturers continue to be able to offer products with larger indoor units, they have largely refrained from doing so. Since the prescribed-size segment has a lower minimum standard for energy efficiency, it is likely that the tendency of firms to focus on that segment has slowed or even reversed the energy efficiency improvement of air conditioners with cooling capacity of 4 kilowatts and below.
4. Empirical Model of Demand for Air Conditioners
4.1. Motivation for Demand Estimation
The purpose of demand estimation is two-fold: to examine how consumers respond to the energy efficiency attributes of air conditioners, and to learn whether large indoor unit size causes disutility to consumers.
With regard to energy efficiency, we are most interested in seeing whether consumers respond directly to energy efficiency measures such as COP and APF, or whether they respond more to the information contained in labels, which are summaries of relative energy efficiency based on COP/APF.
Several aspects of our policy environment allow us to distinguish between the two possibilities. First, because achievement rate labels were introduced in 2000 and score labels (which also contain electricity cost information) were introduced in 2006, by seeing if consumers were more responsive to energy efficiency measures after these labels were introduced, it is possible to infer whether or not the labels were effective at influencing consumer behavior. In addition, the change in the efficiency measure used for calculating achievement rates that took place between 2006 and 2009, from COP to APF, allows us to infer consumers’ reliance on labels; if they are indeed reliant on the labeled information, consumers are expected to have become more responsive to APF, relative to COP, once the former became the basis of calculation.
With regard to indoor unit size, our aim is to evaluate the preconception that large indoor unit size causes disutility to consumers, which was the motivation for introducing size-based product segmentation in 2006. If we find that consumers have a preference for smaller indoor unit size, we can conclude that there is some justification for segmenting by size. On the other hand, if we find that consumers are indifferent to indoor unit size, or that they tend to have a preference for larger indoor
10
units, then it raises doubts about the justifiability of sized-based segmentation and the resulting reduction in energy efficiency standards for the prescribed-size segment.
4.2. Logit Demand Model
We employ a simple logit demand model based on Berry (1994) and estimate it separately for each cooling capacity class. We start with the indirect utility of individual i from purchasing product j (= 1, 2, … , 𝐽) in year t:
𝑢𝑖𝑗𝑡= 𝑥𝑗𝑡𝛽 − 𝛼𝑝𝑗𝑡+ 𝜉𝑗𝑡+ 𝜐𝑖𝑗𝑡
= 𝛿𝑗𝑡+ 𝜐𝑖𝑗𝑡
where 𝑥𝑗𝑡 is a vector containing product characteristics, 𝑝𝑗𝑡 is the product price, 𝜉𝑗𝑡 contains the effect of unobserved product characteristics, and 𝜐𝑖𝑗𝑡 is an error term that varies over individuals and products. 𝛿𝑗𝑡≡ 𝑥𝑗𝑡𝛽 − 𝛼𝑝𝑗𝑡+ 𝜉𝑗𝑡 is defined as the mean utility of product j that is common to all individuals. 𝛽 and 𝛼 are parameters to be estimated.
We derive market shares from the indirect utility expression given above.
Assuming that the J-dimensional vector 𝜐 is distributed independently and identically across individuals with distribution function F(υ), the market share of product j is given as
𝑠𝑗 = ∫ 𝟏(𝛿𝑗+ 𝜐𝑗 ≥ 𝛿𝑘+ 𝜐𝑘, ∀𝑘 ∈ ℑ ) 𝑑𝐹(𝝊)
where1(∙) is the indicator function and ℑ is the set of all products (the time subscript has been suppressed for simplicity). If we assume that the elements of υ are independent each having the standard Gumbel distribution, the market share can be rewritten as follows:
𝑠𝑗 = 𝑒𝑥𝑝 (𝛿𝑗)
∑𝑘∈ℑ𝑒𝑥𝑝 (𝛿𝑘)
Normalizing the utility from the outside good (indexed by 0) to zero, we can rewrite the market shares as
𝑠𝑗 = 𝑒𝑥𝑝 (𝛿𝑗) 1 + ∑𝑘∈ℑ−0𝑒𝑥𝑝 (𝛿𝑘)
𝑠0= 1
1 + ∑𝑘∈ℑ−0𝑒𝑥𝑝 (𝛿𝑘)
where ℑ−0 is the set of all products excluding the outside good. Taking the logarithm of both expressions and subtracting gives
𝑙𝑛 𝑠𝑗− 𝑙𝑛 𝑠0= 𝛿𝑗 = 𝑥𝑗𝑡𝛽 − 𝛼𝑝𝑗𝑡+ 𝜉𝑗𝑡 (2)
Equation (2) is the conventional logit estimating equation for market share data.
11
Following Klier and Linn (2012), we transform the left-hand side as follows:
𝑙𝑛 𝑠𝑗− 𝑙𝑛 𝑠0=𝑙𝑛 𝑠𝑗
𝑙𝑛 𝑠0=𝑙𝑛 𝑞𝑗
𝑙𝑛 𝑞0= 𝑙𝑛 𝑞𝑗− 𝑙𝑛 𝑞0
where 𝑞𝑗 is the quantity sold of product j and 𝑞0 is that of the outside good. The estimating equation then becomes
𝑙𝑛 𝑞𝑗= 𝑥𝑗𝑡𝛽 − 𝛼𝑝𝑗𝑡+ 𝑙𝑛 𝑞0+ 𝜉𝑗𝑡 (3)
In practice, because we employ year fixed effects and the quantity of the outside good varies only across years, 𝑞0 drops out of the estimating equation. Since price is endogenous, we estimate equation (3) by linear instrumental variables regression.
4.3. Explanatory Variables
We use the annual average price (total revenue divided by total quantity sold) of each product for 𝑝𝑗𝑡 and deflate it using the consumer price index. The variables contained in 𝑥𝑗𝑡 are the following:
Product attributes other than energy efficiency
Number of years since product launch; cross-sectional area of indoor unit (width times height); depth of indoor unit; weight-to-volume ratio of indoor unit; volume of outside unit; indicator for cooling-heating machine6.
Energy efficiency
COP; APF; achievement rate, defined as the ratio between the product’s energy efficiency measure (COP or APF, depending on the measure used for the target standard) and the target standard; efficiency score (calculated from the achievement rate and the year-specific threshold for each score).
In addition, we use year fixed effects and firm fixed effects. Since price is an endogenous variable, we use the following instrumental variables: weight of outdoor unit and quantity of refrigerant used in the air conditioner.
5. Data description
We obtained monthly product-level sales revenue and quantity data for the entire Japanese room air conditioner market from GfK. Since the sale of air conditioners
6 While the majority of air conditioners sold in Japan have both cooling and heating functions, around 3 percent of the products in our dataset are cooling-only machines.
12
exhibits strong seasonality, we aggregated up to the annual level.
While the GfK database contains some data on product attributes and energy efficiency, they are incomplete. In particular, it does not contain any data on indoor and outdoor unit size. We therefore obtained additional product attribute data from manufacturers’ product catalogs and websites.
We also obtained detailed energy efficiency data from the “Energy Efficiency Catalogs” published by the Agency for Natural Resources and Energy and the Energy Conservation Center Japan (ECCJ).
6. Estimation Results
A key consideration when we estimate equation (3) is how to include measures of energy efficiency performance. Broadly speaking, we have three such measures: (1) a direct measure of the product’s energy efficiency performance (COP or APF); (2) a continuous measure of the product’s performance relative to a target standard that varies infrequently over time (achievement rate); and (3) a discrete measure of the product’s performance relative to a target standard that varies somewhat frequently over time (score).
While it would be beneficial to be able to compare the effectiveness of each measure through a single regression, the inclusion of multiple measures in the same estimating equation is likely to lead to inaccurate estimates arising from severe collinearity problems7. We therefore estimate equation (3) separately for each performance measure.
Intuitively, the direct performance measure is the most accurate as it is an absolute measure. However, it may not be informative to consumers if they do not have a reference by which they can evaluate the specific value for each product. The other two measures provide such a reference by benchmarking the performance of each product to a target standard. They differ, however, in how accurately they convey the relative performance of the product. In particular, the achievement rate has the shortcoming that the target standard is very rarely updated. Achievement rates based on an outdated target standard are uninformative, as most products would be expected to
7 Houde’s (2014) study of the refrigerator market allows consumers to be of different types – some are responsive to the direct performance measure while others are only responsive to label information – and estimates a latent-class discrete choice model of demand. Our approach differs in that we obtain separate estimates for each
performance measure and gain insight by comparing results across the different specifications.
13
have a value significantly greater than 100 percent. By comparison, the 5-point scoring system is more informative as the threshold values for each score is updated more frequently.
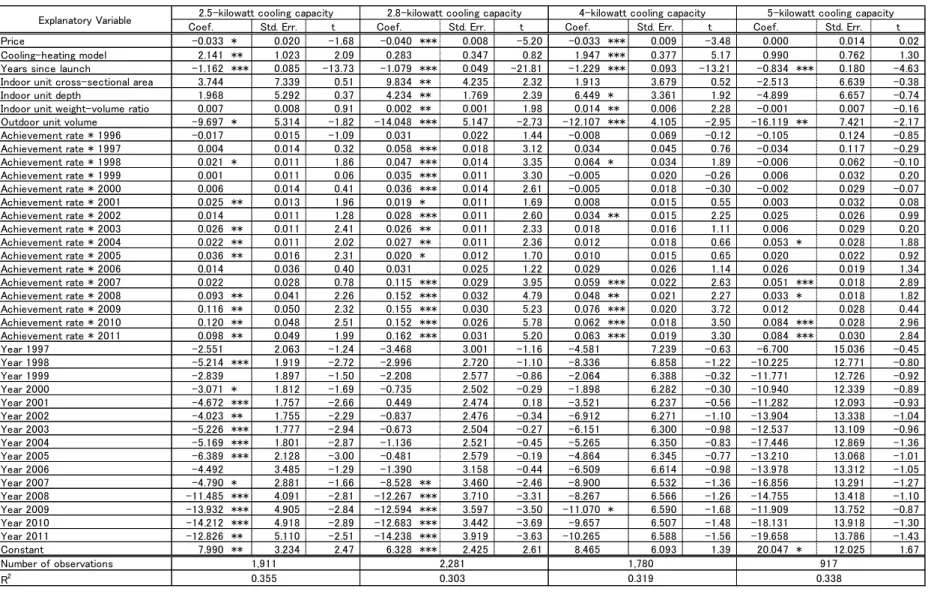
6.1. Performance Measure: Achievement Rate
Tables 4 to 6 provide the results of demand equation (3) being estimated separately for four representative cooling capacity classes: 2.5-kilowatt, 2.8-kilowatt, 4-kilowatt, and 5-kilowatt. In Table 4, we use the achievement rate to represent the level of energy efficiency.
We find that the achievement rate has a significantly positive effect on utility in most years for the 2.8-kilowatt class. In addition, its effect tends to be significantly positive for the years 2007 to 2011 for the other cooling capacity classes as well.
What is remarkable is how the magnitude of the coefficient on achievement rate varies over years. In particular, for cooling capacities of 4 kilowatts or less, the coefficient on achievement rate remains relatively low for the years up to 2006 and becomes significantly higher for the years 2007 to 2011. For the 5-kilowatt cooling capacity, the achievement rate coefficient is greater during the years 2010-2011.
There are two possible explanations for this finding. The first explanation is that the effectiveness of the achievement rate as a performance measure depends on how recently the target standard was revised. For cooling capacity classes of up to 4 kilowatts, the target standard was outdated prior to October 2006 (see Table 2). A similar situation existed for cooling capacity classes above 4 kilowatts until mid-2009 (see Table 3). It is possible that with the revision of the target standard, the achievement rate suddenly became more informative, and consumers responded to it.
The second explanation is that the addition of 5-point scores and electricity cost information to energy efficiency labels, which occurred in October 2006, made them more informative, and consumers responded to the additional information.
An interesting question is whether consumers responded more to the scores or to the electricity cost information. While a definitive answer may be difficult to obtain, we think it more likely that consumers responded to scores. This is because while electricity cost information has been available for all cooling capacity classes since 2006, informative scores became available at different times for different cooling capacity classes. Due to the delay in revising the target standard, achievement rates (and hence 5-point scores) did not become informative for cooling capacity classes above 4 kilowatts until mid-2009. Thus, our observation that the relationship between achievement rates and consumer utility became stronger in 2010-2011 for the
14
5-kilowatt cooling capacity class is consistent with the notion that consumer respond more strongly to scores than to electricity cost information.
Turning to the other explanatory variables, the coefficient on price is negative as expected. The number of years since product launch is negative, implying that older products are valued less by consumers (or promoted less by manufacturers and retailers). The cross-sectional area of indoor unit has a significantly positive coefficient for the 2.8-kilowatt class while it is not significant for the other classes.
This implies that large indoor unit size does not cause disutility to consumers. The coefficient for indoor unit depth is also significantly positive for the 2.8-kilowatt and 4-kilowatt classes, which also suggests that consumers are not averse to large indoor units.
The indoor unit weight-to-volume ratio variable has a significantly positive coefficient in the 2.8-kilowatt and 4-kilowatt classes. This is likely caused by weight being correlated with the existence of extra features – such as dehumidification and automatic cleaning – that are valued by consumers. To the extent that these features require extra parts and add weight to the indoor unit, and because our data does not contain information on their existence, our weight-to-volume variable is likely to pick up their impact on consumer utility.
The outdoor unit volume variable has a significantly negative coefficient in all four cooling capacity classes, which implies that large outdoor units cause disutility to consumers.
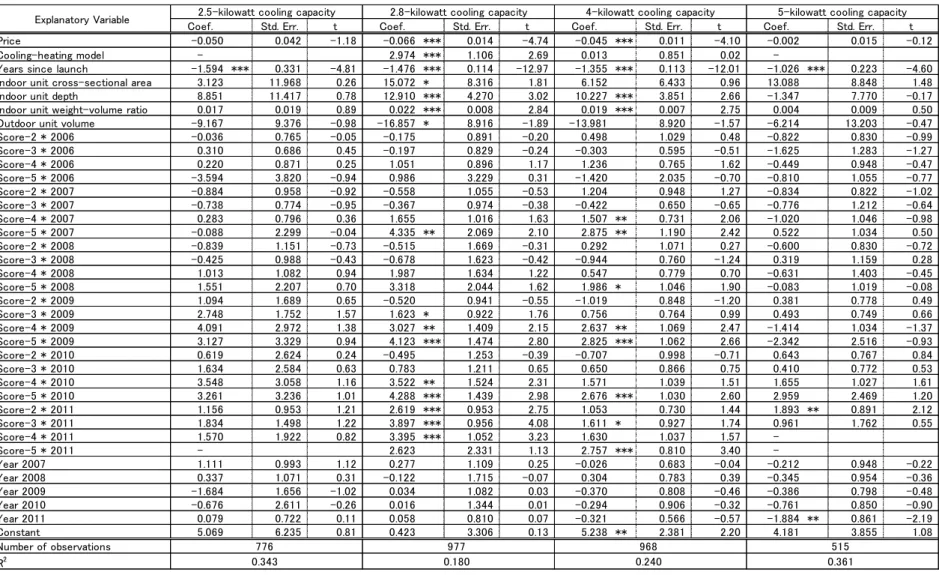
6.2. Performance Measure: Scores
Table 5 presents the demand estimation results when we use 5-point scores to represent the energy efficiency of products. Since score labels have existed only since 2006, we use data for the years 2006-2011.
We find that the score variables tend to be significant, especially in the later years, for the 2.8-kilowatt and 4-kilowatt segments, although they tend not to be significant for the other segments. These patterns suggest that consumers were initially not so responsive to scores but gradually became more responsive. The larger scores tend to have higher coefficients, as one would expect.
Turning to the other variables, price has negative coefficient, although it is significant only for the 2.8-kilowatt and 4-kilowatt classes. Years since launch has a significantly negative coefficient, as expected. We find again that the coefficient on the cross-sectional size of the indoor unit is significantly positive for the 2.8-kilowatt segment, and not significant for the other segments.
15 6.3. Performance Measure: COP/APF
Table 6 provides the estimates of equation (3) when we simply used the COP and APF values to represent energy efficiency levels. Since none of the coefficients were significant for the 5-kilowatt class, we present results only for the 2.5-kilowatt, 2.8-kilowatt, and 4-kilowatt classes.
An interesting feature of the results in Table 6 is that the COP variables have a significantly positive coefficient in a relatively small number of years (all in the early to mid-2000s), while they tend to have a significantly negative coefficient in the later years.
Meanwhile, the APF variables have a significantly positive coefficient in the same years for which the coefficients on the COP variables are significantly negative, namely 2008-2011 for the 2.5-kilowatt segment, 2007-2011 for the 2.8-kilowatt segment, and 2009-2010 for the 4-kilowatt segment. These years coincide with the period when APF replaced COP as the basis for calculating the achievement rate and 5-point scores.
Thus, as discussed in Section 4.1, these results are consistent with the notion that consumer are more reliant on label information than on direct measures of energy efficiency.
We find that the coefficient on cross-sectional area of the indoor unit is not significant for any of the cooling capacity classes.
6.4. Summary of Results
To summarize the results, our first major finding is that consumers appear to respond more strongly to labels than to direct measures of energy efficiency. This implies the effectiveness of standards and labeling policy. It also highlights the importance of how segments are defined for the purpose of setting target standards.
Our second major finding is that large indoor unit size does not cause disutility to consumers. This implies that the additional segmentation of air conditioners with cooling capacity of 4 kilowatts or below was not necessarily warranted from a consumer welfare point of view.
7. Conclusion
This paper examined the functioning of energy efficiency standards and labeling policies for air conditioners in Japan. The results of our empirical analysis suggest that consumers respond more to label information, which benchmarks the energy
16
efficiency performance of each product to a pre-specified target, than to direct performance measures. This finding provides justification for the setting, and regular updating, of target standards as well as their use in calculating relative performance measures.
We also found, through graphical analysis, that air conditioner manufacturers face a tradeoff between energy efficiency and product compactness when they develop their products. This tradeoff, combined with the semi-regular upward revision of minimum energy efficiency standards, has led to the growth in indoor unit size of air conditioners in recent years. In the face of this phenomenon, regulatory rules were revised so that manufacturers could adhere to less stringent standards if the indoor unit size of their product remains below a certain size.
Our demand estimates provided no evidence that larger indoor unit size causes disutility to consumers. It is therefore possible that the regulatory change was not warranted from a consumer welfare point of view.
17 References
Agency for Natural Resources and Energy. (2015) Top Runner Program: Developing the World’s Best Energy-Efficient Appliance and More. March 2015 Edition (http://www.enecho.meti.go.jp/category/saving_and_new/saving/data/toprunner2015e .pdf).
Austin, David and Terry Dinan. (2005) “Clearing the Air: The Costs and Consequences of Higher CAFE Standards and Increased Gasoline Taxes.” Journal of Environmental Economics and Management, 50, pp.562-582.
Berry, Steven T. “Discrete Choice Models of Product Differentiation.” RAND Journal of Economics, 25, pp.242-262.
CLASP, Econoler, Navigant, CEIS, and ACEEE. (2011) Cooling Benchmarking Study Report.
(http://clasp.ngo/Resources/Resources/PublicationLibrary/2012/Cooling-Benchmarki ng-Study)
Goldberg, Pinelopi K. (1998) “The Effects of the Corporate Average Fuel Efficiency Standards in the US.” Journal of Industrial Economics, 46, pp.1-33.
Houde, Sebastien. (2014) “How Consumers Respond to Environmental Certification and the Value of Energy Information.” NBER Working Paper 20019.
Klier, Thomas and Joshua Linn. (2012) “New-Vehicle Characteristics and the Cost of the Corporate Average Fuel Economy Standard.” RAND Journal of Economics, 43, pp.186-213.
Knittel, Christopher R. (2011) “Automobiles on Steroids: Product Attribute Trade-Offs and Technological Progress in the Automobile Sector.” American Economic Review, 101, pp.3368-3399.
Knittel, Christopher R. (2012) “” Journal of Economic Perspectives 26, pp.93-118.
Working Group on Classification Standards for Air Conditioners. (2009) Final Report.
Agency for Natural Resources and Energy, Energy Efficiency and Conservation Subcommittee (In Japanese) (https://www.eccj.or.jp/toprunner/aircon/090424.pdf).
18
Figure 1. COP of 2.8-kilowatt Air Conditioners
Notes: (1) Each dot represents a new model launched in that year.
(2) See Table 2 for the minimum standard in force in each year.
(3) Data source: GfK, Japan Air Conditioner Point-of-Sales Data; Agency for Natural Resources and Energy and Energy Conservation Center Japan, Energy Efficiency Catalog;
Manufacturer product catalogs and websites.
234567
COP
1996 1997 1998 1999 2000 2001 2002 2003 2004 2005 2006 2007 2008 2009 2010 2011
Year
19
Figure 2. COP and Indoor Unit Size During 1997-1999
Notes: (1) Each dot represents a new model launched in that year.
(2) Data source: GfK, Japan Air Conditioner Point-of-Sales Data; Agency for Natural Resources and Energy and Energy Conservation Center Japan, Energy Efficiency Catalog;
Manufacturer product catalogs and websites.
234567
COP
.15 .18 .21 .24 .27 .3
Cross-sectional area of indoor unit (square meters)
1997 1998 1999
20
Figure 3. COP and Indoor Unit Size During 2000-2002
Notes: See notes for Figure 2.
Figure 4. COP and Indoor Unit Size During 2003-2005
Notes: See notes for Figure 2.
234567
COP
.15 .18 .21 .24 .27 .3
Cross-sectional area of indoor unit (square meters)
2000 2001 2002
234567
COP
.15 .18 .21 .24 .27 .3
Cross-sectional area of indoor unit (square meters)
2003 2004 2005
21
Figure 5. COP and Indoor Unit Size During 2006-2008
Notes: See notes for Figure 2.
Figure 6. COP and Indoor Unit Size During 2009-2011
Notes: See notes for Figure 2.
234567
COP
.15 .18 .21 .24 .27 .3
Cross-sectional area of indoor unit (square meters)
2006 2007 2008
234567
COP
.15 .18 .21 .24 .27 .3
Cross-sectional area of indoor unit (square meters)
2009 2010 2011
22
Figure 7. Indoor Unit Size of 2.5-kilowatt Air Conditioners
Notes: (1) Each dot represents a new model launched in that year.
(2) Data source: GfK, Japan Air Conditioner Point-of-Sales Data; Agency for Natural Resources and Energy and Energy Conservation Center Japan, Energy Efficiency Catalog;
Manufacturer product catalogs and websites.
.15 .2.25 .3
Cross-sectional area of indoor unit (square meters) 1996 1997 1998 1999 2000 2001 2002 2003 2004 2005 2006 2007 2008 2009 2010 2011
Year
23
1.8 2 2.2 2.5 2.8 3.2 3.6 4 4.5 5 5.6 6.3 7.1 8 10
1996 4 7 22 38 37 18 1 25 1 4 2 2 3 1 0 165
1997 2 6 25 38 48 21 2 26 1 10 1 1 2 0 1 184
1998 2 4 37 49 49 21 3 29 2 15 2 1 1 2 0 217
1999 2 3 42 40 45 21 3 28 4 12 2 0 1 0 0 203
2000 1 2 52 41 46 14 4 32 1 13 6 0 1 0 0 213
2001 0 2 50 48 59 4 17 38 3 18 3 1 0 0 0 243
2002 0 0 53 49 54 1 26 27 7 13 5 1 1 0 0 237
2003 0 0 40 40 49 0 28 36 8 23 10 5 6 0 1 246
2004 0 0 51 44 55 0 28 47 8 31 6 11 5 0 2 288
2005 0 1 45 43 56 0 33 51 10 31 3 16 4 0 0 293
2006 0 1 49 48 59 0 32 54 8 40 5 15 12 0 0 323
2007 0 1 43 40 52 0 30 53 6 40 9 15 15 0 1 305
2008 0 1 43 38 53 0 26 56 0 41 3 12 10 0 0 283
2009 0 1 42 41 51 0 25 59 1 35 3 11 11 0 0 280
2010 0 1 49 45 59 0 28 60 1 21 21 12 13 0 1 311
2011 0 1 50 47 57 0 29 61 1 11 33 14 13 0 1 318
1996-2011 11 31 693 689 829 100 315 682 62 358 114 117 98 3 7 4,109
Source: GfK, Japan Air Conditioner Point-of-Sales Data.
Total Cooling capacity in kilowatts
Table 1. Number of New Model Introductions by Cooling Capacity
Year of introduction
Units: Number of models
24 Base year
Energy efficiency
measure
Value for prescribed- size models
Value for free-size models
Base year
Energy efficiency
measure
Value for prescribed- size models
Value for free-size models
Score-5 Score-4 Score-3 Score-2
1996 1983 COP 1998 COP
1997 1983 COP 1998 COP
1998 1998 COP 1998 COP
1999 1998 COP 1998 COP
2000 1998 COP 2004 COP
2001 1998 COP 2004 COP
2002 1998 COP 2004 COP
2003 1998 COP 2004 COP
2004 2004 COP 2004 COP
2005 2004 COP 2004 COP
2006 2004 COP 2010 APF 5.8 6.6 100 92 84 76
2007 2004 COP 2010 APF 5.8 6.6 100 92 84 76
2008 2004 COP 2010 APF 5.8 6.6 100 92 84 76
2009 2004 COP 2010 APF 5.8 6.6 109 100 90 80
2010 2010 APF 5.8 6.6 2010 APF 5.8 6.6 109 100 90 80
2011 2010 APF 5.8 6.6 2010 APF 5.8 6.6 121 114 107 100
Source:
2.97 4.9
Agency for Natural Resources and Energy and Energy Conservation Center Japan, Energy Efficiency Catalog, various issues..
4.9 4.9 4.9 4.9 4.9 2.97
2.92
2.92 2.97
2.97 2.97
Table 2. Energy Efficiency Standards for 2.8-kilowatt Cooling Capacity Room Air Conditioners
4.9 4.9 4.9 4.9 4.9 4.9 2.97 2.97 2.97
Score thresholds for achievement rate (%) Year
Minimum standard Target standard
2.97 2.97
25
Score thresholds for achievement rate (%) Base year
Energy efficiency
measure
Value Base year
Energy efficiency
measure
Value Score-5 Score-4 Score-3 Score-2
1996 1983 COP 2.19 1998 COP 2.5
1997 1983 COP 2.19 1998 COP 2.5
1998 1998 COP 2.5 1998 COP 2.5
1999 1998 COP 2.5 1998 COP 2.5
2000 1998 COP 2.5 2007 COP 3.17
2001 1998 COP 2.5 2007 COP 3.17
2002 1998 COP 2.5 2007 COP 3.17
2003 1998 COP 2.5 2007 COP 3.17
2004 1998 COP 2.5 2007 COP 3.17
2005 1998 COP 2.5 2007 COP 3.17
2006 1998 COP 2.5 2007 COP 3.17 130 120 110 100
2007 2007 COP 3.17 2007 COP 3.17 130 120 110 100
2008 2007 COP 3.17 2007 COP 3.17 130 120 110 100
2009 2007 COP 3.17 2010 APF 5.5 109 100 90 80
2010 2010 APF 5.5 2010 APF 5.5 109 100 90 80
2011 2010 APF 5.5 2010 APF 5.5 121 114 107 100
Source: Agency for Natural Resources and Energy and Energy Conservation Center Japan, Energy Efficiency Catalog, various issues..
Target standard Minimum standard
Table 3. Energy Efficiency Standards for 5-kilowatt Cooling Capacity Room Air Conditioners
Year
26
Coef. Std. Err. t Coef. Std. Err. t Coef. Std. Err. t Coef. Std. Err. t
Price -0.033 * 0.020 -1.68 -0.040 *** 0.008 -5.20 -0.033 *** 0.009 -3.48 0.000 0.014 0.02
Cooling-heating model 2.141 ** 1.023 2.09 0.283 0.347 0.82 1.947 *** 0.377 5.17 0.990 0.762 1.30
Years since launch -1.162 *** 0.085 -13.73 -1.079 *** 0.049 -21.81 -1.229 *** 0.093 -13.21 -0.834 *** 0.180 -4.63
Indoor unit cross-sectional area 3.744 7.339 0.51 9.834 ** 4.235 2.32 1.913 3.679 0.52 -2.513 6.639 -0.38
Indoor unit depth 1.968 5.292 0.37 4.234 ** 1.769 2.39 6.449 * 3.361 1.92 -4.899 6.657 -0.74
Indoor unit weight-volume ratio 0.007 0.008 0.91 0.002 ** 0.001 1.98 0.014 ** 0.006 2.28 -0.001 0.007 -0.16
Outdoor unit volume -9.697 * 5.314 -1.82 -14.048 *** 5.147 -2.73 -12.107 *** 4.105 -2.95 -16.119 ** 7.421 -2.17
Achievement rate * 1996 -0.017 0.015 -1.09 0.031 0.022 1.44 -0.008 0.069 -0.12 -0.105 0.124 -0.85
Achievement rate * 1997 0.004 0.014 0.32 0.058 *** 0.018 3.12 0.034 0.045 0.76 -0.034 0.117 -0.29
Achievement rate * 1998 0.021 * 0.011 1.86 0.047 *** 0.014 3.35 0.064 * 0.034 1.89 -0.006 0.062 -0.10
Achievement rate * 1999 0.001 0.011 0.06 0.035 *** 0.011 3.30 -0.005 0.020 -0.26 0.006 0.032 0.20
Achievement rate * 2000 0.006 0.014 0.41 0.036 *** 0.014 2.61 -0.005 0.018 -0.30 -0.002 0.029 -0.07
Achievement rate * 2001 0.025 ** 0.013 1.96 0.019 * 0.011 1.69 0.008 0.015 0.55 0.003 0.032 0.08
Achievement rate * 2002 0.014 0.011 1.28 0.028 *** 0.011 2.60 0.034 ** 0.015 2.25 0.025 0.026 0.99
Achievement rate * 2003 0.026 ** 0.011 2.41 0.026 ** 0.011 2.33 0.018 0.016 1.11 0.006 0.029 0.20
Achievement rate * 2004 0.022 ** 0.011 2.02 0.027 ** 0.011 2.36 0.012 0.018 0.66 0.053 * 0.028 1.88
Achievement rate * 2005 0.036 ** 0.016 2.31 0.020 * 0.012 1.70 0.010 0.015 0.65 0.020 0.022 0.92
Achievement rate * 2006 0.014 0.036 0.40 0.031 0.025 1.22 0.029 0.026 1.14 0.026 0.019 1.34
Achievement rate * 2007 0.022 0.028 0.78 0.115 *** 0.029 3.95 0.059 *** 0.022 2.63 0.051 *** 0.018 2.89
Achievement rate * 2008 0.093 ** 0.041 2.26 0.152 *** 0.032 4.79 0.048 ** 0.021 2.27 0.033 * 0.018 1.82
Achievement rate * 2009 0.116 ** 0.050 2.32 0.155 *** 0.030 5.23 0.076 *** 0.020 3.72 0.012 0.028 0.44
Achievement rate * 2010 0.120 ** 0.048 2.51 0.152 *** 0.026 5.78 0.062 *** 0.018 3.50 0.084 *** 0.028 2.96
Achievement rate * 2011 0.098 ** 0.049 1.99 0.162 *** 0.031 5.20 0.063 *** 0.019 3.30 0.084 *** 0.030 2.84
Year 1997 -2.551 2.063 -1.24 -3.468 3.001 -1.16 -4.581 7.239 -0.63 -6.700 15.036 -0.45
Year 1998 -5.214 *** 1.919 -2.72 -2.996 2.720 -1.10 -8.336 6.858 -1.22 -10.225 12.771 -0.80
Year 1999 -2.839 1.897 -1.50 -2.208 2.577 -0.86 -2.064 6.388 -0.32 -11.771 12.726 -0.92
Year 2000 -3.071 * 1.812 -1.69 -0.735 2.502 -0.29 -1.898 6.282 -0.30 -10.940 12.339 -0.89
Year 2001 -4.672 *** 1.757 -2.66 0.449 2.474 0.18 -3.521 6.237 -0.56 -11.282 12.093 -0.93
Year 2002 -4.023 ** 1.755 -2.29 -0.837 2.476 -0.34 -6.912 6.271 -1.10 -13.904 13.338 -1.04
Year 2003 -5.226 *** 1.777 -2.94 -0.673 2.504 -0.27 -6.151 6.300 -0.98 -12.537 13.109 -0.96
Year 2004 -5.169 *** 1.801 -2.87 -1.136 2.521 -0.45 -5.265 6.350 -0.83 -17.446 12.869 -1.36
Year 2005 -6.389 *** 2.128 -3.00 -0.481 2.579 -0.19 -4.864 6.345 -0.77 -13.210 13.068 -1.01
Year 2006 -4.492 3.485 -1.29 -1.390 3.158 -0.44 -6.509 6.614 -0.98 -13.978 13.312 -1.05
Year 2007 -4.790 * 2.881 -1.66 -8.528 ** 3.460 -2.46 -8.900 6.532 -1.36 -16.856 13.291 -1.27
Year 2008 -11.485 *** 4.091 -2.81 -12.267 *** 3.710 -3.31 -8.267 6.566 -1.26 -14.755 13.418 -1.10
Year 2009 -13.932 *** 4.905 -2.84 -12.594 *** 3.597 -3.50 -11.070 * 6.590 -1.68 -11.909 13.752 -0.87
Year 2010 -14.212 *** 4.918 -2.89 -12.683 *** 3.442 -3.69 -9.657 6.507 -1.48 -18.131 13.918 -1.30
Year 2011 -12.826 ** 5.110 -2.51 -14.238 *** 3.919 -3.63 -10.265 6.588 -1.56 -19.658 13.786 -1.43
Constant 7.990 ** 3.234 2.47 6.328 *** 2.425 2.61 8.465 6.093 1.39 20.047 * 12.025 1.67
Number of observations R2
Notes: (1) The dependent variable is the natural logarithm of quantity sold.
(2) ***, **, and * denote statistical significance at the 1%, 5%, and 10% significance levels, respectively.
(3) In addition to the variables shown, firm fixed effects were used as explanatory variables.
(4) Outdoor unit weight and refrigerant quantity were used as instrumental variables for price.
0.319 0.338
2.5-kilowatt cooling capacity 2.8-kilowatt cooling capacity Explanatory Variable
0.303 2,281 0.355
1,911
Table 4. Demand Estimates with Achievement Rate as Performance Measure
4-kilowatt cooling capacity 5-kilowatt cooling capacity
1,780 917