Evaluating pancreas function by meal tolerance test (MTT) in
diabetes
Hiroshi BANDO
*1,2, Koji EBE
2,3, Tetsuo MUNETA
2,4, Masahiro BANDO
5,
Yoshikazu YONEI
61 Tokushima University / Medical Research, Tokushima, Japan 2 Japan Low Carbohydrate Diet Promotion Association, Kyoto, Japan 3 Takao Hospital, Kyoto, Japan
4 Muneta Maternity Clinic, Chiba, Japan
5 Department of Nutrition and Metabolism, Institute of Biomedical Sciences, Tokushima University Graduate School, Tokushima,
Japan
6 Anti-Aging Medical Research Center, Graduate School of Life and Medical Sciences, Doshisha University, Kyoto, Japan
American Journal of Diabetes Research
2018; 1(1): 101- 109 . doi: 10.31488/ajdr.101
Research article
*Corresponding author: Hiroshi BANDO, MD, PhD, FACP, Tokushima University /Medical Research, Nakashowa 1-61, Tokushima
770-0943 Japan, Tel: +81-90-3187-2485; E-mail: [email protected] Received: July 04, 2018; Accepted: July 27, 2018; Published: July 29, 2018
Abstract
Background: Diabetic nutritional treatment involves the discussion of Low Carbohydrate Diet (LCD) and Calorie Restriction (CR). Authors have initiated and developed LCD in Japan and continued clini-cal research. In this study, we investigated glucose variability in patients with type 2 diabetes mellitus (T2DM). Subjects and Methods: Subjects were 60 T2DM patients of 62.7 years in average with its fasting immunoreactive insulin (IRI) less than 5μU/mL. Methods include basal blood test, daily profile of blood glucose and insulinogenic index (IGI) for 70g of carbohydrate (0-30min) in CR breakfast. Correlation among these and comparison in 4 groups categorized by Morbus value were analyzed. Results: Basal data revealed HbA1c 7.9%, daily glucose 222 mg/dL in average, and Triglyceride 83 mg/dL, Morbus value 150, HOMA-R 1.1, HOMA-β 11.0 in median. Delta Ratio of IGI and AUC ratio of IGI showed significant correlations with M value and HbA1c (p<0.01). Discussion and Conclusion: Meal Tolerance Test (MTT) has been recently used for convenient methods and meaningful results. AUC ratio suggests a little superior than Delta ratio for its higher correlation coefficient. These results would become the basal data in this field, and further development of related research is expected in the future.
Keywords: area under the curves (AUC), insulinogenic index (IGI), type 2 diabetes mellitus (T2DM), morbus value (M value), delta ratio of IGI, AUC ratio of IGI
As to diabetes mellitus, the prevalence of diabetes has been increasing worldwide, and it would become not only medical problem, but also social, economic and ecological problems [1]. Diabetes has a variety of complications with micro-angiopathy and macro-angiopathy. The former includes neuropathy, retinopathy and neuropathy, and furthermore, the latter includes large vessels impairment and dysfunction of head, heart and lower leg [2].
For diabetic prevention and treatment, several diabet-ic societies have presented their guidelines until now. There was recently the proposal of changes in the guide-line about the goal of treatment for diabetes. American Diabetes Association (ADA) has given the comments in 2017 [3], which was followed by the joint algorithm of European Diabetes Society (EASD) 2012 [4]. In succes-sion, American College of Physicians (ACP) has
proposed the change in standard value concerning the goal of HbA1c value [5], where the management goal for HbA1c in most type 2 diabetic patients would be 7% or more and less than 8%. This seemed to be a large impact for several diabetic societies. Against the concept of ACP, ADA made an objection comment immediately [6]. Thus, diabetic management has been in discussion among sever-al guidelines from medicsever-al societies, leading to better clini-cal practice with accumulated evidences.
For years, the problem about carbohydrate intake has been continued. Diabetic nutritional treatment can be generally classified into 2 representative groups One is Calorie Restriction (CR) diet, and another is Low Carbo-hydrate Diet (LCD) [7,8]. The former means mainly the restriction fat and calorie restriction, while the latter means reduced amount of carbohydrate. LCD has been known for clinical effects such as weight reduction and several bene-ficial aspects.
Originally, LCD was started by Atkins and others in North American region and European countries [9]. After that, authors and colleagues started to introduce LCD projects in Japan and developed LCD through lots of books, seminars, presentation in medical conferences and papers [10,11]. We also developed social movement through Japan Low Carbohydrate Diet Promotion Associa-tion [10]. We have continued clinical practice for diabetes with three useful LCD formula meals, which are petit LCD, standard LCD, super LCD) [11]. Furthermore, we already presented various research reports concerning LCD, M value, ketone bodies and related investigation [12-14].
As we have continued diabetic research using LCD and CR, we have reported the proposal for clinically new index which is simple and useful method. It has been simi-lar method and calculation of insulinogenic index (IGI) against 75g oral glucose tolerance test (75gOGTT). Subjects have breakfast with 70g of carbohydrate, fat and protein in it, which is one of the meal tolerance test (MTT). Furthermore, the response of blood glucose and immuno-reactive insulin (IRI) would be measured [15]. It is called insulinogenic index (IGI)-Carbohydarate70g (IGI-Car-bo70), and seems to play a role of simple and useful clini-cal diabetic practice. We develop this evaluation method, and continue further investigation concerning IGI and average glucose, M value and measurement of Delta (increment) ratio and Area Under the Curves (AUC) ratio of IGI in this study.
Subjects and Methods
Subjects enrolled in this study were 60 patients with type 2 diabetes mellitus (T2DM). For evaluation and treat-ment for T2DM, they were admitted to the hospital. We have performed the standard diabetic examination protocol for CR and LCD program. Regarding the necessary
elements and condition of the patients, the following items were included. i) medical diagnosis was T2DM, ii) type 1 diabetes mellitus (T1DM) and special type of DM were excluded, iii) patients who had already have insulin therapy were excluded, iv) patients whose body mass index (BMI) was 35 and more than 35 were excluded, v) patients whose IRI level was 5 and more than 5 μU/mL were excluded.
Methods for the study were according to our exam-ination protocol for diabetes with the meal of CR and LCD. In this study, the following procedures were used.
Morbus value
As one of the biomarker for indicating average blood glucose level and also the mean amplitude of glycemic excursions (MAGE), M value has been introduced [17,18]. Consequently, M value suggests the degree of
In regard to research protocol, patients are to take the standard meal of CR on day 1 and 2, and LCD after day 3, with 1400 kcal/day each. In the case of current study, we used the data of meal tolerance test (MTT) in the morning of day 2, and the data of daily glucose profile 7 times a day on day 2.
In the morning of day 2 after overnight fasting, fundamental biomarkers related to diabetes were measured. They included glucose, HbA1c, IRI, complete blood count, liver and kidney function, lipids and so on.
On day 2 just after drawing blood samples for basal items, patients were to take breakfast of standard formula. It included 70g of carbohydrate, protein and fat. As to this breakfast of CR, PFC ratio was 15% of protein, 25% of fat and 60% of carbohy-drate. The content of this standard meal was due to the standard guideline of diabetes meal that was proposed by Japan Diabetes Society (JDS) [16]. The content of the breakfast was calculated as follows: The meal has 1400 kcal/day and the ratio of the carbohydrate is 60%, then 840 kcal was from the carbohydrate per day. One third of 840 kcal is 280kcal, and 280kcal of carbohydrate equals to 70g of carbohydrate as a breakfast.
MTT was performed in the following: Pre and post 30 min of breakfast, blood sample was drawn for blood glucose and IRI. After breakfast for 30 minutes, the subjects were indicated to keep still on the chair on sitting position.
The examination of daily profile of blood glucose was done during Day 2. Blood samples were drawn 7 times a day. They were 0800, 1000, 1200, 1400 1700, 1900, 2200h. From these results, average blood glucose value and also Morbus (M) value were obtained using the standard formula calcula-tion for M value.
(i) (ii) (iii) (iv) (v) (vi)
[17,18]. Consequently, M value suggests the degree of hyperglycemia and also the degree of high fluctuation or swinging of blood glucose in a day. The data of M value has been calculated by the way of logarithmic transforma-tion. It can suppose the deviation of glucose level and swinging level from ideal glucose level [17-19]. The level of M value is calculated by the method of logarithmic transformation, which means the deviation of glucose from ideal glucose value [17-19].
There is the formula to calculate the M value in the following way. At first, the basic equation is that M = MBS + MW, and M value is the total of MBS and MW. Second-ly, MW is (maximum blood glucose − minimum glucose)/20. Moreover, MBS is the mean of MBSBS. When these equations are summarized, MBSBS is the individual M-value for each blood glucose, calculated as (absolute value of [10 × log (blood glucose level/120)])3
[17-20].The result of M value has been clinically evaluated as follows: normal range is less than 180, borderline is from 180 to 320, abnormal levels are from 180 to 320.
Insulinogenic index for MTT
According to the results of glucose and IRI on 0 and 30 min in the MTT, two kinds of IGI were calculated. In the case of 75gOGTT, IGI has been indicated to speculate pancreas function by the ability of secretion of insulin. The formula is that the increment (delta) of insulin (30min – 0 min) / increment (delta) of blood glucose (30min – 0min). In this article, it equals to the ‘Delta Ratio of IGI for Carbo70’.
We tried another evaluating method, taking the advan-tage of the Area Under the Curves (AUC) describing the responses of glucose and insulin. By comparing the area size, we call the ratio between IRI and glucose as the ‘AUC Ratio of IGI for Carbo70’. To summarize the both calcula-tion methods, two biomarkers were as follows: the Delta Ratio of IGI for Carbo70 is defined as (IRI at 30min – IRI at 0min) (μU/mL) / (Glucose at 30min – Glucose at 0min) (mg/dL). On contrast, the AUC Ratio of IGI for Carbo70 is defined as (AUC of IRI for 0-30min) (μU/mL x h)/ (AUC of glucose for 0-30min) (mg/dL x h).
Glucose variability of a day
Regarding to the daily profile of blood glucose, 7 times of blood samples were drawn on day 2. From the obtained data, average blood glucose on day 2, and M value were investigated. According to the previous study, there were almost the similar data of comparison between 7-times sampling and 20 times sampling [19,20].
Statistical analysis
In current study, data were revealed by mean and standard deviation, and also by the median and quartile of 25% / 75% in several biomarkers. The latter are described
as median [25%–75%] inserted numerical value in the parenthesis. With regard to the statistical calculation, the correlation coefficients were used for the study, in which Spearman test has been utilized on analytical evaluation [21].
Ethical Standard
This research was conducted in compliance with the ethical principles based upon the Declaration of Helsinki. In addition, additional commentary was done in 2004 General Assembly Tokyo, Japan. These were conducted with Personal Information Protection Law and in refer-ence to “Standards for the Implementation of Clinical Trials (GCP), an ordinance of the Ministry of Health, Labour and Welfare No. 28 of March 27, 1997. Further-more, there was the “Ethical Guidelines for Epidemiology Research” presented by the Ministry of Education, Culture, Sports, Science and Technology and the Ministry of Health, Labour and Welfare.
Authors and colleagues had an ethical committee consisting of professionalisms, such as physician, nurse, pharmacist and other experts in the legal specialty. We have discussed enough and confirmed that current study is valid and agreed with all members. We have obtained informed consents and written paper agreements from the subjects. Current study was registered by National University Hospital Council of Japan (ID: #R000031211).
Results
Basal data
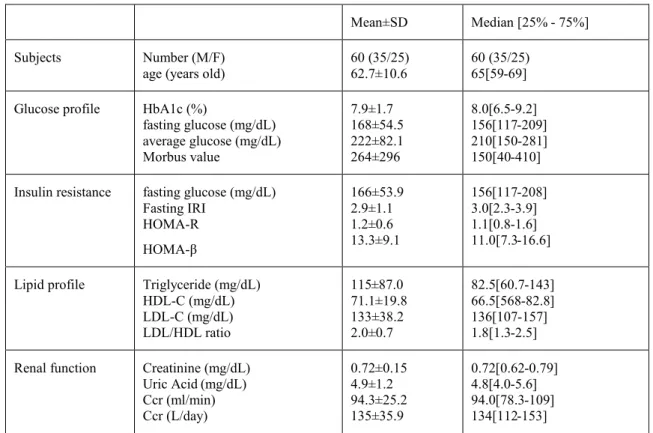
Several data of the subjects in the morning on Day 2 were shown in Table 1. There were average data about 62.7 years in age, 7.9% in HbA1c, 222 mg/dL in glucose, respectively. There were median data about 150 in M value, 1.1 in HOMA-R, 82.5 mg/dL in Triglyceride, respectively.
Responses of Glucose and insulin for Carbo70 were shown in Table 2. From the data of 0 min and 30 min, Delta Ratio of IGI for Carbo70 and AUC ratio of IGI for Carbo70 were 0.12 [0.07–0.21] and 3.1 [2.3-4.6], respec-tively.
Correlation between IGI and M value
IGI was calculated by 2 methods, one is Delta Ratio of IGI for Carbo70, and another is AUC Ratio of IGI for Carbo70. There was significant correlation between Delta Ratio of IGI for carbo70 and M value (p<0.01) (Figure 1a). Similarly, there was significant correlation between AUC Ratio of IGI for carbo70 and M value (p<0.01) (Figure1b). Compared the both, the latter showed higher correlation coefficient, with the results of R2 = 0.16 vs
Table 1. Subjects and basal data.
Table 2. Responses of Glucose and insulin for Carbo70
Mean±SD Median [25% - 75%] Subjects Number (M/F)
age (years old) 60 (35/25) 62.7±10.6 60 (35/25) 65[59-69] Glucose profile HbA1c (%)
fasting glucose (mg/dL) average glucose (mg/dL) Morbus value 7.9±1.7 168±54.5 222±82.1 264±296 8.0[6.5-9.2] 156[117-209] 210[150-281] 150[40-410] Insulin resistance fasting glucose (mg/dL)
Fasting IRI HOMA-R HOMA-β 166±53.9 2.9±1.1 1.2±0.6 13.3±9.1 156[117-208] 3.0[2.3-3.9] 1.1[0.8-1.6] 11.0[7.3-16.6] Lipid profile Triglyceride (mg/dL)
HDL-C (mg/dL) LDL-C (mg/dL) LDL/HDL ratio 115±87.0 71.1±19.8 133±38.2 2.0±0.7 82.5[60.7-143] 66.5[568-82.8] 136[107-157] 1.8[1.3-2.5] Renal function Creatinine (mg/dL)
Uric Acid (mg/dL) Ccr (ml/min) Ccr (L/day) 0.72±0.15 4.9±1.2 94.3±25.2 135±35.9 0.72[0.62-0.79] 4.8[4.0-5.6] 94.0[78.3-109] 134[112-153] Mean±SD Median [25% - 75%]
Response of glucose before (0 min)
after (30 min) delta (0-30 min) 168±54.5 218±61.8 51.9±27.8 156[117-209] 210[165-271] 46[32-64]
Response of Insulin before (0 min)
after (30 min) delta (0-30 min) 2.9±1.1 10.2±7.7 7.4±7.5 3.0[2.3-3.9] 8.7[6.3-11.9] 5.4[3.6-8.8] Delta Ratio of IRI/Glu Delta of glucose
Delta of insulin Delta of Ratio 51.9±27.8 7.4±7.5 0.17±0.19 46[32-64] 5.4[3.6-8.8] 0.12[0.07-0.21]
AUC Ratio of IRI/Glu AUC of glucose 277±83.2 263[201-349]
Correlation between IGI and HbA1c
There was significant correlation between Delta Ratio of IGI for carbo70 and HbA1c (p<0.01) (Figure 2a). Simi-larly, there was significant correlation between AUC Ratio of IGI for carbo70 and HbA1c (p<0.01) (Figure 2b). Com-pared the both, the latter showed higher correlation coeffi-cient, with the results of R2 = 0.16 vs 0.30, respectively. Comparison of M value and HbA1c in 4 groups
Subjects (N=60) were classified into 4 groups accord-ing to the data of M value (n=15, each). M value in median in the 4 group was 15, 77, 227, 625, respectively (Figure
3a). HbA1c value was shown in Figure 3b.
Comparison of IGI in 4 groups
Grouping was performed due to M value and each group has 15 cases. IGI are calculated by 2 ways. One is Delta Ratio of IGI for Carbo70, and another is AUC Ratio of IGI for Carbo70. The result of the former was 0.18, 0.13, 0.12, 0.07 in median, respectively (Figure 4a). The result of the latter was 5.0, 3.9, 2.9, 1.9, respectively (Figure 4b). In comparison with the former, the latter that is AUC ratio of IGI for Carbo70, showed decreasing tendency value from group 1 to group 4.
Figure 1. Correla�on between Delta/AUC Ra�o and M value. 1a: Correla�on between Delta Ra�o of IGI and M value.
1b: Correla�on between AUC Ra�o of IGI and M value.
Figure 2. Correla�on between Delta/AUC Ra�o and HbA1c. 2a: Correla�on between Delta Ra�o of IGI and HbA1c. 2b:
Figure 3. Comparison of M value and HbA1c in 4 groups. 3a: Comparison of M value in 4 groups. 3b: Comparison of
HbA1c in 4 groups.
Figure 4. Comparison of Delta Ra�o and AUC Ra�o in 4 groups. 4a: Comparison of Delta Ra�o of IGI in 4 groups. 4b:
Discussion
Discussion on CR and LCD has been continued for years. In this perspective, authors have reported clinical research in two axes. As the first axis, standard meals of CR and LCD were provided and related biomarkers were measured and compared. Among these research, M value has been calculated which indicates average blood glucose and the degree of glucose fluctuation [15,22]. As the second axis, breakfast with 70g of carbohydrate from the standard CR meal has been tried for the response of glucose and insulin. This is one of the MTT similar to 75gOGTT [15,23,24].
Recently, MTT has been used more for the evaluation of pancreas function. Breakfast has been frequently applied, in which mixed macronutrients are included [25,26]. As an example, there are carbohydrate 50%, fat 35%, protein 15%, 450 kcal, including 56g of carbohydrate [25,26].
From two axes mentioned above, this study is the com-bination of the both. Daily profile of blood glucose and M value represent glucose variability in a day [22,27,28]. Furthermore, Delta or AUC ratio of IGI suppose the insulin secretion for 30 min. Consequently, this study would be related with the pathophysiological background of T2DM. The distribution of the data in M value was larger than that of HbA1c, suggesting that M value may be more useful with less overlap area than HbA1c, and that M value has benefit of indicating of both average glucose and mean amplitude of glycemic excursions (MAGE) into one numerical value [22,27,28].
In 60 cases of this study, median fasting blood glucose was 156 mg/dL, and the median average blood glucose was 210 mg/dL. The 7-times sampling method has reported to be the same result of 20-times sampling and continuous glucose monitoring (CGM). Probably, CGM will certainly be frequently used to the future, but at present this method is simple and useful for grasping blood glucose variability. In this study, the median increase of glucose and IRI increase for Carbo70 were 46 mg/dL and 5.4 μU/mL, respectively. The Delta Ratio of IGI for Carbo 70 values were 0.17 on average and 0.12 in median. Regarding this numerical value, there is a previously related reports. There was similar MTT report by Cozma et al. in which formula breakfast has 500 kcal in calorie and 55% of carbohydrate [29]. It contains 69g of carbohydrate, which is similar to our protocol with 70g of carbohydrate. Due to their protocol, they excluded the cases whose fasting glucose was more than 180 mg/dL, because of little insulin responses. Calculated from the data of Cozma et al. [29], supposed data of Delta ratio of IGI is 0.39, and AUC ratio of IGI is 12.3, which was similar to our results of those in group 1 and 2. Both data are similar in the carbohydrate loading 69g vs 70g, and in the insulinogenic index.
The correlation with M value was compared between
Delta ratio and AUC ratio. Significant correlation was observed in both cases, but higher correlation was found in the latter as R2 = 0.45. The reason is speculated to the
large variance in the Delta calculation method.
Similarly for the correlation with HbA1c, both Delta ratio and AUC ratio were compared. The latter showed a higher correlation as R2 = 0.30. This would be probably
due to wider distribution. Furthermore, compared with M value and HbA1c, the correlation of HbA1c with Delta and AUC ratio is lower in the latter. M value is calculated from the average blood glucose of the day examined, while HbA1c is assumed to be the average over the past month. These situation would be involved in the differ-ence between M value and HbA1c.
As for 4 groups, HbA1c data tended to overlap each other, whereas the M value showed little overlap. This is probably from the fact that M value indicates average and fluctuation of glucose, which would be considered to show larger difference in the numerical value.
In the study of 4 groups, Delta ratio and AUC ratio were compared. In the former, the median value over-lapped, but in the latter, the median value decreased in the group from 1 to 4. Accordingly, in the 4th groups with high average blood glucose, the decrease in insulin secre-tion ability is obviously recognized. It seems to be clearer in AUC ratio rather than delta ratio. Consequently, AUC ratio seems to be a little superior to Delta ratio as an analysis method of IGI.
In the clinical setting from now on, meal tolerance test (MTT) using Carbo 70g can be applied instead of 75g OGTT. Moreover, calculation method includes both delta ratio and AUC ratio. From current results, AUC ratio may be useful for clinical diabetic research, associated with assessment way for grouping.
There are several methods to suppose insulin response to carbohydrate loading in order to examine pancreatic function [30]. Conventionally, Intravenous Glucose Tolerance Test (IVGTT) and OGTT have been prevalent [31. In recent years, MTT has been introduced and adopt-ed in clinical practice and research.
There are some reports of MMT. One formula meal is high-protein Boost-HP (237ml, Vevey, Switzerland) consisting of carbohydrate 33g, protein 15g, fat 6g [32]. Its PFC ratio is 25:20:55, and speculated Delta IGI for Carbo 33g would be 1.6 in average. Another formula for MMT is a breakfast with 450 kcal and PFC = 15:35:50 [33]. In this case, carbohydrate dose seemed to be 56g in the breakfast.
Recent study showed 2 types of formula breakfast. One is carbo-breakfast with PFC = 15:20:65%, and anoth-er is protein-breakfast with PFC = 35: 20: 45% [34]. When same lunch were provided to carbo-group and protein-group, the latter showed higher insulin response and lower glucose increase. This is called ‘second-meal
Diab Care. 2012; 35:1364-1379.
American College of Physicians. Clinical Guidelines and Recommenda-tions. 2017.
American Diabetes Association. Pharmacologic Approaches to Glycemic Treatment: Standards of Medical Care in Diabetes-2018. Diab Care. 2018; 41(Suppl 1):S73-S85. doi: 10.2337/dc18-S008
Accurso A, Bernstein RK, Dahlqvist A, et al. Dietary carbohydrate restriction in type 2 diabetes mellitus and metabolic syndrome: time for a critical appraisal. Nutr Metab (Lond). 2008; 5: 9.
Meng Y, Bai H, Wang S, et al. Efficacy of low carbohydrate diet for type 2 diabetes mellitus management: A systematic review and meta-analysis of randomized controlled trials. Diab Res Clin Pract. 2017; 131:124-131. Atkins, Robert. Dr. Atkins' New Carbohydrate Gram Counter. M. Evans and Company. 1996.
Ebe K, Ebe Y, Yokota S, et al. Low Carbohydrate diet (LCD) treated for three cases as diabetic diet therapy. Kyoto Med Assoc J. 2004; 51: 125-129.
Bando H, Ebe K, Muneta T, et al. Clinical Effect of Low Carbohydrate Diet (LCD): Case Report. Diab Case Rep. 2017; 2: 124.
Muneta T, Kawaguchi E, Nagai Y, et al. Ketone body elevation in placenta, umbilical cord, newborn and mother in normal delivery. Glycative Stress Res. 2016; 3 (3): 133-140.
Bando H, Ebe K, Muneta T, et al. Effect of low carbohydrate diet on type 2 diabetic patients and usefulness of M-value. Diab Res Open J. 2017; 3(1): 9-16.
Ebe K, Bando H, Yamamoto K, et al. Daily carbohydrate intake correlates with HbA1c in low carbohydrate diet (LCD). J Diabetol. 2018; 1(1): 4-9. Bando H, Ebe K, Muneta T, et al. Proposal for Insulinogenic Index (IGI)-Carbo70 as Experimental Evaluation for Diabetes . J Clin Exp Endocrinol. 2017; 1: 102.
Japan Diabetes Association. Diabetes clinical practice guidelines Based on scientific evidence. 2013.
Schlichtkrull J, Munck O, Jersild M. The M-value, an index of blood sugar control in diabetics. Acta Med Scand. 1965; 177:95–102.
Service FJ, Molnar GD, Rosevear JW, et al. Mean amplitude of glycemic excursions, a measure of diabetic instability. Diab. 1970; 19: 644-655. Molnar GD, Taylor WF, Ho MM. Day-to-day variation of continuously monitored glycaemia: A further measure of diabetic instability. Diabetolo-gia. 1972; 8(5): 342-348.
Moberg E, Kollind M, Lins PE, et al. Estimation of blood-glucose variability in patients with insulin-dependent diabetes mellitus. Scand J Clin Lab Invest. 1993; 53: 507-514.
Yanai H. Four step excel statistics, 4th Edition, Seiun-sha Publishing Co.Ltd, Tokyo. 2015.
Monnier L, Colette C, Owens DR. Glycemic variability: The third compo-nent of the dysglycemia in diabetes. Is it important? How to measure it? J Diab Sci Technol. 2008; 2(6):1094-1100.
Bonora E, Zavaroni I, Alpi O, et al. Insulin and C-peptide responses to 75 g oral glucose load in the healthy man. Diab Metab. 1986; 12(3):143-8. Bando H, Ebe K, Muneta T, et al. Urinary C-Peptide Excretion for Diabet-ic Treatment in Low Carbohydrate Diet (LCD). J Obes Diab. 2018; 1: 13-18.
Yoshino G, Tominaga M, Hirano T, et al. The test meal A: A pilot model for the international standard of test meal for an assessment of both postprandial hyperglycemia and hyperlipidemia. J Jpn Diab Soc. 2006; 49:361–371.
Ohkura T, Shiochi H, Fujioka Y, et al. 20/(fasting C-peptide × fasting plasma glucose) is a simple and effective index of insulin resistance in patients with type 2 diabetes mellitus: a preliminary report. Cardiovasc Diab. 2013; 12:21.
Moberg E, Kollind M, Lins PE, et al. Estimation of blood-glucose variability in patients with insulin-dependent diabetes mellitus. Scand J Clin Lab Invest. 1993; 53: 507-514.
5. 6. 7. 8. 9. 10. 11. 12. 13. 14. 15. 16. 17. 18. 19. 20. 21. 22. 23. 24. 25. 26. 27. World Health Organization (2016) Global report on diabetes. ISBN 978 92 4 156525 7 (NLM classification WK 810).
Ojo O. An overview of diabetes and its complications. Diab Res Open J. 2016; 2(2): e4-e6.
American Diabetes Association. Pharmacologic Approaches to Glycemic Treatment. Diab Care. 2017; 40(Suppl 1):S64-S74.
Giaccari A, Giorda CB, Riccardi G, et al. Comment on: Inzucchi et al. Management of hyperglycemia in type 2 diabetes: a patient-centered approach. Position statement of the American Diabetes Association (ADA) and the European Association for the Study of Diabetes (EASD). 1.
2. 3. 4.
phenomenon’, keeping the glucose variability controlled. By the ingestion of mixed meal loading, GLP-1-in-duced insulin secretion has been observed [35]. For preload of mixed nutrient, glucose tolerance was decreased according to the severity level of T2DM [36]. From these, to study the responses to nutrient ingestion would clarify the pathophysiological function of T2DM, leading to improvement of glucose variability.
There are limitation of this study. Various research due to MTT have been found. Because the content has complex macronutrients, they may have unstable speed and degree of digestion and absorption, various kinds of mixture ratio or unexpected response of insulin secretion. However, our current research would become a fundamental data for future research.
Conclusion
In summary, we investigated 60 T2DM patients for the daily profile of blood glucose, average glucose and Morbus value. Furthermore, we studied IGI of insulin/glu-cose (0-30min) for Carbo70 and calculated the Delta Ratio of IGI for Carbo70 and the AUC Ratio of IGI for Carbo70. Obtained data were compared and correlations among those were investigated. AUC Ratio of IGI seemed to be a little superior for clinical research than Delta Ratio of IGI. These results would be the basal data in this field, and further development of related research is expected in the future.
Acknowledgement
As for this paper, some part of them was presented in the 90th Annual Congress of Japan Diabetes Society (JDS), Tokyo, 2018. The authors appreciate all staffs and patients for their understanding and cooperation.
Conflicts of Interest
The authors declare that they have no conflicts of inter-est.
Abbreviation
AUC: Area Under the Curve; IGI: Insulinogenic Index; T2DM: Type 2 diabetes mellitus; M value: Morbus value; IRI: imuunoreactive insulin
Yoshino G, Tominaga M, Hirano T, et al. The test meal A:A pilot model for the international standard of test meal for an assessment of both postpran-dial hyperglycemia and hyperlipidemia. J Jpn Diabetes Soc. 2006; 49:361–371.
Park YM, Heden TD, Liu Y, et al. A high-protein breakfast induces greater insulin and glucose-dependent insulinotropic peptide responses to a subsequent lunch meal in individuals with type 2 diabetes. J Nutr. 2015; 145(3):452-8.
Dalla Man C, Micheletto F, Sathananthan M, et al. Model-Based Quantifi-cation of Glucagon-Like Peptide-1-Induced Potentiation of Insulin Secretion in Response to a Mixed Meal Challenge. Diabetes Technol Ther. 2016; 18(1):39-46.
Tricò D, Baldi S, Tulipani A, et al. Mechanisms through which a small protein and lipid preload improves glucose tolerance. Diabetologia. 2015; 58(11):2503-12.
33.
34.
35.
36. McDonnell CM, Donath SM, Vidmar SI, et al. A novel approach to continuous glucose analysis utilizing glycemic variation. Diab Technol Ther. 2005; 7: 253-263.
Cozma LS, Luzio SD, Dunseath GJ, et al. Beta-cell response during a meal test: a comparative study of incremental doses of repaglinide in type 2 diabetic patients. Diab Care. 2005; 28(5):1001-7.
Cersosimo E, Solis-Herrera C, Trautmann ME, et al. Assessment of pancreatic β-cell function: review of methods and clinical applications. Curr Diabetes Rev. 2014; 10(1):2-42.
Veijola R, Koskinen M, Helminen O, et al. Dysregulation of glucose metabolism in preclinical type 1 diabetes. Pediatr Diab. 2016; 17 Suppl 22:25-30.
Bacha F, Gungor N, Lee S, et al. Indices of insulin secretion during a liquid mixed-meal test in obese youth with diabetes. J Pediatr. 2013; 162(5):924-9. 28. 29. 30. 31. 32.
To cite this article: Bando H, Ebe K, Muneta T, et al. Evaluating pancreas function by meal tolerance test (MTT) in diabetes. American Journal of Diabetes Research. 2018: 1:3.