IRUCAA@TDC : Relationship between oral tissue blood flow and oxygen tension in rabbit
9
0
0
全文
(2) 83. Bull Tokyo Dent Coll (2009) 50(2): 83–90. Original Article. Relationship between Oral Tissue Blood Flow and Oxygen Tension in Rabbit Yui Terakawa, Tatsuya Ichinohe and Yuzuru Kaneko Department of Dental Anesthesiology, Tokyo Dental College, 1-2-2 Masago, Mihama-ku, Chiba 261-8502, Japan. Received 11 May, 2009/Accepted for publication 1 June, 2009. Abstract Several studies have reported tissue blood flow and tissue oxygen tension during anesthesia, whereas there are few reports that discuss the relationship between tissue blood flow and tissue oxygen tension. The goal of this study was to investigate the relationship between these two variables before and after stellate ganglion block (SGB). We utilized 8 male Japan White rabbits. Anesthesia was maintained with propofol. For SGB, 0.2 ml of 1% lidocaine was injected and changes in mandibular bone marrow blood flow (BBF) and mandibular bone marrow oxygen tension (PbO2) were observed (Group B). After the observed variables completely recovered, 0.2 ml of 1% lidocaine was again injected and changes in masseter muscle blood flow (MBF) and masseter muscle oxygen tension (PmO2) were observed (Group M). The observed variables were hemodynamic parameters, common carotid artery blood flow, L (left side)-BBF, R (right side)-BBF, L-PbO2 , R-PbO2 , L-MBF, R-MBF, L-PmO2 and R-PmO2 . In both groups, positive correlations (r⳱0.99; y⳱0.68xⳮ3.49 in Group B and r⳱0.99; y⳱0.62xⳭ0.47 in Group M) were observed when tissue blood flow was set at the X-axis and tissue oxygen tension at the Y-axis. In contrast, when tissue blood flow was set at the Y-axis and tissue oxygen tension at the X-axis, two regression lines almost overlapped (y⳱1.47xⳭ5.12 in Group B and y⳱1.59xⳮ0.28 in Group M). Therefore, it is estimated that tissue blood flow increases by approximately 15 ml/min/100g when tissue oxygen tension increases by 10 mmHg. In conclusion, there is a positive correlation between tissue blood flow and tissue oxygen tension. Changes in tissue oxygen tension should reflect the increase or decrease in tissue blood flow. Key words:. Tissue oxygen tension—Tissue blood flow—Mandibular bone marrow— Masseter muscle—Rabbit. Introduction. on control of oral tissue blood flow during anesthesia have been conducted2–4,7–10,12,14,16,18). Common methods for observation of tissue blood flow include hydrogen clearance tissue blood flowmetry1), microsphere injection technique18,20), thermal diffusion flowmetry10) and. In oral and maxillofacial surgery, especially in orthognathic surgery, control of bleeding from bone marrow has an important influence on performance. Consequently, several studies 83.
(3) 84. Terakawa Y et al.. laser Doppler flowmetry25). Hydrogen clearance tissue blood flowmetry and microsphere injection technique allow observation of absolute values, but do not allow continuous monitoring of tissue blood flow. In contrast, thermal diffusion flowmetry allows continuous monitoring of change in tissue blood flow, but does not allow observation of absolute values. Laser Doppler flowmetry is suitable for continuous monitoring of blood flow at the tissue surface. In previous studies, it has been reported that tissue oxygen tension decreased with decrease in tissue blood flow following hypotension5,7,8,10), tissue ischemia19) and felypressin administration13). These reports5,7,8,10,13,19) suggested that tissue oxygen tension decreased as tissue blood flow decreased. However, these experimental conditions were not physiological. Therefore, the relationship between tissue blood flow and tissue oxygen tension under stable blood pressure and heart rate remains to be clarified. In this study, tissue oxygen tension was observed during not only decrease but also increase in tissue blood flow using SGB20,23), which was able to induce change in blood flow with minimal changes in blood pressure and heart rate, and the relationship between these two variables was clarified. Targeted variables included common carotid artery blood flow (CCBF), mandibular bone marrow blood flow (BBF), mandibular bone marrow oxygen tension (PbO2), masseter muscle blood flow (MBF) and masseter muscle oxygen tension (PmO2).. Materials and Methods 1. Animals Eight male Japan White rabbits (2.2– 2.7 kg) were utilized. Rabbits were purchased from Sankyo Labo Company, Tokyo. This study was performed according to The Guidelines for the Treatment of Experimental Animals at Tokyo Dental College. All animals were allowed food and water ad libitum until the morning of the experiment.. 2. Experimental design Anesthesia was induced by inhalation of 4.0% isoflurane in oxygen delivered using a mask. Before skin incisions were made for tracheostomy and femoral artery cannulation, 0.3 ml of 1% lidocaine without epinephrine was injected. A #20 Fr non-cuffed pediatric tracheal tube was inserted into the trachea through the tracheostomy. The left auricular marginal vein and right femoral artery were cannulated with 22- and 20-gauge Teflon indwelling catheters, respectively. After intravenous acetated Ringer’s solution was started at 10 ml/kg/hr, the animals were paralyzed with 14 g/kg/min rocuronium bromide (Eslax, Schering-Plough, Tokyo) and mechanically ventilated. End-tidal tension of carbon dioxide (ETCO2) was maintained at about 35 mmHg with an anesthetic gas monitor (Capnmac, Datex, Helsinki). Femoral artery blood pressure was continuously monitored with a pressure transducer (P231D; Gould, Oxnard, California). Heart rate (HR) was recorded by a tachograph triggered by blood pressure wave. CCBF was measured with an ultrasound flowmeter (T108; Transonic, Ithaca, NY). A flow probe (type 3SB) was applied to the isolated left common carotid artery. After the skin incision along both left and right lower margins of the mandible without local anesthesia, the periosteum of the mandibular body was exposed. The periosteum was detached to expose the surface of the mandibular body on both sides. Two small holes (approximately 1 mm in diameter, one in the left side and the other in the right side) perforating into the bone marrow through the cortical bone were drilled with a round bur (ISO. 008, Morita, Japan). The two pairs of needle probes of a hydrogen clearance tissue blood flowmeter (UHE-100, Unique Medical, Japan) and a PO2 monitor (PO2 100DW, Unique Medical) were inserted into the left (L) and right (R) bone marrow to measure BBF and PbO2, respectively. In addition, the fascia of the masseter muscle was detached to expose the masseter muscle on both sides. The two pairs of needle probes of a hydrogen clearance tissue blood flowmeter.
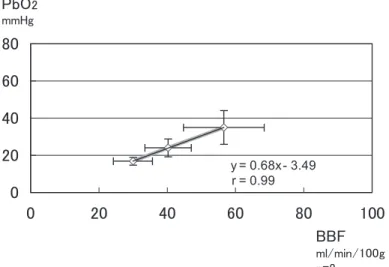
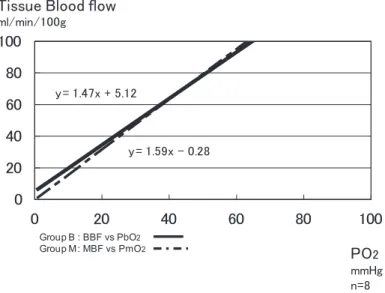
(4) 85. Tissue Blood Flow and Tissue Oxygen Tension. and a PO2 monitor were inserted into the left and right masseter muscle to measure MBF and PmO2 , respectively. Two 24 -gauge Teflon indwelling catheters were used to fix the needle probes. Teflon catheters (1.5 cm long from the hub) were fixed using utility wax. The needle probes of a hydrogen clearance tissue blood flowmeter and a PO2 monitor were inserted into the Teflon catheters (one needle in one catheter). The tips of each needle probe were adjusted so as to be 1 mm apart from each other and were fixed to mandibular bone marrow or masseter muscle. After completion of experimental preparations, isoflurane inhalation was discontinued. Then, propofol was started at 12 mg/kg/hr and maintained at that level for more than 60 min to stabilize the hemodynamic and respiratory parameters. Body temperature was continuously monitored with a rectal probe and maintained between 39.0 and 39.5°C with the aid of a heating lamp. The observed parameters were systolic blood pressure (SBP), diastolic blood pressure (DBP), mean arterial pressure (MAP), HR, CCBF, L-BBF, RBBF, L-PbO2, R-PbO2, L-MBF, R-MBF, L-PmO2 and R-PmO2 . All data, except BBF and MBF, were continuously recorded on a polygraph (Series360 NEC, Sanei, Tokyo). For SGB, the tip of the needle was placed on the left transverse process of the cervical vertebra, 1–2 mm caudal to the cricoid cartilage21,23). A 26-gauge needle connected to a 1-ml disposable syringe was used. After confirming contact of the tip of the needle with the left transverse process, 0.2 ml of 1% lidocaine was injected and changes in BBF and PbO2 were observed (Group B). More than 60 min was allowed for the observed parameters to completely recover. After that, 0.2 ml of 1% lidocaine was injected and changes in MBF and PmO2 were observed (Group M). Data were recorded immediately before SGB (Pre) and at the time when maximal change in tissue oxygen tension was observed after SGB (Post). The mean of the Pre values for BBF, MBF, PbO2 and PmO2 were calculated and served as a control.. 3. Statistical analysis In this study, data are expressed as the meanⳲstandard deviation. Linear regression and the Pearson correlation coefficient were used to analyze the relationship between tissue blood flow and tissue oxygen tension. A one-way analysis of variance for repeated measurements followed by the Student-NewmanKeuls test for multiple comparisons were used. p-values of less than 0.05 were considered statistically significant.. Results There were no differences between Pre and Post values for HR, SBP, DBP and MAP in both groups. There were no differences in Pre values for CCBF in both groups. CCBF showed a significant increase from Pre to Post in both groups, whereas there were no differences in Post values for CCBF in both groups (Table 1). There were no differences in Pre values for BBF, MBF, PbO2 and PmO2 on both sides. All these variables showed significant change from Pre to Post (Table 2). L-BBF, L-PbO2, L-MBF and L-PmO2 significantly increased after SGB in both groups. In contrast, R-BBF, R-PbO2, R-MBF and R-PmO2 significantly decreased after SGB in both groups (Table 3). In both groups, positive correlations (r⳱0.99; y⳱0.68xⳮ3.49 in Group B and r⳱0.99; y⳱0.62xⳭ0.47 in Group M) were observed when tissue blood flow was set at the X-axis and tissue oxygen tension at the Y-axis (Figs. 1, 2). Conversely, when tissue blood flow was set at the Y-axis and tissue oxygen tension at the X-axis, two regression lines almost overlapped (y⳱1.47xⳭ5.12 in Group B and y⳱1.59x ⳮ0.28 in Group M) (Fig. 3).. Discussion In this study, positive correlations were observed between tissue blood flow and tissue oxygen tension in both bone marrow and.
(5) 86. Terakawa Y et al.. muscle. Anesthesia was maintained with 12 mg/kg/ hr propofol and room air. Tissue oxygen tension increases under 100% oxygen in. comparison with room air. Therefore, the rabbit was mechanically ventilated with room air. Because propofol was most appropriate to this environment in our pilot study,. Table 1 Hemodynamic variables and CCBF Pre. Post. Group B. HR (bpm) SBP (mmHg) DBP (mmHg) MAP (mmHg) CCBF (ml/min). 292.5Ⳳ35.8 128.1Ⳳ14.9 61.9Ⳳ8.8 86.3Ⳳ9.5 31.4Ⳳ9.3. 291.3Ⳳ34.0 127.5Ⳳ12.2 61.9Ⳳ5.9 86.3Ⳳ7.4 48.5Ⳳ17.3*. Group M. HR (bpm) SBP (mmHg) DBP (mmHg) MAP (mmHg) CCBF (ml/min). 280Ⳳ34.2 133.1Ⳳ15.3 66.3Ⳳ6.4 88.8Ⳳ9.9 29.3Ⳳ7.6. 283.8Ⳳ32.4 135.6Ⳳ12.7 70.6Ⳳ13.5 91.9Ⳳ7.5 49.8Ⳳ13.5*. HR: heart rate; SBP: systolic blood pressure; DBP: diastolic blood pressure; MAP: mean arterial pressure; CCBF: common carotid artery blood flow meanⳲstandard deviation *: p⬍0.05 vs Pre. Table 2 Changes in Pre and Post in Group B and M Pre. Post. Group B. L-BBF (ml/min/100 g) L-PbO2 (mmHg) R-BBF (ml/min/100 g) R-PbO2 (mmHg). 40.1Ⳳ7.2 24.5Ⳳ5.9 40.4Ⳳ7.1 23.5Ⳳ4.6. 56.6Ⳳ11.8* 35.0Ⳳ9.0* 30.0Ⳳ5.7* 16.9Ⳳ2.1*. Group M. L-MBF (ml/min/100 g) L-PmO2 (mmHg) R-MBF (ml/min/100 g) R-PmO2 (mmHg). 40.4Ⳳ8.7 25.8Ⳳ7.4 40.9Ⳳ8.6 28.3Ⳳ7.9. 66.5Ⳳ11.7* 41.5Ⳳ8.1* 31.8Ⳳ6.2* 19.3Ⳳ3.1*. BBF: mandibular bone marrow blood flow; PbO2 : mandibular bone marrow oxygen tension; MBF: masseter muscle blood flow; PmO2: masseter muscle oxygen tension L: left side R: right side meanⳲstandard deviation *: p⬍0.05 vs Pre. Table 3 Changes in tissue blood flow and tissue oxygen tension after SGB in Group B and M Right side. Control. Left side. Group B. BBF (ml/min/100 g) PbO2 (mmHg). 30.0Ⳳ5.7* 16.9Ⳳ2.1*. 40.2Ⳳ6.8 24.0Ⳳ4.8. 56.6Ⳳ11.8* 35.0Ⳳ9.1*. Group M. MBF (ml/min/100 g) PmO2 (mmHg). 31.8Ⳳ6.2* 19.3Ⳳ3.1*. 40.6Ⳳ8.6 27.0Ⳳ7.3. 66.5Ⳳ11.7* 41.5Ⳳ8.1*. BBF: mandibular bone marrow blood flow; PbO2 : mandibular bone marrow oxygen tension; MBF: masseter muscle blood flow; PmO2 : masseter muscle oxygen tension meanⳲstandard deviation *: p⬍0.05 vs control.
(6) Tissue Blood Flow and Tissue Oxygen Tension. propofol was used in this study. The infusion rate of propofol was 12 mg/kg/hr. According to previous studies4,14), this value is based on the blood concentration of propofol at Cp50skin incision. In our previous study, the infusion rate of rocuronium bromide which provided stable muscular relaxation was 14g/kg/min23).. 87. The relationship between tissue blood flow and tissue oxygen tension was investigated before and after SGB. SGB inhibits nerve conduction via sympathetic preganglionic fibers to the superior and middle cervical ganglions and postganglionic fibers of the stellate ganglion15). Tissue blood flow in head, face, neck and upper limbs is increased by its sym-. Fig. 1 Relationship between mandibular bone marrow blood flow (BBF) and mandibular bone marrow oxygen tension (PbO2) in Group B A positive correlation (r⳱0.99; y⳱0.68xⳮ3.49) was observed.. Fig. 2 Relationship between masseter muscle blood flow (MBF) and masseter muscle oxygen tension (PmO2) in Group M A positive correlation (r⳱0.99; y⳱0.62xⳭ0.47) was observed..
(7) 88. Terakawa Y et al.. patholytic effects21,22), whereas tissue blood flow is decreased on the non-block side17,22,26). Therefore, it is possible to observe change in tissue oxygen tension during increase or decrease in tissue blood flow at the same time. Consequently, SGB was adopted in this study as an experimental strategy to increase or decrease tissue blood flow. In our previous study, changes in MBF and PmO2 were observed after SGB on the left side. L-MBF, L-PmO2 , R-MBF and R-PmO2 were approximately 70 ml/min/100g, 40 mmHg, 35 ml/min/100g and 25 mmHg, respectively24). These data are almost on the regression lines of Figs. 1 and 2, respectively. Therefore, it is suggested that the results of this study are reasonable. It has been reported that cerebral cortical oxygen tension decreased by 5% when cerebral blood flow decreased by 15% to 20% during acute hypotension7,8). Myocardial tissue oxygen tension in the inner layer decreased by approximately 20% when coronary blood flow decreased by approximately 50% after administration of felypressin13). Liver and renal oxygen tension decreased by approximately 25% and 30% when liver and renal blood flow decreased by approximately 35% during. deliberate hypotension5). Although it is difficult to compare the results of these studies with those of the present study because of the different experimental methods, it is suggested that tissue oxygen tension will decrease depending on decrease in tissue blood flow. In contrast, nasal mucosal oxygen tension increased after SGB11). However, in this study, change in nasal mucosal blood flow was not observed. It has been reported that a correlation between cerebral blood flow and cerebral cortical oxygen tension was observed using thermal diffusion flowmetry during cerebral ischemia19). Although the observational method was different from this study, the correlation between them is almost equal to the correlation between BBF and PbO2, and MBF and PmO2 obtained in this study. In this study, increase or decrease in tissue oxygen tension was observed using SGB, which was able to induce change in blood flow with minimal change in blood pressure and heart rate22). Based on the results of this study, it was demonstrated that there was a strong relationship between tissue blood flow and tissue oxygen tension. Changes in tissue oxygen tension should reflect increase or decrease in tissue blood flow.. Fig. 3 Relationship between tissue oxygen tension and tissue blood flow in Groups B and M Positive correlations (r⳱0.99; y⳱1.47xⳭ5.12 in Group B and r⳱0.99; y⳱1.59xⳮ0.28 in Group M) were observed..
(8) Tissue Blood Flow and Tissue Oxygen Tension. PO2 monitoring allows continuous observation of tissue oxygen tension6,10). In contrast, hydrogen clearance tissue blood flowmetry allows observation of absolute values, but does not allow continuous monitoring of tissue blood flow1). In this study, when tissue oxygen tension was set at the X-axis and tissue blood flow at the Y-axis, the regression lines of mandibular bone marrow and masseter muscle were y⳱1.47xⳭ5.12 and y⳱1.59xⳮ0.28, respectively. Therefore, it is estimated that tissue blood flow will change by approximately 15 ml/min/100g when tissue oxygen tension, which can be continuously monitored, changes by 10 mmHg. In this study, rabbits were mechanically ventilated with room air. A different concentration of oxygen might result in a different regression line between tissue blood flow and tissue oxygen tension. In addition, blood pressure and arterial CO2 tension might affect the relationship between oral tissue blood flow and oxygen tension. Further study is needed to analyzed these relationships. In conclusion, there was a positive correlation between tissue blood flow and tissue oxygen tension. Changes in tissue oxygen tension reflect increase or decrease in tissue blood flow.. References 1) Aukland K, Bower BF, Berliner RW (1964) Measurement of local blood flow with hydrogen gas. Cir Res 14:164–187. 2) Bergman S, Hoffman WE, Gans BJ, Miletich DJ, Albrecht RF (1982) Blood flow to oral tissues: An experimental study with enflurane, sodium nitroprusside, and nitroglycerin. J Oral Maxillofac Surg 40:13–17. 3) Fukunaga AF, Flacke WE, Bloor BC (1982) Hypotensive effects of adenosine and adenosine triphosphate compared with sodium nitroprusside. Anesth Analg 61:273–278. 4) Handa M, Ichinohe T, Kaneko Y (2008) Changes in tension of arterial carbon dioxide induces redistribution oral tissue blood flow in the rabbit. J Oral Maxillofac Surg 66:1820– 1825. 5) Hashimoto K, Okazaki K, Okutsu Y, Tateyama. 6). 7). 8). 9). 10). 11). 12). 13). 14). 15). 16). 89. T, Okumura F (1992) Effect of hypotensive anesthesia on tissue oxygen tension of the heart, kidney and liver. Masui 41:1267–1270. (in Japanese) Hoffman WE, Charbel FT, Edelman G (1996) Brain tissue oxygen, carbon dioxide, and pH in neurosurgical patients at risk for ischemia. Anesth Analg 82:582–586. Ichinohe T, Agata H, Miyoshi T, Aida H, Kaneko Y (1997) Cerebral cortical regional blood flow and tissue oxygen tension during the trigeminal depressor response in rabbits. J Auton Nerv Syst 66:111–118. Ichinohe T, Agata H, Miyoshi T, Aida H, Kaneko Y (1998) Cerebral cortical regional blood flow and tissue oxygen tension during acute hypotension. J Jpn Dent Soc Anesthesiol 26:36–42. (in Japanese) Ichinohe T, Homma Y, Kaneko Y (1998) Mucosal blood flow during various intravenous and inhalational anesthetics in the rabbit. Oral Surg Oral Med Oral Pathol Oral Radiol Endod 85:268–271. Igarashi Y (1993) The influence of systemic blood pressure change on oral tissue blood flow and oxygen tension in mongrel dogs —the observation under the isofluran anesthesia and epinephrine administration—. J Jpn Dent Soc 21:374–390. (in Japanese) Iida Y (1990) Changes in the tension of oxygen of the nasal mucosa caused by stellate ganglion block. Nippon Jibiinkoka Gakkai Kaiho 93:157–164. (in Japanese) Kaneko Y (1987) Clinical experiences and physiological response to induced hypotensive anesthesia during oral and maxillofacial surgery. Especially on ATP. Shikwa Gakuho 87: 61–72. (in Japanese) Kasahara M, Ichinohe T, Kaneko Y (2000) Adenosine and amrinone reverse felypressininduced depression of myocardial tissue oxygen tension in dogs. Can J Anesth 47:1107– 1113. Kemmochi M, Ichinohe T, Kaneko Y (2009) Remifentanil decreases mandibular bone marrow blood flow during propofol and sevoflurane anesthesia in rabbits. J Oral Maxillofac Surg 67:1245–1250. Mulroy MF (1992) Peripheral Nerve Blockade, Clinical Anesthesia, Barash PG, Cullen BF, Stoelting RK, 2nd ed., pp. 841–870, Lippincott, Philadelphia. Niwa H, Sugiyama K, Joh S, Hirota Y, Kiyomitsu Y, Shibutani T, Sawada T, Matsuura H (1988) Oral tissue blood flows during controlled hypotension induced by adenosin triphosphate, trimethaphan and nitroglycerin in the anesthetized dog. Osaka Daigaku Shigaku.
(9) 90. Terakawa Y et al.. Zasshi 33:473–478. (in Japanese) 17) Okuda Y, Kitajima T (1994) Influence of stellate ganglion block on bilateral cervicobrachial arterial and venous blood flow. Masui 43: 1201–1206. (in Japanese) 18) Satinover IA, Hoffman WE, Miletich DJ, Gans BJ, Albrecht RF (1983) A comparison of the cardiovascular and orofacial blood flow changes resulting from hypotension induced by sodium nitroprusside and adenosine triphosphate in the rat. J Oral Maxillofac Surg 41: 500–507. 19) Scheufler KM, Rohrborn HJ, Zentner J (2002) Dose tissue oxygen-tension reliably reflect cerebral oxygen delivery and consumption? Anesth Analg 95:1042–1048. 20) Tanaka T, Kaneko Y (2001) Measurement of pulpal blood flow in dogs with nonradioactive colored micrispheres. Bull Tokyo Dent Coll 42:201–210. 21) Terakawa Y, Handa M, Ichinohe T, Kaneko Y (2007) Epinephrine in local anesthetic cancels increase in tongue mucosal blood flow after stellate ganglion block in rabbit. Bull Tokyo Dent Coll 48:37–42. 22) Terakawa Y, Ichinohe T, Kaneko Y (2009) Redistribution of tissue blood flow after stellate ganglion block in the rabbit. Reg Anesth Pain Med. (in press). 23) Terakawa Y, Ichinohe T, Kaneko Y (2009) Rocuronium and vecuronium do not affect mandibular bone marrow and masseter muscular blood flow in the rabbit. J Oral Maxillofac Surg. (in press) 24) Terakawa Y, Ichinohe T, Kaneko Y (2008) Tissue blood flow and tissue oxygen tension after stellate ganglion block in the rabbit. J Jpn Dent Soc Anesthesiol 36:446. (in Japanese) 25) Wang R, Ehara K, Fujita K, Tamaki N, Matsumoto S (1991) Blood flow, CO2 , response and autoregulation in the rat spinal cord by laser-doppler flowmetry and hydrogen clearance. Brain and Nerve 43:649–655. (in Japanese) 26) Yamazaki Y, Mimura T, Iwasaki F, Namiki A (1998) Regional cerebral blood flow and oxygenation following cervicothoracic sympathetic block. Masui 47:1233–1236. (in Japanese) Reprint requests to: Dr. Yui Terakawa Department of Dental Anesthesiology, Tokyo Dental College, 1-2-2 Masago, Mihama-ku, Chiba 261-8502, Japan E-mail: [email protected].
(10)
図

関連したドキュメント
16 By combining the tissue clearing method CUBIC, melanin bleaching, and immunostaining, we succeeded in making the eye transparent and acquiring images of the retina from outside
201 Tl distribution inhibiting the Sol antigravitational activation. However factors other than muscle activity may be involved in low blood perfusion seen in Sol of the U3w group.
men. In women, we confirmed that only VAT but not SAT showed an independent association with insulin resistance as assessed by Matsuda ISI, in agreement with prior studies
In [1, 2, 17], following the same strategy of [12], the authors showed a direct Carleman estimate for the backward adjoint system of the population model (1.1) and deduced its
Thus, in this paper, we study a two-phase fluid model for blood flow through mild stenosed narrow arteries of diameter 0.02 mm–0.1 mm at low-shear rates γ < ˙ 10/sec treating
The flow of a viscous, incompressible fluid between two eccentric rotating porous cylinders with suction/injection at both the cylinders, for very small clearance ratio is studied..
In this work we study spacelike and timelike surfaces of revolution in Minkowski space E 3 1 that satisfy the linear Weingarten relation aH + bK = c, where H and K denote the
Pour tout type de poly` edre euclidien pair pos- sible, nous construisons (section 5.4) un complexe poly´ edral pair CAT( − 1), dont les cellules maximales sont de ce type, et dont
