Study on Mechanical Properties of Modified
Sludge by Geopolymer and Fiber
著者
ブ ミン チェン
学位授与機関
Tohoku University
TOHOKU UNIVERSITY
Graduate School of Environmental Studies
Study on Mechanical Properties of Modified sludge
by Geopolymer and Fiber
(ジオポリマーと繊維質物質による改質土の機械的特性に関す
る研究)
By
Vu Minh Chien
Contents
Chapter 1 Introduction 1 1.1 Problem definition . . . 1 1.1.1 Landslide phenomenon . . . 1 1.1.2 Cement production . . . 4 1.1.3 By-product of industries . . . 61.1.4 Fiber-cement-stabilized soil method and Geopolymer . . . 8
1.2 Literature review . . . 10
1.3 Structure of the dissertation . . . 18
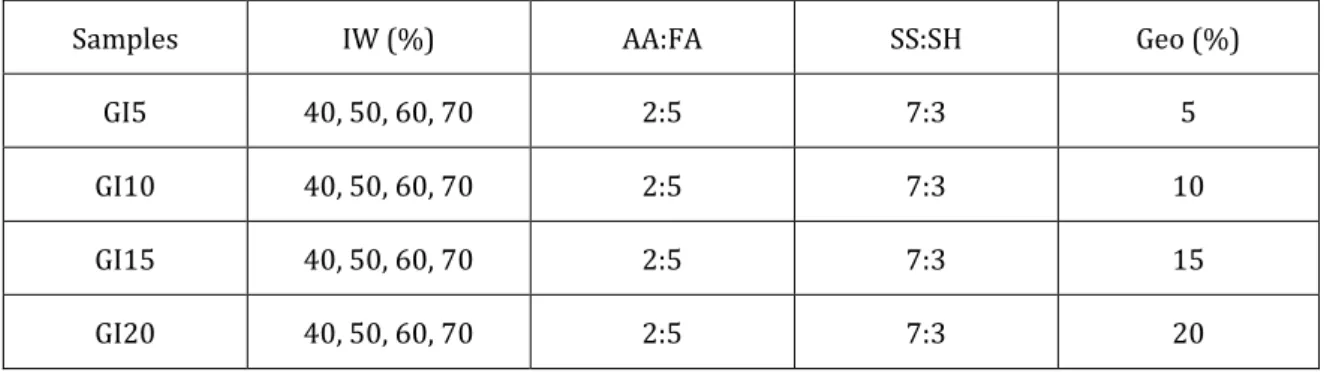
Chapter 2 Effect of ratio of alkaline solution, paper fragment, curing time, and geopolymer content on characteristic of stabilized sludge 23 2.1 Introduction. . . 23 2.2 Materials . . . 27 2.2.1 Imitation sludge . . . 27 2.2.2 Alkaline solution . . . 31 2.2.3 Fly ash . . . 32 2.2.4 Paper fragment . . . 34
2.3 Experimental results and discussions . . . 36
2.3.1 Effect of ratio of alkaline solution . . . 37
2.3.2 Effect of geopolymer content, paper debris, and curing time . . . 51
2.4 Conclusions . . . 65
Chapter 3 Effect of Initial Water, Moisture, and Geopolymer content on Geopolymer Modified Sludge with different procedure in construction site 70 3.1 Introduction. . . 70
3.2 Materials . . . 71
3.3 Experimental procedures . . . 72
3.4 Results and discussions . . . 74
3.4.1 Moisture content . . . 74 3.4.2 Bulk density . . . 76 3.4.3 Failure strength . . . 81 3.4.4 Failure strain . . . 85 3.4.5 XRD analysis . . . 92 3.4.6 SEM . . . 94 3.5 Conclusions . . . 96
Chapter 4 Investigation of the effect of clay content and other factors on modified sludge by Taguchi method 100 4.1 Introduction . . . 100
4.1.1 Role of clay in soil . . . 100
4.1.2 Taguchi method . . . 103
4.2 Materials . . . 106
4.3 Experimental procedures . . . 107
4.3.1 Permeability procedures . . . 110
4.3.2 Design of experiment . . . 111
4.4 Results and discussions . . . 113
4.4.1 Failure strength . . . 113 4.4.2 Failure strain . . . 114 4.4.3 Moist density . . . 116 4.4.4 Permeability . . . 117 4.4.5 Regression Analysis . . . 118 4.5 Conclusions . . . 140
Chapter 5 Liquified stabilized soil method using paper sludge ash-based geopolymer with paper debris and modeling by
Automated machine learning algorithm 144
5.1 Introduction. . . 144
5.1.1 Liquified stabilized soil method . . . 144
5.1.2 Automated machine learning algorithm . . . 146
5.2 Materials . . . 148
5.3 Experiment procedures . . . 149
5.3.1 Flow test . . . 149
5.3.2 Bleeding rate test . . . 151
5.3.3 Unconfined compression test . . . 152
5.3.4 Drying-wetting test . . . 152
5.3.5 TPOT modeling . . . 152
5.4 Results and discussions . . . 154
5.4.1 Initial curing time . . . 154
5.4.2 Paper debris . . . 160 5.4.3 TPOT modeling . . . 169 5.5 Conclusions . . . 173 Chapter 6 Conclusion 177 6.1 Conclusions . . . 177 6.2 Contributions to knowledge . . . 178 6.2 Recommendations . . . 179 Appendix-A 180 List of Publications 196 Acknowledgements 198
List of Tables
1-1 Characteristics and factors hypothesized to have relation with soil
strength [16] . . . 11
1-2 Empirical equations to predict, compression index (Cc), swelling index (Cs) . . . 12
1-3 Empirical equations to estimate undrained shear strength . . . 13
2-1 Physical and mechanical properties of imitation sludge . . . 31
2-2 Chemical composition of silt and Kasaoka clay . . . 31
2-3 Chemical composition of Fly ash (XRF) . . . 33
2-4 Water absorption of different size paper debris . . . 36
2-5 Mixing condition . . . 42
2-6 Mixing condition checking effect of fiber . . . 53
2-7 Procedure of cyclic test for drying and wetting . . . 53
2-8 Soundness of specimens . . . 53
3-1 Mixing condition of the specimens without initial curing time (Sludge-dewatering) . . . 73
3-2 Mixing condition of the specimens with initial curing time (Sludge-conditioning) . . . 73
4-1 Physical and mechanical properties of all 5 kind of imitation sludge . . 106
4-2 Relationship between soil texture and permeability . . . 107
4-3 Average permeability for different soil textures . . . 107
4-4 Relationship between soil structure and permeability . . . 108
4-5 ƞT/ ƞ15 coefficient. . . 111
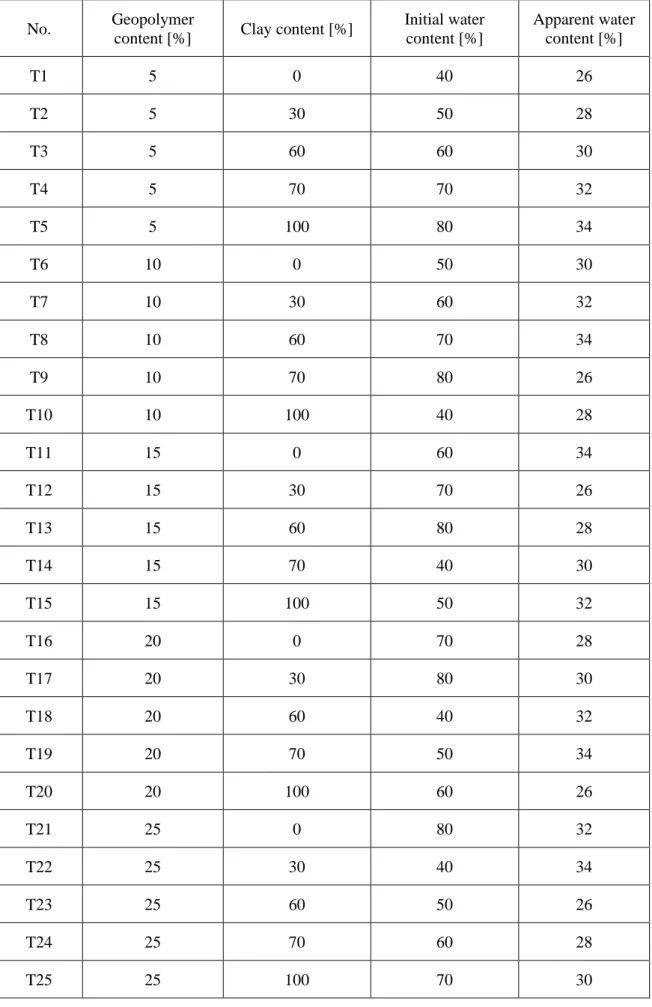
4-6 Mixture design with results of failure strength, failure strain and moist density . . . 112
4-7 The introduced levels for each factor in experiment design . . . 113
4-9 Response Table for Signal to Noise Ratio of Failure strain . . . 115
4-10 Response Table for Signal to Noise Ratio of Moist density . . . 116
4-11 Response Table for Signal to Noise Ratio of Permeability . . . 117
4-12 Degrees of freedom . . . 120 4-13 Sum of Squares . . . 120 4-14 Mean squares . . . 121 4-15 F-value . . . 121 4-16 Metrics . . . 121 4-17 Equation annotation . . . 121
4-18 Linear equation summary of failure strength with entire features . . . . 122
4-19 ANOVA of failure strength of linear equation with entire features . . . . 122
4-20 Linear equation summary of failure strength with eliminating redundant features . . . 122
4-21 Quadratic equation summary of failure strength with entire features . . 124
4-22 ANOVA of failure strength of quadratic equation with entire features . . 124
4-23 Quadratic equation summary of failure strength with eliminating redundant features . . . 125
4-24 Linear equation summary of failure strain with entire features . . . 126
4-25 ANOVA of failure strain of linear equation with entire features . . . 126
4-26 Linear equation summary of failure strain with eliminating redundant features . . . 127
4-27 Quadratic equation summary of failure strain with entire features . . . . 128
4-28 ANOVA of failure strain of quadratic equation with entire features . . . 128
4-29 Quadratic equation summary of failure strain with eliminating redundant features . . . 129
4-30 Linear equation summary of moist density with entire features . . . 131
4-31 ANOVA of moist density of linear equation with entire features . . . 131
4-32 Linear equation summary of moist density with eliminating redundant features . . . 132
4-33 Quadratic equation summary of moist density with entire features . . . 133
4-35 Quadratic equation summary of moist density with eliminating
redundant features . . . 134
4-36 Linear equation summary of permeability with entire features . . . 136
4-37 ANOVA of permeability of linear equation with entire features . . . 136
4-38 Linear equation summary of permeability with eliminating redundant
features . . . 137
4-39 Quadratic equation summary of permeability with entire features . . . 138
4-40 ANOVA of permeability of quadratic equation with entire features . . . 138
4-41 Quadratic equation summary of permeability with eliminating redundant
features . . . 139
5-1 Physical and mechanical properties of imitation sludge . . . 149
5-2 Genetic programming settings. . . 154
5-3 Mixing condition of LSS for checking the effect of initial curing time . . 155
List of Figures
1-1 Trigger of landslide disaster and numbers of occurrence of each landslide
type [1] . . . 3
1-2 Landslide disaster distribution along national highways [1] . . . 3
1-3 Landslide disasters occurrence of each region [3] . . . 4
1-4 Global cement and fossil energy production to 2016 . . . 4
1-5 CO2 emissions from fossil-fuel use and cement production in the top 5 emitting countries and the EU [9] . . . 6
1-6 The impact of coal ash ponds on water resources [10] . . . 8
1-7 Schematic outline of the reaction processes involved in geopolymerisation [28] . . . 16
1-8 Polymeric structures from polymerisation of monomers [30] . . . 17
2-1 Principle of Fiber–Cement–Stabilized soil method . . . 26
2-2 Schematic of toe berm and landfill sliding along weak foundation layer . 28 2-3 Grain size distribution of the sludge . . . 29
2-4 Compaction curve of imitation sludge by Proctor test . . . 29
2-5 XRD of silt and clay . . . 30
2-6 SEM of silt and clay . . . 30
2-7 Imitation sludge (mixing Kasaoka clay and silt as mass of ratio 2:3 and 70% of moisture) . . . 31
2-8 Alkaline activator . . . 32
2-9 Fly ash . . . 33
2-10 Grain size distribution of Fly ash . . . 33
2-11 XRD analysis of Fly ash . . . 34
2-12 Sieve analysis . . . 34
2-13 Paper fragment . . . 35
2-15 Mixing machine . . . 38
2-16 Steel cylindrical mold and hammer . . . 38
2-17 Yamato DKN 810 Convection Oven . . . 39
2-18 Outline of unconfined compressive test . . . 40
2-19 Relationship between Na2SiO3: NaOH ratio, failure strength and failure strain of modified sludge (condition A) . . . 44
2-20 Solubility of sodium hydroxide in gram per 100 g H2O versus temperature (°C) . . . 45
2-21 Specimens with adding paper debris after unconfined compression test 45 2-22 Relationship between geopolymer content, failure strength and failure strain of modified sludge (condition B) . . . 47
2-23 Relationship between geopolymer content, failure strength and failure strain of modified sludge (condition C) . . . 48
2-24 Relationship between geopolymer content, failure strength and failure strain of modified sludge (condition D) . . . 49
2-25 Specimens without adding paper fragment (ratio 7:3) after and before testing . . . 50
2-26 Stress – strain curves of modified sludge 12 hours curing . . . 50
2-27 Stress – strain curves of modified sludge 18 hours curing . . . 51
2-28 Procedure of Drying – Wetting cyclic test . . . 54
2-29 Development of failure strength of modified sludge on curing at 20oC . 56 2-30 Development of failure strain of modified sludge on curing at 20oC . . . 56
2-31 Relationship between failure strength and failure strength with different amount of paper debris . . . 56
2-32 The relationship between failure strength and modulus of elastic with different amount of paper debris . . . 57
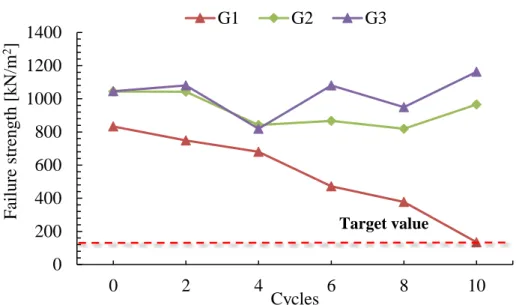
2-33 Soundness of specimens with cycle number (modified sludge after curing 28 days) . . . 59
2-34 Soundness of specimens with cycle number (modified sludge after curing 42 days) . . . 59
2-35 Relationship between cycle number and failure strength of modified sludge (after curing 28 days) . . . 60
2-36 Relationship between cycle number and failure strain of modified sludge (after curing 28 days) . . . 61
2-37 Relationship between cycle number and failure strength of modified
sludge (after curing 42 days) . . . 62
2-38 Relationship between cycle number and failure strain of modified sludge
(after curing 42 days) . . . 62
2-39 The relationship between qu(w-d)/qu0 and number cycle of W-D of
modified sludge (after curing 28 days) . . . 63
2-40 The relationship between qu(w-d)/qu0 and number cycle of W-D of
modified sludge (after curing 42 days) . . . 64
2-41 Specimens after 10th cycle (After curing 28 days) . . . 64
2-42 Specimens after 10th cycle (After curing 42 days) . . . 65
3-1 Flow chart of experiment procedure of dewatering and conditioning
method . . . 74
3-2 The relationship between moisture content and initial water content of
modified sludge with different geopolymer content (Sludge-Dewatering) 76
3-3 The relationship between moisture content and elapsed time of modified
sludge with different geopolymer content (Sludge-conditioning) . . . . 78
3-4 Relationship between moisture content and bulk density of modified
sludge with different concentration of geopolymer (Sludge-dewatering) 79
3-5 The relationship between bulk density and moisture content of modified
sludge with different geopolymer content (Sludge conditioning) . . . . 81
3-6 Comparison of the optimum condition of bulk density between sludge
dewatering and sludge conditioning process . . . 81
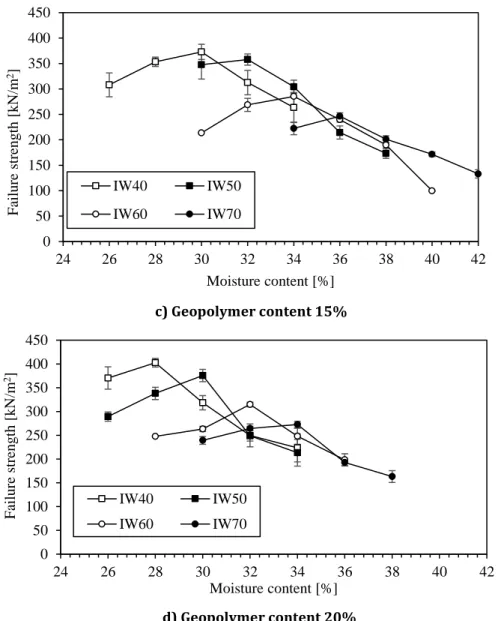
3-7 Relationship between moisture content and failure strength of modified
sludge with different concentration of geopolymer (Sludge dewatering) . 84
3-8 The relationship between failure strength and moisture content of
modified sludge with different geopolymer content (Sludge conditioning)
. . . 85
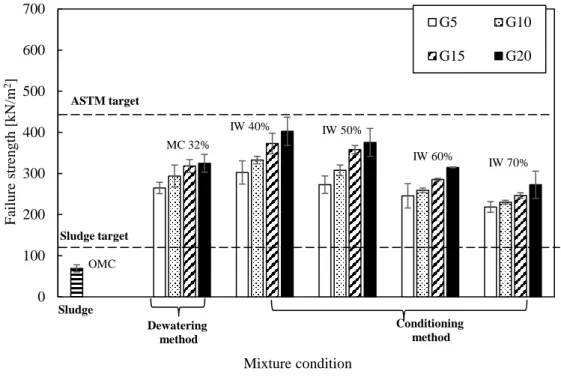
3-9 Comparison of the optimum condition of failure strength between sludge
dewatering and sludge conditioning process . . . 87
3-10 Relationship between moisture content and failure strain of modified
sludge with different concentration of geopolymer (Sludge dewatering) . 88
3-11 Relationship between moisture content and failure strain of modified
sludge with different concentration of geopolymer (Sludge conditioning) 90
3-12 Comparison of the optimum condition of failure strain between sludge
3-13 XRD result of modified sludge with 5% of geopolymer in both methods. After 3 days: (a) G5MC32, (c) G5IW40, (e) G5IW70. After 28 days: (b)
G5MC32, (d) G5IW40, (f) G5IW70 . . . 92
3-14 XRD result of modified sludge with 20% of geopolymer in both methods. After 3 days: (g) G20MC32, (i) G20IW40, (k) G20IW70. After 28 days: (h) G20MC32, (j) G20IW40, (l) G20IW70 . . . 92
3-15 SEM images of modified sludge by with optimum condition. Conditioning method: (a) G5MC32, (b) G20MC32. Dewatering method: (c) G5IW40, (d) G20IW40, (e) G5IW70, (f) G20IW70 (after 3 days curing) . . . 94
3-16 SEM images of modified sludge by with optimum condition. Conditioning method: (g) G5MC32, (h) G20MC32. Dewatering method: (i) G5IW40, (j) G20IW40, (k) G5IW70, (l) G20IW70 (after 28 days curing) . . . 95
4-1 Clay mineral structure [6] . . . 101
4-2 Isomorph substitution . . . 103
4-3 Double layers [11] . . . 103
4-4 Taguchi optimization function . . . 105
4-5 Sketch of water go through soil structure . . . 109
4-6 Paths of seepage through embankment dams [16] . . . 109
4-7 Apparatus of permeability test . . . 109
4-8 Permeability testing procedure . . . 111
4-9 Failure strength of geopolymer modified sludge specimens according to experiment mixture design . . . 114
4-10 Failure strain of geopolymer modified sludge specimens according to experiment mixture design . . . 115
4-11 Moist density of geopolymer modified sludge specimens according to experiment mixture design . . . 116
4-12 Permeability of geopolymer modified sludge specimens according to experiment mixture design . . . 117
4-13 The distribution of residual of predicted value of failure strength by linear model . . . 123
4-14 The distribution of residual of predicted value of failure strength by quadratic model . . . 126
4-15 The distribution of residual of predicted value of failure strain by linear model . . . 128
4-16 The distribution of residual of predicted value of failure strain by
quadratic model . . . 130
4-17 The distribution of residual of predicted value of moist density by linear model . . . 133
4-18 The distribution of residual of predicted value of moist density by quadratic model . . . 135
4-19 The distribution of residual of predicted value of permeability by linear model . . . 137
4-20 The distribution of residual of predicted value of permeability by quadratic model . . . 140
5-1 Comparison of grid search and random search for minimizing a function [8] . . . 147
5-2 XRD of paper sludge ash . . . 149
5-3 Flow test apparatus and measurement . . . 151
5-4 Bleeding test apparatus and measurement . . . 152
5-5 The light grey area indicates the steps in the pipeline that are automated by TPOT . . . 153
5-6 An example tree-based machine learning pipeline . . . 154
5-7 Specimen of PSA based geopolymer for LSS method without initial curing time . . . 156
5-8 The effect of initial curing time on the Flow value of liquefied stabilized soil by PSA based geopolymer without fiber (water content of sludge 100%) . . . 156
5-9 The effect of initial curing time on the Bleeding rate of liquefied stabilized soil by PSA based geopolymer without fiber (initial water content of sludge 100%) . . . 157
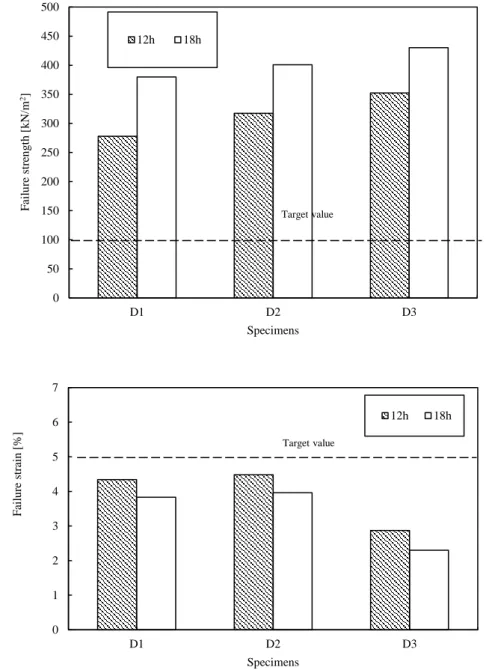
5-10 The effect of initial curing time on the Failure strength of liquefied stabilized soil by PSA based geopolymer without fiber (initial water content of sludge 100%) . . . 158
5-11 The effect of initial curing time on the Failure strain of liquefied stabilized soil by PSA based geopolymer without fiber (initial water content of sludge 100%) . . . 158
5-12 The specimens of liquefied stabilized soil by PSA based geopolymer with different initial curing time after 7 days curing (initial water content of sludge 100%, PSA 20%) . . . 159
5-14 The effect of paper debris on the bleeding rate of LSS . . . 161
5-15 The effect of paper debris on the failure strength of LSS . . . 162
5-16 The effect of paper debris on the failure strain of LSS . . . 162
5-17 Soundness of LSS with 1% of fiber . . . 164
5-18 Effect of durability test on failure strength and strain of LSS with 1% of fiber . . . 164
5-19 Soundness of LSS with 2% of fiber . . . 165
5-20 Effect of durability test on failure strength and strain of LSS with 2% of fiber PSA [%] =10,15,20 . . . 165
5-21 Soundness of LSS with 3% of fiber . . . 166
5-22 Effect of durability test on failure strength and strain of LSS with 3% of fiber . . . 166
5-23 Microscope images of LSS with different amount of fiber after curing 28 days . . . 168
5-24 Cross validation train score and test score of top 20 model of pipeline generated by TPOT . . . 170
5-25 The best pipeline model on cross validation train score and test score on failure strength and failure strain . . . 172
1.1 Problem definition
1.1.1 Landslide phenomenon
Landslides, as one of the major natural hazards, takes place each year and is responsible for enormous direct and indirect damages. Landslides, defined as the movement of a mass of rock, debris or earth down a slope, can be triggered by a variety of external stimuli, such as intense rainfall, earthquake, water level change, storm waves or rapid stream erosion that causes sudden drop in shear strength of slope-forming materials. In addition, as human urban expansion invaded to formerly uninhabited hillslope areas, artificial activities such as deforestation or excavation of slopes for road cuts and building sites, etc., have become important triggers for occurrence of landslide.
Japan is observed to suffer several disasters due to its natural topographic. Until the 1970s, the relationship between flood and the geomorphological condition was studied and the results were applied to hazard mapping. After the 1980s, landslide and debris flow, earthquake, and volcanic activity have become the major studies of the disaster prevention. Ministry of Land, Infrastructure, Transport and Tourism (MLIT) of Japan government collected 1,310 landslide events with road traffic suspension on the direct administrative highway of 20,000 kilometers from 1990 to 2004 [1, 2]. Most of the cases, the residual slides occurs mainly in gentle slopes with the slow movement caused by rainfall which accounts for more than 90% (Figure 1-1) [3]. Furthermore, Japan is known as a nation that suffered huge damage by earthquake and seismic activity, and these phenomena are worsen by a huge volume of sludge generated from
Chapter 1
landslide resulting in road blocking, suspension of supply lines (telecommunication, electricity, water, etc.).
The results from report [1] collected the occurrence of each landslide type shown in Figure 1-1. The disaster types were classified into rockfalls, surface failures, rock-mass failures, landslides, and debris flows. Besides, road surface anomalies include bank failure and cracks, subsidence and collapse of the road surface. Surface failures account for 81% (1,067 cases), much higher compared to others types. The next one is road surface anomalies which consist of 78 cases (6%), followed by rockfalls and debris flows, landslides and rock-mass failures with 66 cases (5%), 21 cases (2%), and 12 cases (1%) respectively. The disaster distribution with each of geology based on slope disaster database is shown in Figure 1-2. It clearly indicates that basement rock, slope angle and rainfall are factors in slide formation and distribution of landslide. Furthermore, snow melting is also an important factor leading to the landslide that indicated by Aoyama, et al and Maruyama, et al [4, 5]. From Feb- March 2006, the huge damage after a heavy snowfall was recorded in many areas of Japan [6]. But the limit of the research is the availability on snowmelt induced landslide hazard. Based on the disaster occurrences and frequencies of each region in Figure 1-3, Kyushu region was observed to have the biggest number of cases, 645 cases, which constituted half of the disasters, followed by Hokkaido (nearly 200 cases) and Chubu (nearly 100 cases).
In many countries in the world, landslides have caused substantial numbers of casualties and huge economic losses in mountainous areas of the world. The most disastrous landslides have claimed as many as 100,000 lives. In addition to human loss, slope failure destroys or damages residential and industrial facilities, as well as agricultural and forest lands, and affect the quality of water in river and streams. Man’s activities in disturbing large volumes of geologic materials in the construction of buildings, transportation route, mines, quarries and communication systems have been major factors in the recent increase in damaging slope failures. In the United States, landslides cause an estimate of US$1–2 billion in economic losses and about 25– 50 deaths annually, thus exceeding the average losses due to earthquakes [2]. Li and Wang [7] conservatively estimated that the number of deaths caused by landslides in China totaled more than 5000 during 1951-1989 period, resulting in an average of more than 125 deaths annually, and annual economic losses of about US$500 million.
Figure 1-3 Landslide disasters occurrence of each region [1]
In the future, this trend is expected to continue in the 21st century for the following reasons:
- The increase of urbanization and development in landslide-prone areas.
- The continue of deforestation of landslide-prone areas.
- Increased regional precipitation caused by changing climatic patterns.
A landslide has considerable impact, causing structural damage and loss of life. The landslide disaster occurs frequently within complex natural conditions and becomes major factors hindering the social and economic development in remote and less developed regions. In addition, most of the disaster recovery activities are being executed manually and mainly by human, while heavy machine cannot move to this area because of soft soil. In order to take advantage of machine in these areas, the improved sludge with sufficient strength for the heavy machine to move on is in high need.
1.1.2 Cement production
Cement has been used around the world since ancient times as binding material, and as a result, cement production became one of the largest sources of emission due
to the decomposition of carbonates, makes up approximately 2.4 percent of global CO2
production of cement accelerated rapidly worldwide, with current level of global production is equivalent to more than half a ton per person per year (Figure 1-4)[9].
There are two resources of cement production that result in emissions of CO2:
- The first aspect of emission is the chemical reaction involved in the
production of the main component of cement, clinker, in which calcium
carbonate (CaCO3) is calcinated in a rotary kiln to induce a series of complex
chemical reactions and CO2 by the addition of heat. These so-called “process”
emissions contribute approximately 5 % of total anthropogenic CO2 emissions
[10].
- The second source of emissions is the combustion of fossil fuels to generate
the significant energy required to heat the raw ingredients at temperatures of 600-900°C, and these “energy” emissions, including those from purchased electricity, could add a further 60 % on top of the process emissions [11]. Total emissions from these process (sometimes called “industry” or
“industrial process”) could contribute as much as 8 % of global CO2 emissions.
Figure 1-4 Global cement and fossil energy production to 2016 [10]
of slowing. Annually, cement production exhaust about 1,5 billion tons and content 7% of total greenhouse gas emission to the environment [9] (Figure 1-5). The production of cement requires more energy, of which drying feedstocks consume 2000 kJ/kg and losses energy approach nearly 1000 kJ/kg. Besides, the transportation of raw materials for manufactured cement also cause environmental pollution. Approximately 1,6 tons of mainly raw materials such as limestone, clay, marl, shale and other minerals are used to make one ton of cement [12].
Figure 1-5 CO2 emissions from fossil-fuel use and cement production in the top 5 emitting countries and the EU [9]
1.1.3 By-product of industries
For most of the developing countries, power is considered as an engine of growth and the focus of the whole economy. The amount of power has been increased in recent decades to meet the demand of increasing population. Most of the electricity, about 70% of the total is generated by coal-based thermal power plants [13]. High-grade quality coal is used by the metallurgical industry. However, coal supplied to the thermal power plant is in poor quality. Coal is the main source used as fuel energy is converted into useful heat energy in the thermal power plant which produces the huge environmental and health concerns. Dependence on coal for power generation is inevitable, although there have been continuous efforts for exploring its viable alternatives across the world.
Environmental pollution by the coal-based thermal power plants all over the world is cited to be one of the major sources of pollution affecting the environment in terms of land use, health hazards and air, soil, and water. Fly ash water also affects the scale structure because it is a direction in contact with water (Figure 1-6). Coal and coal combustion by-products, primarily fly ash, are sources of multiple contaminants to both aquatic and terrestrial systems, create both historic and present-day examples of ecological damage.
Fly ash is a high-volume material that poses hazardous risks for human health and the environment. While high-quality fly ash can be deemed usable for conventional concrete applications, low-quality ones are not considered for use because they do not comply with physical or chemical standards for fly ash. For example, a sulfur trioxide or unburned carbon contents more than 5-6% (by weight) unusable fly ash. The Clean Air Act has promoted scrubbing and clean-burning technologies to reduce nitrogen
oxide (NOx) and sulfur oxide (SOx) emissions from coal power plants. These new
technologies increase sulfur, unburned carbon, and other chemical components, which has resulted in an increase of fly ash that is unsuitable for use in concrete production. Low-quality fly ash, which is commonly disposed of landfills and containment ponds, is the cause of significant health damage and environmental hazard. These structures contain fly ash particles, which, due to their high concentrations of adsorbed heavy metals such as arsenic (As), cadmium (Cd), chromium (Cr), copper (Cu), selenium (Se), and strontium (Sr), can affect the health of nearby communities [11]. Bryan et al [12] demonstrated that adsorbed heavy metals in fly ash (e.g., chromium, nickel, selenium) are potential carcinogens. Studies have also shown that fly ash causes adverse health effects for birds and other wildlife that nest around coal ash ponds. Furthermore, coal ash spills or groundwater seepages have the potential to release high levels of heavy metals into the surrounding environment, and recovery can be costly.
Figure 1-6 The impact of coal ash ponds on water resources [10]
1.1.4 Fiber-cement-stabilized soil method and Geopolymer
Construction sludge, the waste sludge with extremely high-water content from development of construction site is generally discarded in disposal sites because of the difficulty in treatment. However, the capacity of the final disposal sites is limited, and , since the transportation cost of this sludge is expensive, it is often thrown away illegally on the way to the final disposal sites.In result, the recycling rate of the construction sludge is extremely low. Therefore, the “Fiber-cement-stabilized soil method”, a recycling method for high water content mud by using paper debris (fragments of old newspaper) and cement was developed, to increase the recycling rate of construction sludge [14].
This method shows several advantages on modified soil: high failure strength and failure strain, high durability for drying and wetting as well as high dynamic strength, high resistance for the earthquake. The method has been evaluated in both academic and real cases in Japan. By the end of March, 2014, it had been applied in 360 cases
with total of 530,000 m3 in Japan [15]. Figure 1-7 show photos of some projects which
a) Construction of Sewerage Pipe in Obanazawa City in Yamagata Prefecture
b) Construction of River Bank in Hamao Area in Fukushima Prefecture
c) Construction of Public Utility Conduit in Sendai City in Miyagi Prefecture Figure 1-7 Projects which applying Fiber-cement-stabilized soil method [10]
Nevertheless, Portland cement was predominantly used as adhesive in this method to improve the characteristic of sludge. Obviously it owns many advantages but also requires long time to reach to sufficient strength for heavy machines to move on the modified sludge. The cement industry is known as significant contributor
releasing greenhouse gasses into the atmosphere at mentioned before. Due to the exponential use of concrete, cement production has increased at a much higher speed
than atmospheric CO2 concentration, i.e. than all major CO2 emission caused by human
activities, such as energy and transportation. Thus, to overcome this issue, a new technology or a substitute materials of Portland cement should be innovated to lessen the adverse impact to environment.
Geopolymer Cement is a novel alternative cement to traditional Portland cement. The term “geopolymer” was created by J. Davidovits in 1979 to describe the chemical properties of inorganic polymers based on aluminosilicates. Geopolymer has been the subject of intense study because it is environmentally friendly cementing agents, with low energy consumption and low toxicity, is stable at high temperature as well as durable. Geopolymer presents cementitious properties and, therefore, has been great potential for use in the construction industry. Geopolymer can be synthesized from a variety of silica and alumina rich materials such as metakaolin, steel furnace slag and especially fly ash, a by-product of thermal power plan. If the fly ash can be used for synthesis the geopolymer, it is the good way to protect not only for the environment but also for human life.
Therefore, the utilization of geopolymer instead of Portland cement in cement-stabilized-soil method is promising for sustainable development. However, geopolymer has never been applied for Fiber-Cement-Stabilized soil method. In this research, the utilization of geopolymer proposed with fiber (paper fragment) is experimentally investigated to improve mechanical properties of soft soil with high water content generated in the landslide area.
1.2 Literature review
Soil acts as a sponge to take up and retain water. Movement of water into the soil is called infiltration, and the downward movement of water within the soil is called percolation, permeability or hydraulic conductivity. Pore space in soil is the conduit that allows water to infiltrate and percolate. It also serves as the storage compartment for water. Soft soils have poor engineering properties such as bearing capacity and exhibit large settlement. The term “soft soil“ is defined as clay or silty clay soil which is geologically young, and reached to an equilibrium under its own weight but has not
undergone significant secondary or delayed consolidation since its formation [16]. It is characterized by the fact that it is just capable of carrying the overburden weight of the soil, and any additional load will result in relatively large deformation. Soils which have not completed the consolidation under their own weight are also included in this group.
The index parameters are a measure of the physical properties and behavior of a soil. They are generally governed to a large extent by its geological history, mineralogical composition, the amount of clay fraction, the structure and distribution of the grains, texture of the grains. Index parameters are mainly used for the purpose of identification, description, and classification of soils. Moreover, since their determination in the laboratory is relatively simple, and share the same factors that influence the strength (Table 1-1) and compression properties, they are usually employed in empirical correlation to predict compression, strength and other parameters. For example, the compression index can be estimated from liquid limit (Table 1-2), the undrained shear strength of clay from liquidity index or plasticity index (Table 1-3). The characteristic groups of the index properties and the corresponding index parameters are listed in (Table 1-1).
Table 1-1 Characteristics and factors hypothesized to have relation with soil strength [16]
Characteristics Factors considered having a relationship with soil strength
Grain size Grain size distribution, maximum grain size, mean grain size, the coefficient of uniformity, the shape of particles, the content of fine fraction.
Density Void ratio, relative density, dry density, specific gravity.
Plasticity Liquid limit, plastic limit, shrinkage limit, plasticity index, consistency index, liquidity index.
Moisture Natural moisture content and degree of saturation.
Texture Type, proportion, and structure of minerals and organic matter
Stress history Age of deposition, number and magnitude of stress change experience, weathering, and physiochemical effects
Table 1-2 Empirical equations to predict, compression index (Cc), swelling index (Cs)
Equation Reference Region of Applicability
Cc = 0.007 × (LL – 10) Skempton 1944 Remoulded clays Cc = 0.009 × (LL - 10) Terzaghi and Peck 1967
Bowles 1984
Normally consolidated, moderately Cc = 0.007 × (LL - 7) Koppula 1981, Remoulded clays
Cc = 0.01 × w Bowles 1984 Chicago clays and Alberta Province in Canada Cc = 0.0115 × w Bowles 1984 Organic silts and clays Cc = 0.75 × (e - 0.50) Bowles 1984 Soils with low plasticity Cc = 0.0046× (LL - 9) Bowles 1984 Brazilian clays
Cc = Ip/74 Kulhawy and Mayne 1990 Data from different soils Cs = Ip/370 Kulhawy and Mayne 1990
Nishida 1956
Data from different soils Cc = 1.15 × (e - e0) Nishida 1956 All clays
Cc = 1.15 × (e - 0.35) Nishida 1956 Natural soils Cc = 0.54 × (e - 0.35) Kulhawy and Mayne 1990 Chicago clays and Alberta
Province in Canada
w = moisture content (%), LL = liquid limit (%), e = void ratio, e0 = initial ratio, Ip = plasticity index (%)
Rising costs associated with the use of high-quality materials have led to the demand for local soils to be used in geotechnical and highway construction. However, high water content and low workability of these soils pose difficulties for construction projects. Frequently, additives such as lime, cement, fly ash, lime-cement-fly ash
admixture, cement kiln dust, emulsified asphalt, Geofiber, and polymer stabilizers are added to improve their engineering properties. The choice and effectiveness of an additive highly depend on the type of soil and its field conditions. Nevertheless, knowledge of the mechanistic behavior of treated soil is equally important as selecting the stabilizer.
Table 1-3 Empirical equations to estimate undrained shear strength
Equation Reference Region of Applicability
Cu = 170×exp(-4.6×IL) [kPa] Wroth and Wood 1978 Remoulded clays
Cu = 1/ (IL - 0.21)2 [kPa] Mitchell 1993 From several clays (remolded
strength) Cu/δ´vc = 0.11 + 0.0037×Ip Skempton 1954, Bowles
1984
Normally consolidated soils, Ip > 10% Cu/δ´vc = 0.11 + 0.0037×log
Ip
Skempton 1957 Normally consolidated soil, Ip < 60% Cu/δ´vc = 0.08 + 0.55×Ip Larsson 1977 Scandinavian clays
Cu/δ´vc = 0.23 ± 0.04 Larsson 1980 Soft sedimentary clays,
Ip < 60% Cu/δ´vc = 0.33 Larsson 1980 Inorganic clays
Cu = undrained shear strength, δ´vc = effective consolidation pressure, Ip = plasticity index (%), IL = Liquidity index
The advantageous effects of cement on the performance of soils have been widely documented [17-20]. Cement treatment leads to improvement in the mechanical properties of soils. However, the findings of different researchers on the role of Portland cement on compacted properties as well as strength and modulus have not been entirely consistent. For example, Balmer [17] and Clough et al. [21] reported
cement treatment increased cohesion while internal friction angle remained constant. On the other hand, Uddin et al.[19] stated that internal friction angle increased significantly. Some studies have indicated that at very low cement contents, improvement in strength is generated from an increase in friction angle rather than cohesion [22]. Some researchers have also shown that cohesion increases with curing time while friction angle remains constant [23, 24].
Wissa et al. [24] reported that cement treated soils exhibit brittle types of failure at low confining pressures and a more plastic failure type at high confining pressures i.e., Mohr-Coulomb failure envelope for cement treated soils is curved. Several failure criteria, including Griffith crack theory and modified Griffith crack theory [18], have been studied to account for the strength behavior of soil. The brittle to the ductile transition of shear behavior of soils as a function of mean stress is the basis of the modern concept of the Critical State Soil Mechanics [25]. Schofield [25] has disputed that the Mohr-Coulomb criterion, popularized by Terzaghi and stimulating the developments of soil mechanics, is valid for a limited range of stress levels. He has argued that the strength of remolded soils (be it sand or clay) is governed by its critical state friction and particle interlocking. The use of friction and particle interlocking is the possible way to better interpret the strength of cement stabilized soils.
Geopolymer, one of the viable technologies, is currently receiving considerable attention in academic and industrial communities for its ability to produce fly ash based geopolymer material in several applications. The term “geopolymer” was created by J. Davidovits in 1979 to describe the chemical properties of inorganic polymers based on aluminosilicates. Geopolymer presents cementitious properties and, therefore, great potential for use in the construction industry. They can be formed using natural raw materials or industrial wastes from several sources, given the requirement that the wastes are rich in amorphous or semi-crystalline aluminosilicates or have passed through heat treatment, which turn them to be more reactive and suitable for alkaline activation. The alkaline activation is a chemical process that transforms amorphous, partially amorphous or metastable vitreous structures into a compacted cementitious material [26]. The production of 1 ton of
Geopolymeric cement generates 0.184 tons of CO2, from combustion carbon-fuel,
times less CO2 during manufacture than Portland cement. This simply means that, in newly industrializing countries, 5-6 times more cement for infrastructure and building
applications might be manufactured, for the same emission of greenhouse gas CO2.
Development means building infrastructures and houses, in short, cement and concrete. One of the criteria to judge the progress of any economic development is through the growth rate of infrastructures, which is linked to the cement production. Due to the exponential use of concrete, cement production has increased at a much
higher speed than atmospheric CO2 concentration, i.e. than all major CO2 emission
caused by human activities, such as energy and transportation [27].
The geopolymerization process involves a substantially fast chemical reaction under the alkaline condition on Si-Al minerals that result in a three-dimensional polymeric chain and ring structure consisting of Si-O-Al-O bonds, as follows:
Mn [-(SiO2)z-AlO2]n. wH2O
Where: M = the alkaline element or cation such as potassium, sodium or calcium n = the degree of polycondensation or polymerisation
z = 1,2,3 or higher
The exact mechanism of setting and hardening of the geopolymer material is not clear. However, most proposed mechanism consists the chemical reaction may comprise the following steps:
(1) Dissolution of Si and Al atoms from the source material through the action of hydroxide ions.
(2) Transportation or orientation or condensation of precursor ions into monomers.
(3) Setting or polycondensation/polymerisation of monomers into polymeric structures.
Figure 1-7 Schematic outline of the reaction processes involved in geopolymerisation [28]
Such frameworks are called polysialates, where sialate stands for the
silicon-oxoaluminate building unit. The sialate network consists of SiO4 and AlO4 tetrahedra
linked by sharing all oxygen atoms. Positive ions (Na+, K+, Ca2+, etc) must be presented
to balance the negative charge of Al in 4- fold coordination. Chains and rings may be formed and cross-linked together, always through a Sialate Si-O-Al bridge. Polysialates
are chain and ring polymers with Si4+ and Al3+ in 4-fold coordination with oxygen and
range from amorphous to semi-crystalline. The amorphous to semi-crystalline three-dimensional silico-aluminate structures were classified ‘geopolymer’ of the types [29].
Figure 1-8 Polymeric structures from polymerisation of monomers [30]
As shown in Figure 1-7, Geopolymerization process forms aluminosilicate frameworks. Sialate is an abbreviated form for alkali silicon-oxo-aluminate, the alkali being (Na, K, Li, Ca) and the term poly(sialate) covers all Geopolymer which contains at least one (Na, K, Li, Ca)(Si-O-Al), (Na, K, Li, Ca)-sialate unit. Sodalite frameworks and kalsilite frameworks have structural molecules Na-(-Si-O-Al-O-) and K-(-Si-O-Al-O-) are chain and ring polymers and the result of the polycondensation of the monomer,
orthosialate (OH)3-Si-O-Al-(OH)3. Sanidine frameworks, K-(-Si-O-Al-O-Si-O-Si-O-) may
The sialate unit may be at the beginning, in the middle or at the end of the sequence. There are six isomorphs: 2 linear, 2 branched and 2 cycles. Leucite frameworks with structural molecule K-(-Si-O-Al-O-Si-O-) may be considered as the condensation result
of orthosialate with ortho-silicic acid Si(OH)4. There are three isomorphs, a linear
(-Si-O-SiO-Al-O-), mono-siloxo-sialate and 3 cycles. Anorthite frameworks containing 2 sialate unit, Ca-(-Si-O-Al-O-Si-O-Al-O-) are ring polymers that are the result of the polycondensation of the monomer [30].
Previous studies [31-33] have investigated the strength and durability of clay fly ash Geopolymer as masonry bearing units. The durability against sulfate attack of clay fly ash Geopolymer is superior to that of clay cement; i.e., there is no major change in the microstructure and pH of clay fly ash Geopolymer when it is exposed to sulfate solutions. Even though Neramitkornburi et al. [34] has shown that the strength of WTS–FA geopolymer meets the requirement specified by TIS, the durability of this material has not been examined. This material generally encounters the change of weather during wet (rainy) and dry (summer) seasons. The wetting and drying (w–d) cycles result in tension and surface cracks, which reduces the strength of the material. The investigation of the service life of the WTS–FA geopolymer via a w–d cycle test is significant and is the focus of this research.
1.3 Structure of the dissertation
The dissertation consists of five chapters.Chapter 1 is an introductory chapter outlining the problem statement, the objectives of the research work, and the scope of the study. Furthermore, literature review and theoretical principles of some of the main articles, studies and researches that were needed for this research are mentioned in this chapter.
Chapter 2 describes the effect of ratio alkaline solution, curing time and paper debris to geopolymer stabilized sludge is shown. The characteristic and the durability performance of modified sludge were investigated by Unconfined compression test and Drying and Wetting cyclic test. The influence of apparent water content to shorten the curing time was also investigated in this chapter. The various apparent water content after mixing sludge with geopolymer and paper debris was examined to classify the possibility of shortening the curing time of geopolymer stabilized sludge.
Chapter 3 compares the efficiency of two methods sludge conditioning and sludge dewatering. Test results indicated that the initial curing time has the potential for improving failure strain and strength of modified sludge with the specific condition of soft soil. The optimum moisture content of geopolymer modified sludge has strong influence on the amount of geopolymer content and initial water content of the sludge. Chapter 4 evaluates the effect of different kind of sludge on the reaction of geopolymer to achieve the desired strength and strain. The Taguchi method was used to determine the most important factor that affects several properties of geopolymer modified sludge by minimizing the effects of variation, but without eliminating the cause. The results indicate that the geopolymer content, clay content in sludge, initial water content and moisture content play a unique role in different properties of modified sludge.
Chapter 5 proposes the different application of geopolymer, Liquefied Stabilized Soil method. The mainly purpose of this chapter presents the utilization of Paper sludge ash (PSA)-based geopolymer to improve the soft soil by LSS method with paper debris fiber. The results show that PSA can solve the drawback of normal geopolymer on strength development in high-amount-of-water sludge. The application of state-of-the-art machine learning models show the potential on prediction the strength performance of LSS with consideration of many meaningful feature variables.
References
[1] Kurahashi, T., Yajima, Y., and Sasaki, Y. "Landslide disasters and hazard maps
along national highways in japan". in The 2nd East Asia Landslides Symposium. Korea: Geology Research Team, Material and Geotechnical Div., Public Works Research Institute, Tsukuba, 2008.
[2] Schuster, R. L. and Fleming, R. W., "Economic Losses and Fatalities Due to
Landslides". Bulletin of the Association of Engineering Geologists, XXIII(1), p. 11-28, 1986.
[3] K., S. "The geotechnical classification of landslides". in Proceedings of IV
International Conference and Field Workshop on Landslides. Tokyo, 1985.
[4] Aoyama, K., Nakamata, S., and Ogawa, S., "Consideration on the Relations
between Landslide and Snow in Niigata Prefecture". Journal of Japan Landslide Society 21(3), p. 11-16, 1984.
[5] Maruyama, K. and Takeshi, S., "Simply presumption equation of daily snow melt
infiltration to ground level for snowfall regional landslide mitigation". Journal of Japan Landslide Society 41(4), p. 85-90, 2004.
[6] Sato, A., "Heavy snowfall disaster in the winter of 2005–2006". Journal of Japan
Natural Disaster Science, 25, p. 71–81, 2006.
[7] Shumin, L. T. W., "Landslide hazards and their mitigation in China". 1992,
Beijing: Science Press.
[8] Gibbs, M. J., Soyka, P., and Conneely, D., "CO2 emissions from cement production".
National Greenhouse Gas Inventories, p. 175-182, 2001.
[9] Mohr, S. H., Wang, J., Ellem, G., Ward, J., and Giurco, D., "Projection of world fossil
fuels by country". Fuel, 141, p. 120-135, 2015.
[10] Andrew, R. M., "Global CO2 emissions from cement production". Earth System
Science Data, 10(1), p. 195-217, 2018.
[11] IEA. "Energy Technology Perspectives 2016: Towards Sustainable Urban Energy Systems". in International Energy Agency. Paris, 2016.
[12] Lawrence, C. D., "The Production of Low-Energy Cements". p. 421-470, 1998. [13] Krishna Gopal Ghosh, K. M. a. S. S., "Fly ash of thermal power plants: Review of
the problems and management options with special reference to the bakreshwar thermal power plant, eastern india". International Journal of Geology, Earth & Environmental Sciences, 5(2), p. 74-91, 2015.
[14] Satomi, T., Kuribara, H., and Takahashi, H., "Evaluation of Failure Strength Property and Permeability of Fiber-Cement-Stabilized Soil Made of Tsunami Sludge". Jounal of JSEM, 14(Special Issue), p. s303-s308, 2014.
[15] Kowalski, T. E. and Starry, D. W. "Modern soil stabilization techniques". in Annual conference of the Transportation Association of Canada. 2007.
[16] Kenneth B. Andromalos, Y. A., "Material properties of soft soils". Excavations and Foundations in Soft Soils. 2006: Springer-Verlag.
[17] Balmer, G. G., "Shear strength and elastic properties of soil-cement mixture under triaxial loading". Portland Cement Association Research and Development Laboratories, 1958.
[18] Mitchell, J. K., "The properties of Cement-stabilized soils". Proceeding of Residential Workshop on Materials and Methods For Low Cost Road, Rail, and Reclamation Works, p. 365 - 404, 1976.
[19] Uddin, K., Balasubramaniam, A. S., and Bergardo, D. T. , "Engineering behaviors of cement-treated Bangkok soft clay". Geotechnical Engineering Journal, 28(1), p. 89-119, 1997.
[20] Lo, S. R. and Wardani, S. P., "Strength and dilatancy of a silt stabilized by a cement and fly ash mixture". Canadian Geotechnical Journal, 39(1), p. 77-89, 2002.
[21] Clough, G. W., Sitar, N., Bachus, R. C., and Shafii-Rad, N. , "Cemented sands under static loading". Journal of The Geotechnical Engineering Division, 107(GT6), p. 799-817, 1981.
[22] Rocha, M., Folque, J., and Esteves, "The application of cement stabilized soils in the construction of earth dams". Fifth International Conference on Soil Mechanics and Foundation Engineering, p. 99-108, 1961.
[23] Nash, J. K. T. L., Jardine, F. M., and Humphrey, J. D., , "The economic and physical feasibility of soil-cement dams.". Proceedings of the Sixth International Conference on Soil Mechanics and Foundation Engineering, 2, p. 517-521, 1965. [24] Wissa, A. E. Z., Ladd, C. C., and Lambe, T. W. , "Effective stress-strength parameters of stabilized soils". Proceedings of the Sixth International Conference on Soil Mechanics and Foundation Engineering, p. 80-89, 1965. [25] Muhunthan, B. a. S., A. N. , Liquefaction and dam failure, in ASCE Geotechnical
Special Publication. 2000, Slope Stability 2000: GeoDenver Conference. p. 266-280.
[26] A. Palomo, M. W. G., M.T. Blanco, "Alkali-activated fly ashes: A cement for the future". Cement and Concrete Research, 29, p. 1323–1329, 1999.
[27] Davidovits, J., Environmentally Driven Geopolymer Cement Applications., in Geopolymer 2002 Conference. 2002: Melbourne, Australia. p. 1-9.
[28] Davidovits, J., "Geopolymer Chemistry and Applications". 4 ed. 2015, Institut Géopolymère.
[29] van Deventer, J. S., Provis, J. L., Duxson, P., and Lukey, G. C., "Reaction mechanisms in the geopolymeric conversion of inorganic waste to useful products". J Hazard Mater, 139(3), p. 506-13, 2007.
[30] Davidovits, J., "Geopolymer Chemistry and Applications", ed. 2nd Edition. 2008, Institute Geopolymer, SaintQuentin, France.
[31] Suksiripattanapong, C., Horpibulsuk, S., Chanprasert, P., Sukmak, P., and Arulrajah, A., "Compressive strength development in fly ash geopolymer masonry units manufactured from water treatment sludge". Construction and Building Materials, 82, p. 20-30, 2015.
[32] Horpibulsuk, S., Suksiripattanapong, C., Samingthong, W., Rachan, R., and Arulrajah, A., "Durability against Wetting–Drying Cycles of Water Treatment Sludge–Fly Ash Geopolymer and Water Treatment Sludge–Cement and Silty Clay–Cement Systems". Journal of Materials in Civil Engineering, 28(1), p. 04015078, 2016.
[33] Sukmak, P., Horpibulsuk, S., Shen, S.-L., Chindaprasirt, P., and Suksiripattanapong, C., "Factors influencing strength development in clay–fly ash geopolymer". Construction and Building Materials, 47, p. 1125-1136, 2013. [34] Neramitkornburi, A., Horpibulsuk, S., Shen, S. L., Chinkulkijniwat, A., Arulrajah, A., and Disfani, M. M., "Durability against wetting–drying cycles of sustainable Lightweight Cellular Cemented construction material comprising clay and fly ash wastes". Construction and Building Materials, 77, p. 41-49, 2015.
2.1 Introduction
Geopolymer is a member of the inorganic polymers’ family. The chemical composition of geopolymer and natural zeolitic materials are similar, but the geopolymer’s microstructure is amorphous. The geopolymerisation process generates a considerably fast chemical reaction under alkaline conditions on Si-Al minerals, resulting in three-dimensional polymeric chains in which consist of Si-O-Al-O bonds. Generally, there are two main components to synthesis geopolymers: the source materials and the alkaline liquids.
Source materials is the materials rich in silicon (Si), aluminum (Al), and chemical compositions such as: kaolinite, clays… (natural minerals) or fly ash, silica fume, slag, rice-husk ash, red mud... (byproduct materials) [1]. Among of them, the resemblance of fly ash to natural aluminosilicate materials (given the presence of Si and Al in the ash) has motivated the utilization of geopolymerisation as a feasible technological solution in making special cement. Nowadays, most of the globally obtainable globally fly ash is low-calcium ASTM Class F formed as a by-product of burning anthracite or bituminous coal. Although coal burning power plants are considered to be environmentally unfriendly, the expansion in the amount of power generated from these plants is unstoppable, mainly due to the huge reserve of good
Chapter 2
Effect of ratio of alkaline solution,
paper fragment, curing time, and
geopolymer content on characteristic
of stabilized sludge
quality coal available worldwide and the low cost of the coal-power. As consequences, a huge quantity of fly ash is discharged every year.
Alkaline activation is a chemical process in which a powdery aluminosilicate such as a fly ash is mixed with an alkaline activator to produce a paste capable of setting and then is hardened within a reasonably short period of time. The strength shrinkage, and the acid and fire resistance capability will then depend on the nature of the aluminosilicate used and the activation process variables included. The first aspect to be emphasized in the general process of alkali activation is related to the variability of the kinetics and the governing mechanisms used to describe the mentioned process. Actually, two different models of alkali activation could be established, both corresponding to two very different conditions of the starting situation. A very well-known example of the first model is represented by the activation of blast furnace slags with a mild alkaline solution. With respect to this case, the reader is reminded that the mechanisms controlling the alkali hydration of a slag correspond to a complex process that is composed of several steps (including the initial destruction of the slag and a later polycondensation of the reaction products); and that the knowledge of the nature of these products has been the objective of many investigations, despite the presence of some controversies. In many cases, most of the authors agree in considering C-S-H gel as the main of reaction product [2-4]. On the other hand. the second model of alkali activation has been studied much less than the former, in spite of the fact that some investigations concerning this subject have been already published since the 1960s [5]. Alkaline activation of metakaolin can be taken as an example. Similar schemes have been proposed for modeling the formation processes of zeolites and zeolite precursors. Among the elements establishing the similarities between the zeolite formation process and the alkali activation of metakaolin, the following can be mentioned: Concentration of chemical species, specifically [OH]2 (critical factor in the synthesis of both types of material); temperature and time of curing; type of alkaline element; chemical composition of the reactant bulk; etc.
Taking into consideration of different ratio of alkaline solution, the compressive strength of geopolymer is varied. From all these parallelisms, the data collected and our own experience, we have concluded that the amorphous polymer produced in the
alkaline activation of fly ash is a zeolitic precursor. In the nutshell, the two main differences characterizing two models of alkali activation are:
• The composition of the material to be activated. Essentially, Si and Ca in the first case, while Si and Al dominate the second one.
• The concentration of the activator: low to mild for the first model and high for the second.
The most used alkaline liquid activator is a mixture of sodium or potassium
hydroxide (NaOH, KOH) with sodium hydroxide (nSiO2Na2O) or potassium hydroxide
(nSiO2K2O). The mechanical strength increases when the concentration of the
activator rises [6]. The concentration of the NaOH solution can vary from 8 to 16 M [7]. Using a NaOH solution with a concentration out of this range leads to less mechanical
strength. An alkaline activator of both the NaOH solution and the Na2SiO3 provides
better strength than an activator of only NaOH. The Na2SiO3 favors the polymerization
process, leading to a reaction product with more Si and more mechanical strength. The
mixing ratio of Na2SiO3/ NaOH seems to play a crucial role in the strength development
of the geopolymer. For the high-calcium fly ash, Class C, the optimum ratio of Na2SiO3/
NaOH to produce a high strength geopolymer is in the range of 0.67 - 1.00 [8]. From the chemical standpoint alkali activation of fly ash is a process that differs widely from Portland cement hydration but it is very similar to the chemistry involved in the synthesis of large groups of zeolites. The main reacting product in the alkali activation of fly ash is alkaline aluminosilicate gel; that is to say a precursor of certain crystalline zeolite species [7]. In the case of stabilized soft soil with high moisture, the role of the alkaline ratio solution is preferably important in maintaining the dissolution of aluminosilicate raw materials. Consequently, the alkaline activation of fly ash is in great interest in the context of new and environmentally friendly binders with properties similar to or that improve on the characteristics of conventional materials. In this chapter, the investigation of the ratio of the alkaline solution has been studied.
As mentioned above, the new recycling method was developed for high water content mud such as construction sludge by using paper debris (fragments of old newspaper) and cement to increase the recycling rate of construction sludge [9]. This method is called “Fiber-cement-stabilized soil method (FCSS)”. Modified-soils created from this method has several features such as high failure strength and failure strain,
high durability for drying and wetting as well as high dynamic strength. But, as this method uses the conventional cement, the high embodied energy binder. If geopolymers can be used instead of cement, this will be a great advantage because of their durability and environmentally friendly materials. However, the application of geopolymers for weak soil improvement is not examined yet. Therefore, a new method using Geopolymer is proposed. The principle of method is described in Figure 2-1.
1. The high-water content causes soil particles to move freely in the water as “fluid” in Figure 2-1 (a).
2. When paper debris is added to the sludge, it absorbs the water and decreases the superficial water content in the sludge as shown in Figure 2-1 (b).
3. Finally, geopolymer (mixture of fly ash and alkaline solution) is added and blended with the sludge. Then, the geo-polycondensation occurs and the strength of the modified soil intensifies as shown in Figure 2-1 (c).
Figure 2-1 Principle of Fiber–Geopolymer–Stabilized soil method
Paper debris have two main roles in this method. Firstly, paper debris will improve the failure strain as well as the durability of modified sludge. This property is essential for the application of the sludge in disaster site area. The second, paper debris with high water absorptive capacity (Appendix A) can reduce the apparent soil water content after mixing with geopolymer and sludge. Apparent soil water content is defined as the total amount of water left after being absorbed by paper divided by total
(a) (b) (c) Water Sludge particles Paper debris Fly ash Alkaline solution
mass of solid phase in the mixture. In geopolymer process, moisture or water has been claimed no other role in the formation of hardened geopolymer paste apart from providing the workability and necessary reaction medium. Although the effect of water were mentioned in some papers [10-12], the discussion and conclusion were insufficient. Water takes part in the dissolution, hydrolysis and polycondensation reactions during geopolymer synthesis [13, 14]. It provides the medium for the
dissolution of aluminosilicates and the transfer of various ions, hydrolysis of Al3+ and
Si4+ compounds and polycondensation of different aluminate- and silicate-hydroxyl
species. As a result, water has great effect on the geopolymer formation, the structure of the geopolymer gels and properties of the products. It has been generally confirmed that heat treatment is necessary for producing fly ash geopolymer concrete. This is considered to be a drawback affecting its manufacture and feasibility.
This chapter describes the results of the effect of ratio of alkaline solution, paper debris, geopolymer content and curing time on geopolymer stabilized sludge curing at
ambient temperature (20oC). The investigation was conduct by 2 experiments:
Unconfined Compression Test and durability Drying and Wetting Cyclic Test.
2.2 Materials
Three types of materials were used in study: imitation sludge, alkaline solution, fly ash and paper fragment.
2.2.1 Imitation sludge
A landslide occurs when a proportion of the natural slope is unable to support its own weight. For example, the soil beneath a slippery surface can become heavier in weight after soaking up rainwater that results in sliding. A landslide is a downward or outward movement of soil, rock or vegetation, under the influence of gravity. This movement can occur in many ways. It can be a fall, topple, slide, spread or flow. The pace of the movement may range from steady to speedy. The incidence of soil moving may destroy property along its path and additionally causes human loss and livestock damage. Although landslide usually occurs at steep slopes, they may also take place in areas with low relief or slope gradient. After the landslide, a large amount of sludge
(soft soil) is generated at the toe of slope [15] (Figure 2-2). Soft soils are generally criticized as ‘problematic’ because of its poor resistance to deformation and low bearing capacity. Sludge poses high moisture content, low shear strength and high compressibility. Due to high water content characteristics, the sludge after dredging cannot directly be used or hardly be recycled due to high level of water inside. The majority of sludge is given intermediately dehydration treatment followed by direct landfill.
Figure 2-2 Schematic of toe berm and landfill sliding along weak foundation layer [15]
Ideally, using actual sludge in landslide area for this research is suggested. However, it is no practical to carry a large amount of actual sludge from the area to laboratory. Furthermore, actual sludge contains several materials and it is not suitable for systematic experiments. Therefore, the imitation sludge was used as alternative, with the components include Kasaoka clay (Kasanen Kogyo Company) and silt (Marunaka Shirato Company). It is crucial to calculate the mass ratio between clay and silt identical to the grain size distribution, physical and mechanical properties of actual sludge in disaster sites. Regarding this ratio, the particles size distribution of actual sludge which obtained in landslide areas in Japan was checked [16, 17]. Figure 2-3 shows the particle size distribution of actual sludge, reality soil 1 and reality soil 2 from Laser Particle size Analysis. The particles size distributions of reality soil 1, reality soil 2 and imitation sludge, as expected, are relatively the same. So that, the mass ratio 2:3 was chosen. The optimum water content to attain a maximum dry density of imitation sludge is 28,46% and was obtained from the compaction curve under Proctor energy
(Figure 2-4). The crystalline contents in clay and silt were identified by X-ray
diffractometer PANalytical Epsilon 5 with CuKα radiation at 20oC. Clay and silt contain
mullite, quartz, and zeolite as major crystalline phases (Figure 2-5) which agrees with the compositions shown in Table 2. The shape of silt and clay is round or flat which were obtained by Scanning Electron Microscope Hitachi SU8000 that shown in Figure 2-6
Figure 2-3 Grain size distribution of the sludge
Figure 2-4 Compaction curve of imitation sludge by Proctor test
0 10 20 30 40 50 60 70 80 90 100 0.1 1 10 100 1000 Cum ula tiv e finer v o lum e (%) Grain size (mm)
imitation soil reality soil 1 reality soil 2
1200 1250 1300 1350 1400 1450 1500 22 24 26 28 30 32 34 36 38 D ry d en sity ( k g /m 3) Water content (%) Sr=100 Sr=90 Sr=80 Sr=70 Imitation sludge


![Figure 2-30 Development of failure strain of modified sludge on curing at 20 o C 02004006008001000120014007142842Failure strength [kN/m2]](https://thumb-ap.123doks.com/thumbv2/123deta/5914008.1050559/73.892.134.762.439.1110/figure-development-failure-strain-modified-sludge-failure-strength.webp)