Evaluation Of Fluid Flow Field In Single Rock
Fracture During Frictional Sliding
著者
Nemoto K., Watanabe N., Tsuchiya N.
journal or
publication title
AIP Conference Proceedings
volume
987
page range
123-128
year
2008
URL
http://hdl.handle.net/10097/51687
Evaluation Of Fluid Flow Field In Single Rock Fracture
During Frictional Sliding
K. Nemoto, N. Watanabe, and N. Tsuchiya
Graduate School of Environmental Studies, Tohoku University, 6-6-20 Aramaki aza Aoba, Aoba-ku, Sendai, Japan.
Abstract. We report on results of fluid flow in a single fracture obtained from combination technique of physical
experiments and flow simulation for investigating effects of asperity degradation due to sliding of fracture on flow properties of a fracture. We conducted sliding experiments of a rock fracture using cylindrical granite specimens (60 mm in diameter, 140 mm in axial length) containing a single tensile fracture. Sliding along the fracture was made by controlling a loading piston at constant rate of 0.001 mm/s under constant confining pressure of 5 MPa. Sliding displacement was applied up to approximately 6 mm along the surfaces. During the sliding, fluid flow was made within the fracture by applying a constant fluid pressure differential of 0.1 MPa through boreholes of 3mm diameter drilled in the specimens. Fracture permeability was evaluated at every 0.5 mm in axial displacement by measuring the pressure differentials between inlet and outlet of the fluid and mass flow at the outlet. Flow field within the fracture is calculated with flow simulation in which based on the measured fracture permeabilities, which shows that major flow paths can significantly change with sliding even at the almost constant permeability during sliding. Our result suggests that the change in flow field with shearing may have important roles in material transport due to advection, which could affect physical strength of a fracture by water-rock interactions on fracture surfaces such as precipitation and/or dissolution.
Keywords: Fluid flow, rock fracture, Aperture distribution, Shear sliding, hydro-mechanical coupling, Combined
technique, Laboratory experiments, Flow simulations
PACS: 91.60.Np
INTRODUCTION
Fractures play significant roles in fluid migration within rock mass because of its high permeability compared with that of rock matrix. Hence, understanding of fluid flow properties in a fracture gives fundamental information on fluid migration in fractured media for practical application of the understanding to actual situations such as nuclear waste repositories, subsurface sequestrations, oil/gas and geothermal reservoirs.
Our previous studies relating fluid flow within single rough rock fractures with/without shear displacement (offset) have revealed that fluid flow field in a fracture shows heterogeneous, anisotropic paths, i.e., channeling and tortuous flow [Nemoto et al., 2006; 2007; Watanabe et al., 2006; 2007a; 2007b], which supports results from numerous number of researches on fluid flow within rough fractures [e.g., Tsang, 1984; Tsang and Neretnieks, 1998; Brown et al., 1998; Mitani et al., 2002].
In our studies, however, no effects of degradation on fracture surfaces due to shearing on fluid flow
under compressive stress have been considered even for normal stress conditions up to 90 MPa.
Previous studies showed that the degradation of fracture surfaces associated with shearing has significant effects not only on mechanical strength and behavior [e.g., Gentier et al., 2000; Lee et al., 2001; Grasselli et al., 2002] but also on its hydraulic properties [Boulon et al., 1993; Nguyen and Selvadurai, 1998]. Some experimental studies pointed out that fracture permeability during shear was significantly affected by both dilation, closure of fracture volume and infilling due to gouge generated with the shear [e.g., Lee et al., 2002]. According to these works, the degradation of fracture surfaces is expected to affect flow properties in rock fracture since it can cause changes in aperture volume within fractures.
In this paper, we present results of fluid flow field within a single fracture using a combined technique of physical experiment and numerical simulation. First, we show detail of fracture permeability measurements during fracture sliding. Next, we describe our combined technique of the permeability measurements and numerical flow simulation within a rock fracture. Then, results from the combined technique are shown,
and changes in aperture field and flow field in a fracture during sliding are discussed.
PERMEABILITY MEASUREMENTS
DURING SHEAR SLIDING OF SINGLE
ROCK FRACTURE
Experimental Apparatus
Figure 1 shows a schematic of our apparatus for permeability measurements of single rock fracture during shear sliding. Our apparatus consists of three systems, which are a pressure vessel, a confining pressure-applying system, and a direct fluid injection system into rock sample.
The pressure vessel admits the maximum confining pressure of 30 MPa. It has larger inner volume of 220 mm in diameter, 320 mm in depth, which allow use of larger sample.
The confining pressure-applying system contains a double plunger type mechanical pump and an accumulator of 10 L in capacity. The accumulator
compensates an increase in confining pressure due to movement of a piston rod into the vessel. We used water as pressure media.
The fluid injection system contains a mechanical pump, an accumulator of 1 L in capacity. The adjustable flow rate of the pump ranges from 0.001-9.999 mL/min. The maximum discharge pressure of the pump is 39 MPa.
We used Iidate granite (medium grain size of ca. 2mm) for test sample, which was shaped to be cylindrical of 60 [mm] in diameter and 140 [mm] in axial length in size. The rock sample contains a single tensile (mode 1) fracture with an inclination of 30˚ from the sample axis. 3 mm-diameter boreholes are made in both upper and lower split samples from the end faces through fracture surface, which allow fluid flowing through fracture during sliding.
We measured axial displacement of the rock sample associated with shearing of fracture using a submersible LVDT attached in the vicinity of the sample. This allows accurate measurements of deformation of the sample. We obtained shear displacement of a fracture by calculating component of the displacement along the fracture.
Experimental Condition And Procedure
A pair of split rock sample is jacketed using thermal shrink tubes with upper and lower end plugs (SUS). The assembled sample is placed at the bottom of the vessel. After setting the lid of the vessel, Pc is
applied up to 5 [MPa] by injecting water into the vessel at room temperature.
Constant pore pressure differential of 0.1 [MPa] is applied to the fracture in order to induce fluid flow within the fracture by injecting de-ionized water directly from the pore fluid inlet. The constant pressure differential was achieved by keeping fluid pressure at the inlet 0.1 MPa using the accumulator (capacity 1 L). The outlet was kept open to the air during the injection.
Then, the piston rod is controlled at constant velocity of 0.001 [mm/s] by a servo-controlled loading machine (Instron 8300, capacity 500 kN).
The piston movement is stopped every 0.5 mm in axial displacement, and permeability measurements are carried out. In each measurement, an amount of outflow is measured for 20 s in each measurement. Five samples are made at each stop. We calculated average value in five tests as a representative permeability at each measurement.
Five sliding tests were performed without taking the rock sample out of the vessel (Run #: E004, E005, E006, E007, and E008). Axial load and confining pressure were once unloaded between the run. As a
FIGURE 1. Schematic of apparatus for the sliding
experiments: 1. Load cell, 2. Piston rod, 3. Spherical sheet, 4. Upper end plug, 5. Granite sample, 6. lower end plug, 7. Pressure-proof LVDT, 8. Pressure vessel (30 MPa max.), 9. Pressure gauge for confining pressure (Pc), 10. Accumulator
for Pc (10L), 11. Check valves, 12. Double plunger pump
(Pc), 13. Stop valves, 14. Pressure gauge for fluid pressure at
the inlet (Pp_In), 15. Accumulator for the injected fluid
pressure (1L), 16. Double plunger pump (Pp_In), 17. Pressure
gauge for fluid pressure at the outlet (Pp_Out), 18. Mass flow
result, 30 permeability tests were conducted in total through the series of experiments. We referred the results from permeability test for in order to calculate flow field in a fracture during sliding.
COMBINED TECHNIQUE OF
PERMEABILITY MEASUREMENTS
AND NUMERICAL FLOW
SIMULATION
Procedure Of The Combined Technique
Figure 2 shows a procedure of our combined technique of physical experiments and numerical simulations for evaluating flow fields within a single fracture during sliding. In our combined technique, Fracture aperture models are generated numerically at the certain cumulative shear displacement at which the permeability tests were conducted. Then flow simulations are applied to the aperture models to evaluate flow field within a fracture referring the fracture permeabilities obtained from the permeability tests.
First, topography of fracture surfaces is measured after the series of experiments using a non-contact laser profilometer [cf. Watanabe et al., 2005] with an interval of 0.15 mm over the area of 120 mm x 60 mm that covers an entire fracture surface. A numerical fracture aperture model is calculated using the topography data at one-point contact state as an initial aperture. In the generation of aperture model, the shear displacement at which permeability test was carried out is applied to the one side of the fracture surface data.
Next, flow simulation is conducted using the
aperture model, and fracture permeability, kcal, is
computed from the output (total flow rate, Q) of the simulator.
Then, kcal, is compared with the permeability
estimated in the permeability tests, km. When they are
equal, then we have flow field and aperture distribution at a certain shear displacement. When they are not equal, the aperture is closed by certain distance in the direction perpendicular to the fracture surfaces, and aperture model is recalculated. In the recalculation, we assume that the part of fracture surfaces interpenetrating into the opposite surfaces is not considered (dissolution model). Flow filed and in flow simulation is conducted again, and kcal is
calculated. This sequence is repeated till the kcal takes
the same value as km.
Flow Simulation On The Basis Of The
Permeability Measurements
We adopted a numerical flow simulator used in Watanabe et al. (2005). The simulator solves the Reynolds equation, which is an approximate expression of Navier-Stokes equation, by the finite difference method. The calculation code of flow simulation is based on the algorithm in the D/SC (Deterministic/Stochastic Crack network modeler) simulation code developed by Japan Petroleum Exploration Co., Ltd (JAPEX). Our simulator outputs flow field of incompressible fluid in two dimensions at steady state. Figure 3 shows boundary conditions for the flow simulation. No inflow and outflow is allowed from the sidewalls in the direction parallel to the macroscopic flow. A constant fluid pressure differential is given with a uniform pressure of 0.1 MPa along one side perpendicular to the flow and 0
FIGURE 2. Procedure for calculating numerical fracture
aperture distributions based on the permeability
MPa along the opposite side, which is the same condition as that in the permeability tests.
In the simulation, fluid viscosity, µ, is assumed to be 1.0 x 10⁻³ [Pa·s], which is that of pure water at 20˚C.
We assumed aperture width at contact area to be 0.001 mm because of time limitation of calculations. Fracture permeability, k, is calculated from total flow rate, Q, output in our simulator by assuming Darcy's law and parallel plate model [e.g., Chen et al., 2000].
In the Darcy's law, a relation between k and Q is described as the following equation,
L
P
kA
Q
=
!
µ
, (1)where A is a cross sectional flow area, ΔP is a fluid pressure differential and L is a representative fracture length.
In a parallel plate model, A relationship between k and hydraulic aperture, eh, which is defined as a
unique distance between fracture surfaces, is shown as
k = eh2 /12, and A is shown as A =W·L, considering a
fracture width W. Then, k is given by the following equation, 3 2
12
!!
"
#
$$
%
&
'
=
P
W
LQ
k
µ
. (2)RESULTS AND DISCUSSION
Permeability Measurements During
Sliding Of Single Fracture
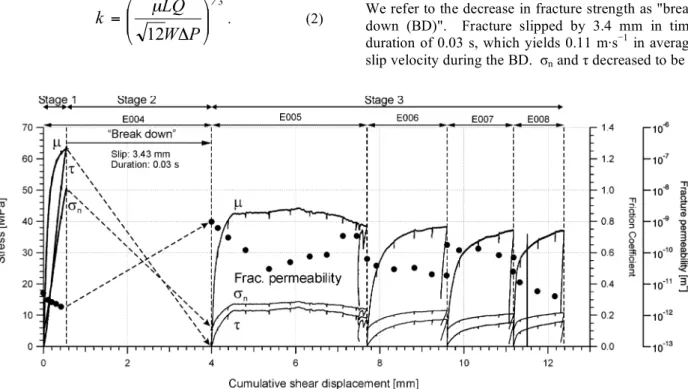
Figure 4 shows compiled results from the five sliding experiments and permeability tests at the certain cumulative shear displacement. They are plotted as functions of cumulative shear displacement. The mechanical behaviors of a fracture and fracture permeability changes can be classified into three major stages through the five runs.
In the first stage (the former part of E004), linear increases in apparent normal stress (σn) and shear
stress (τ), acting on the fracture were observed. Fracture permeability decreases with shear displacement, which suggests that the fracture closes with the increase in the stresses. At the last stage of the stage 1, normal stress and shear stress reached up to 50 and 64 MPa, respectively. Then friction coefficient, µ (= τ/σneff), is calculated to be 1.28 by
assuming that fluid pressure within the fracture is 0.1 MPa.
In the second stage (the latter part of E004), an abrupt decrease in fracture strength (stresses) occurred. We refer to the decrease in fracture strength as "break down (BD)". Fracture slipped by 3.4 mm in time duration of 0.03 s, which yields 0.11 m·s−1 in average
slip velocity during the BD. σn and τ decreased to be 5
FIGURE 4. Compiled results of the permeability measurements during frictional sliding of a single fracture. Normal stress
(σn), shear stress (τ) acting on the apparent fracture surface, friction coefficient (µ), and the calculated fracture permeabilities are
plotted (shown by dots) as functions of cumulative shear displacement. A sudden decrease in the stresses with increasing in the shear displacement by 3.43 mm indicates the occurrence of the "break down". A significant increase in the fracture permeability is observed associated with the break down, which indicates shear dilation (an increase in aperture volume with shearing) occurred.
(= Pc) and 0 MPa, respectively. This indicates that no
axial load was applied to the sample. Fracture permeability increased by three orders of magnitude along with the BD. This suggests that significant shear dilation, i.e., an increase in fracture volume occurred with the BD.
During the third stage (after the BD through E005 to E008), stable sliding was observed. During the stable sliding, fracture permeability gradually decreases with an increase in shear displacement. Discontinuity in fracture permeability can be seen between the runs. This is because the fracture opened when it was unloaded. Nevertheless, we can identify that fracture permeability gradually decreased from initial values with shear displacement during the individual run. This suggests that degradation of contact area in fracture would cause closure of fracture aperture.
We see the decrease in fracture permeability ranges in an order of magnitude for each run, even though the permeability discontinuities are observed between the runs. The permeability changes is much smaller than that associated with the breakdown, which showed a significant increase by three orders of magnitude. Fracture permeability is referred to represents macroscopic flow property of single fractures. Thus our results show that drastic changes in fracture permeability did not occur during sliding.
Aperture Distributions And Flow Fields
Within A Single Fracture During Sliding
Under Stress Condition
Figure 5 shows fracture aperture distributions and flow fields within the fracture during shearing after the breakdown. They are illustrated as functions of cumulative shear displacement.
We can identify transition and disappearance in major flow paths in flow fields with increasing the cumulative shear displacement.
While the cumulative shear displacement increases by 0.3 mm from 7.17 mm to 7.47 mm (the latter of E005), major paths, which are illustrated with white area, switched to one to other paths. At the same time, flow paths have emerged at the middle of the flow field associated with the path switching.
On the other hand, while the shear displacement increased from 8.75 mm to 9.5 mm (E006), flow path has disappeared at the middle of the flow field.
In both cases, fracture permeabilities take the same order of magnitude at the slip increments. This suggests that the significant changes in major flow paths during sliding can occur even in relatively small changes of fracture permeability which is considered as a macroscopic hydraulic property of a fracture.
These results imply that effects of water-rock interactions (precipitation and/or dissolution of rock minerals) within fractures on mechanical strength would be affected within fractures during sliding (e.g., fractures in fault system).
Water-rock interactions can be enhanced at the places within fractures where fluid (water) flows since advection would play major role in material transport within fractures.
Precipitation would strengthen mechanical fracture, and dissolution would weaken it vise versa.
Hence, once they occur within fractures, mechanical strength within fractures would change locally, which, in consequence, could affect shearing behavior of fractures.
FIGURE 5. Flow fields within the fracture and fracture aperture distributions after the break down obtained with our combined
technique. Upper row indicates fracture aperture distributions generated using the combined technique. Lower row indicates flow fields in the fracture calculated from the flow simulation. They are illustrated as an increase in cumulative shear displacement. Numbers shown at the upper left in some flow fields show multiplier of the contour. Switching of major flow paths can be identified at the stage in which the cumulative shear displacement increases from 7.17 mm to 7.47 mm. Disappearances of the flow paths also can be seen at the stage of 9.5 mm in the cumulative shear displacement.
CONCLUSIONS
Our results show that fluid flow field (major flow paths) changes significantly even after small sliding. This suggests that the change in flow field with shearing could play important roles in material transport due to advection. Water-rock interactions, such as precipitation and/or dissolution, associated with fluid flow can be affected in sheared fractures. This can affect physical strength and flow properties of rock fractures.
ACKNOWLEDGEMENTS
This research was partly funded by the 21st Century COE (Center of Excellence) program, "Advanced Science and Technology for the Dynamic Earth", Tohoku University.
REFERENCES
1. Brown, S., A. Caprihan, and R. Hardy (1998), Experimental observation of fluid flow channels in a single fracture, J. Geophys. Res., 103(B3), 5125-5132. 2. Boulon, M. J., A. P. S. Selvadurai, H. Benjelloun, and B. Feuga (1993), Influence of rock joint degradation on hydraulic conductivity, Int. Jour. Rock Mech. Min. Sci. & Geomech. Abst., 30, 7, 1311-1317, doi:10.1016/0148-9062(93)90115-T.
3. Gentier, S., J. Riss, G. Archambault, R. Flamand, and D. Hopkins (2000), Influence of fracture geometry on shear behavior, Int. J. Rock Mech. Min. Sci., 37(1-2), 161-174.
4. Grasselli, G., J. Wirth, and P. Egger (2002), Quantitative three-dimensional description of a rough surface and parameter evolution with shearing, Int. Jour. Rock Mech. Min. Sci., 39, 6, 789-800, doi:10.1016/S1365-1609(02)00070-9.
5. Lee, H. S., Y. J. Park, T. F. Cho, and K. H. You (2001), Influence of asperity degradation on the mechanical behavior of rough rock joints under cyclic shear loading, Int. J. Rock Mech. Min. Sci., 38(7), 967-980. 6. Lee, H. S., and T. F. Cho (2002), Hydraulic
characteristics of rough fractures in linear flow under normal and shear load, Rock Mech. Rock Eng., 35(4), 299 - 318.
7. Mitani, Y., T. Esaki, and Y. Nakashima (2002), An experimental study on the anisotropy of flow in a rock joint, in Proc. of the 2002 ISRM regional symposium on rock engineering, Seoul, Korea, 281-288.
8. Nemoto, K., H. Oka, N. Watanabe, N. Hirano, and N. Tsuchiya (2006), Evaluation of fluid flow path in a single fracture undergoing normal stress and shear offset, in WATER DYANMICS: 3rd International Workshop on Water Dynamics, AIP Conf. Proc., vol. 833, edited by K. Tohji et al., 156-161, AIP, New York. 9. Nemoto, K., N. Watanabe, H. Oka, N. Hirano, and N.
Tsuchiya (2007), Numerical estimation of anisotropic fluid flow in sheared rock fractures, in WATER DYANMICS: 4th International Workshop on Water Dynamics, AIP Conf. Proc., vol. 898, edited by K. Tohji et al., 36-44, AIP, New York.
10. Nguyen, T. S., and A. P. S. Selvadurai (1998), A model for coupled mechanical and hydraulic behaviour of a rock joint, Int. Jour. Numer. Analy. Methods in Geomech., 22, 1, 29-48, doi:10.1002/(SICI)1096-9853(199801)22:1<29::AID-NAG907>3.0.CO;2-N. 11. Tsang, Y. W. (1984), Effect of tortuosity on fluid flow
through a single fracture, Water Resour. Res., 20(9), 1209-1215.
12. Tsang, C. F., and I. Neretnieks (1998), Flow channeling in heterogeneous fractured rocks, Rev. Geophys. 36(2), 275-298.
13. Watanabe, N., N. Hirano, T. Tamagawa, K. Tezuka, and N. Tsuchiya (2005), Numerical estimation of aperture structure and flow wetted field in rock fracture, Geotherm. Res. Council Trans., 29, 431-436.
14. Watanabe, N., N. Hirano, T. Tamagawa, K. Tezuka, and N. Tsuchiya (2006), High resolution modeling of aperture structure and flow path in rock fracture, in WATER DYANMICS: 3rd International Workshop on Water Dynamics, AIP Conf. Proc., vol. 833, edited by K. Tohji et al., 173-176, AIP, New York.
15. Watanabe, N., N. Hirano, and N. Tsuchiya (2007), Evaluation of aperture structure and fluid flow in shear fracture of granite using high-resolution numerical modeling technique, in WATER DYANMICS: 4th International Workshop on Water Dynamics, AIP Conf. Proc., vol. 898, edited by K. Tohji et al., 66-70, AIP, New York.
16. Watanabe, N., N. Hirano, and N. Tsuchiya (2007), Determination of aperture structure and fluid flow in a rock fracture under confining pressure through a high-resolution numerical modeling on the basis of experimental data, Water Resour. Res., under review.