Dust Destruction by Drift-induced Sputtering
in Active Galactic Nuclei
著者
Ryo Tazaki, Kohei Ichikawa
journal or
publication title
The Astrophysical Journal
volume
892
number
2
year
2020-04-07
URL
http://hdl.handle.net/10097/00130798
doi: 10.3847/1538-4357/ab72f6
Dust Destruction by Charging: A Possible Origin of Gray Extinction Curves of Active
Galactic Nuclei
Ryo Tazaki1 , Kohei Ichikawa1,2 , and Mitsuru Kokubo1
1
Astronomical Institute, Graduate School of Science Tohoku University, 6–3 Aramaki, Aoba-ku, Sendai 980-8578, Japan;[email protected]
2
Frontier Research Institute for Interdisciplinary Sciences, Tohoku University, Sendai 980-8578, Japan Received 2020 January 22; revised 2020 February 18; accepted 2020 February 18; published 2020 March 31
Abstract
Observed extinction curves of active galactic nuclei(AGNs) are significantly different from those observed in the Milky Way. The observations require preferential removal of small grains at the AGN environment; however, the physics for this remains unclear. In this paper, we propose that dust destruction by charging, or Coulomb explosion, may be responsible for AGN extinction curves. Harsh AGN radiation makes a dust grain highly charged through photoelectric emission, and grainfission via Coulomb explosion occurs when the electrostatic tensile stress of a charge grain exceeds its tensile strength. We show that Coulomb explosion can preferentially remove both small silicate and graphite grains and successfully reproduce both flat extinction curve and the absence of 2175Åbump.
Unified Astronomy Thesaurus concepts:Active galactic nuclei(16);Astrophysical dust processes(99);Ultraviolet extinction(1738)
1. Introduction
Dust is a crucial component of active galactic nuclei(AGNs; Urry & Padovani1995). Recently, mid-infrared interferometric
observations have revealed the presence of dust grains at polar regions at parsec scales(Hönig et al.2012,2013; Tristram et al.
2014; López-Gonzaga et al. 2016; Leftley et al. 2018; Hönig 2019). These polar dust grains are thought to be
irradiated by harsh AGN radiation almost directly, and grain properties could be different from those observed in the local interstellar medium (e.g., Laor & Draine1993).
The wavelength dependence of extinction at ultraviolet wavelengths is a powerful tool to infer dust properties at the polar region because grain properties are imprinted in the extinction curves (e.g., Li 2007). Previous observations have
shown that AGN extinction curves are significantly different from those observed in the Milky Way (e.g., Maiolino et al.
2001a,2001b,2004; Gallerani et al.2010; Hjorth et al.2013).
Major properties of AGN extinction curves are (i) flat wavelength dependence at far-ultraviolet wavelengths and (ii) the absence of a 2175Åbump (Czerny et al. 2004; Gaskell et al. 2004; Gaskell & Benker2007), which is thought to be
caused by small graphite grains and/or polycyclic aromatic hydrocarbon (PAH) nanoparticles (e.g., Draine & Lee 1984; Weingartner & Draine 2001a; Compiègne et al.2011). These
observations imply that small grains, in particular for graphite grains, are preferentially removed from the AGN environments. Several mechanisms have been proposed to explain the depletion of small grains, such as thermal sublimation and sputtering(Laor & Draine1993); however, these models seem
to fail. The sublimation is more likely to remove silicate grains rather than graphite grains, which is not consistent with observations(e.g., Gaskell et al.2004). Chemisputtering might
also preferentially destroy hot graphite grains (Barlow 1978; Draine 1979); however, it might be suppressed for a highly
charged grain as thermal sputtering is suppressed in the vicinity of an AGN (e.g., Tazaki & Ichikawa2020). In addition,
drift-induced sputtering may not be an efficient mechanism for destroying small grains(0.1 μm) because Coulomb coupling
between gas and the grains tends to halt hypersonic drift (Tazaki & Ichikawa 2020). Although Hoang et al. (2019)
pointed out rotational disruption recently, this mechanism is also inefficient for disrupting small grains. If a 2175 Å bump is associated with PAH nanoparticles (e.g., Li & Draine 2001),
these small grains might be disrupted by stochastic heating at around the AGN, although this possibility is also inconclusive. Hence, to date, a physical process responsible for flat and featureless extinction curves is still a matter of debate.
In this paper, we propose a new scenario for the origin of AGN extinction curves: dust destruction by charging, or Coulomb explosion(e.g., Draine & Salpeter1979; Weingartner et al.2006). Dust destruction by charging has been discussed in
the field of gamma-ray bursts (Waxman & Draine 2000; Fruchter et al. 2001); however, such an effect has been
overlooked in interpreting AGN extinction curves. Since Weingartner et al. (2006) have shown that a Coulomb
explosion can occur even if grains are 100 pc away from quasar, it is naturally anticipated that such a process may significantly alter grain properties at a parsec-scale AGN environment.
In this paper, we study how dust destruction by charging affects AGN extinction curves and compare our model with a previously suggested thermal sublimation model. This paper is organized as follows. In Section2, we summarize methods to calculate Coulomb explosion and thermal sublimation. Extinc-tion curves predicted by dust destrucExtinc-tion models are presented in Section 3. Sections 4 and 5 present a discussion and summary, respectively.
2. Methods and Models 2.1. AGN Environment
The radiation spectra of AGNs are taken from Nenkova et al. (2008), and the bolometric luminosity is assumed to be
=
-LAGN 1045erg s 1. For convenience, we define
( )
=
-L45 LAGN 1045erg s 1. Since we focus on grains at the polar region, where grains are thought to be irradiated by AGN radiation directly, we ignore the attenuation of AGN radiation.
At the parsec-scale polar region, radiation-hydrodynamic simulations suggest that the gas temperature and density are about Tg»104 K and nH»10-10 cm3 -3, respectively
(Wada et al. 2016). Hence, we adopt Tg=104 K and
=
-nH 10 cm2 3 as a fiducial set of parameters. For the sake of simplicity, we assume Tg and nHare constants.
2.2. Grain Charge
Dust grains become positively charged in the AGN environments (Weingartner et al. 2006). We compute grain
charge Zd (in the electron charge unit) by solving the rate
equation(Weingartner et al. 2006; Tazaki & Ichikawa2020):
( ) = - + + dZ dt J J J J , 1 d pe e sec,gas ion
where Jpe is the photoelectric emission rate (Weingartner &
Draine 2001b; Weingartner et al. 2006), Je and Jion are the
collisional charging rate of electrons and ions, respectively (Draine & Sutin 1987), and Jsec,gas is the rate for secondary
electron emission induced by incident gas-phase electrons (Draine & Salpeter 1979). A typical charging timescale of a
neutral grain due to electron collisions isJe- ~0.9 s
1 (Draine &
Sutin 1987), whereTg=104 K, the grain radiusa=0.1μm, the electron density ne=10 cm2 -3, and the sticking prob-ability of 0.5 (Draine & Sutin 1987) are used. Since the
charging timescale is much shorter than the dynamical timescale, we can assume the steady state in Equation (1). In
addition, we can also ignore grain-charge distribution because the single-charge equilibrium approximation gives reliable results for highly charged grains (Weingartner et al. 2006).
Thus, in this paper, we solve Jpe-Je+Jsec,gas+Jion=0 to find Zd.
It is useful to introduce the ionization parameter, º g
Uion n nH, where nγ is the total photon number density beyond 13.6 eV. Since the grain charge is mostly determined by the balance of photoelectric emission and electron collisions, Uioncharacterizes the grain-charge amount. For the radiation spectra of AGNs used in Nenkova et al. (2008), we
obtain ⎛ ⎝ ⎜ ⎞ ⎠ ⎟⎛ ⎝ ⎜ ⎞ ⎠ ⎟ ( ) = ´ g - -n 2.61 10 cm L r 10 erg s pc , 2 6 3 AGN 45 1 2
where r is the distance from the central engine of the AGN. As a result, the ionization parameter becomes
⎜ ⎟ ⎛ ⎝ ⎞⎠ ⎛ ⎝ ⎜ ⎞ ⎠ ⎟⎛ ⎝ ⎜ ⎞ ⎠ ⎟ ( ) = ´ - - -U 2.61 10 n L r 10 cm 10 erg s pc . 3 ion 4 2 H 3 1 AGN 45 1 2 2.3. Grain Temperature
The grain temperature, Td, is obtained from the radiative
equilibrium: ( ) p p á ñ = p s á ñ L r a Q a T Q 4 4 T, 4 AGN 2 2
abs AGN 2 SB d4 abs d
where r is the distance from the AGN, áQabs AGNñ and áQabsñTd
are the AGN-spectrum averaged absorption efficiency and Planck mean absorption efficiency at dust temperature Td,
respectively, and sSB is the Stefan–Boltzmann constant. The
absorption efficiency, Qabs, is calculated by using the Mie
theory(Bohren & Huffman1983), and the optical constant of
silicate grains was taken from Draine & Lee (1984), Laor &
Draine (1993), and Draine (2003). For graphite, the optical
constant is calculated by adding the interband and free electron contributions (see also Draine & Lee 1984; Laor & Draine 1993; Draine 2003), where we adopt free electron
models of Aniano et al. (2012). If the size parameter
p l
=
x 2 a , where λ is the wavelength, is larger than 2×10⁴, we use the anomalous diffraction approximation (van de Hulst1957) instead of using the Mie theory.
2.4. Grain Destruction Processes
We consider two kinds of dust destruction: Coulomb explosion (Section 2.4.1) and thermal sublimation (Section2.4.2).
2.4.1. Coulomb Explosion
If a dust grain acquires a large amount of positive charges, Coulomb repulsion force within the grain causes grainfission, so-called Coulomb explosion (Draine & Salpeter 1979). The
condition for Coulomb explosion is(Draine & Salpeter1979)
⎜ ⎟ ⎛ ⎝ ⎞⎠ ( ) p = S U a S 1 4 , 5 2 max
where S is the tensile stress in a charged sphere,U=Z e ad is
the electrostatic grain potential, and Smaxis the tensile strength
of the material. In the following, we use the normalized tensile strength defined by ˆSmax,9=(Smax 10 erg cm9 -3).
If the grain potential satisfies U a( )a(4pSmax)1 2, the electric stress exceeds the tensile strength of a grain, and then Coulomb explosion will occur. We define the critical grain radius for Coulomb explosion, aCE, such that
( )= ( p )
U aCE aCE 4 Smax 1 2. Grains smaller than aCE are
subjected to Coulomb explosion. Coulomb explosion will produce fragments of smaller grains. However, smaller fragments will be also charged enough to cause Coulomb explosion. Hence, we expect that a cascade fragmentation of grains due to Coulomb explosion occurs.
The tensile strength of a dust grain depends on material properties, such as composition and crystallinity. Although the tensile strength of cosmic dust particles is highly uncertain, laboratory measurements give us an estimate(see Hoang et al.
2019for a summary of tensile strength). The tensile strength of graphite (polycrystalline) is suggested to be about
ˆ =
-Smax,9 0.5 1 (Burke & Silk 1974). Hence, in this study, we adopt the conservative value of ˆSmax,9=1 for graphite grains. The tensile strength of forsterite (silicate) can be as small as ˆSmax,9=1.21 (Gouriet et al. 2019). Meanwhile, MacMillan (1972) reported the tensile strength of glass rods
and fibers is about ˆSmax,9=130. We adopt the values of
ˆ =
Smax,9 10 for silicate. It is worth noting that the above measurements are based on bulk materials, and therefore small grains may have different values of tensile strength. Since the tensile strength is an uncertain parameter, we discuss how Smax
changes our results in Section3.
2.4.2. Thermal Sublimation
The sublimation temperature of dust grains, Tsub, is
determined by a balance between gas pressure and saturation pressure(Guhathakurta & Draine1989; Baskin & Laor2018).
By using Equation(27) in Baskin & Laor (2018), we compute
Tsubwith the the standard solar elemental abundances(Grevesse
& Sauval 1998). As a result, we obtain Tsub=1322 K for graphite and Tsub=1072 K for silicate grains when
=
-nH 10 cm2 3andTg=10 K4 .
Since smaller grains are usually hotter than larger grains, they can preferentially sublimate (e.g., Laor & Draine 1993).
We can define critical grain radius for thermal sublimation such thatT ad( sub) =Tsub. Grains smaller than asub will sublimate.
3. Results
3.1. Electrostatic Grain Potential
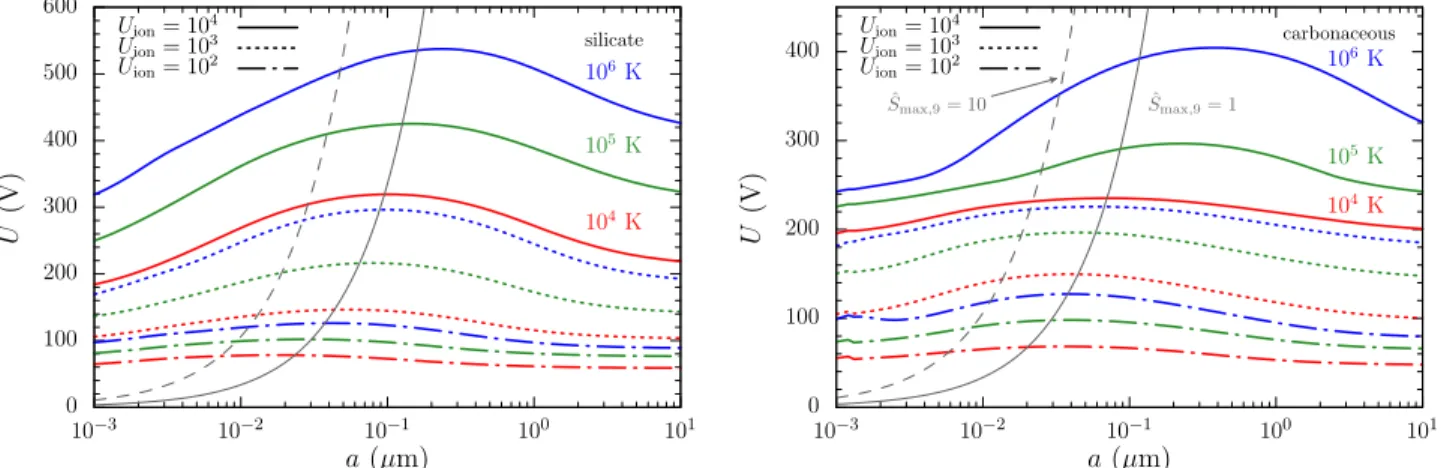
Wefirst solve Equation (1) with the steady-state assumption,
and the results are presented in Figure1. As a general tendency, higher Uion and Tg give larger grain electrostatic potential. Our
calculations quantitatively agree with Weingartner et al.(2006),
although assumed radiation spectra are not the same.
Figure1shows that the grain potential depends on the grain radius and becomes maximum at the submicron sizes, while grain charge Zdis a monotonically increasing function of grain
radius. This is mainly determined by two competing effects: photoelectric yield and photon absorption efficiency. With decreasing grain radius, the photoelectric yield is increased due to the small particle effect (e.g., Watson1973; Draine 1978).
Hence, smaller grains are more likely to emit photoelectrons once a high-energy photon is absorbed. However, decreasing grain radius reduces the absorption efficiency of photons, once the grain radius is smaller than the incident radiation wavelength, which is typically about l ~ 0.1 mm. Hence, due to lower photon absorption efficiency, the photoelectric emission rate is decreased, and therefore the grain potential is decreased for smaller grains (a 0.1 m). Because of thesem
two effects, the grain potential is maximized at submicron sizes. Although the grain potential also depends on the grain composition, silicate and graphite grains have almost similar grain potential.
Figure1also shows that the critical grain size for Coulomb explosion is about aCE ~0.01-0.1 mm for
=
-Uion 102 104 andTg=104-106 K at ˆSmax,9=1.
3.2. Coulomb Explosion versus Thermal Sublimation Next, we compare aCE and asub as well as their radial
dependence from the center of the AGN. Figure2 shows the critical grain radii asub and aCE for both silicate and graphite
composition as a function of the distance from the AGN. It is found that aCE has shallower radial dependence than asub. The
radial dependence of the critical grain radius for sublimation is about asubµr-2. As long as the Rayleigh approximation is
valid, that is, the wavelength of thermal emission is longer than the grain radius, we have áQabsñ µTd a. Hence, for afixed dust
temperature ( =Td Tsub), Equation (4) results inasubµr-2. In
other words, asub is proportional to the radiative flux from
the AGN.
Grain charging seems to be caused also by the radiationflux, since a grain is charged via photoelectric emission. However, grain potential is not proportional to r-2. For example, in
Figure1, even if Uion(∝ radiative flux) decreases by an order of
magnitude, grain potential U decreases only by a factor of few. These results suggest that Coulomb explosion can be important at larger distances, e.g., parsec-scale distance.
Figure2also shows that a difference in aCEbetween graphite
and silicate grains is not so large compared to the difference seen in asub. Thus, Coulomb explosion tends to remove both
silicate and graphite grains of almost similar grain radii. Meanwhile, for sublimation, the graphite grains have smaller
asub because (1) the emissivity at near-infrared wavelength is
higher, and (2) Tsub is higher (see also Laor & Draine 1993;
Baskin & Laor 2018). Therefore, this suggests that thermal
sublimation preferentially removes small silicate grains rather than graphite grains.
3.3. Extinction Curves
To understand how thermal sublimation or Coulomb explosion change extinction curves, we compute an extinction cross section of grains. We assume that the grain size distribution obeysdni µ ia-3.5da(amini a amax), where
dni is the number density of dust grains of type i(silicate or graphite) in a size range [a a, +da], and iis the abundance
Figure 1.Electrostatic potential,U=eZd a, for silicate grains(left) and carbonaceous grains (right). Solid, dotted, and dotted–dashed lines represent the results for
=
Uion 104, 103, and 102, respectively. Blue, green, and red colors represent gas temperatureTg=106K, 105K, and 104K, respectively. Gray solid and dashed lines
of the grain type i (Draine & Lee 1984). We set
( =
amini maxasubi , a
i
CE, amin,MRN), where
=
amin,MRN 0.005μm. We treat amax as a free parameter. We
also set the abundance of silicate and graphite from Draine & Lee (1984). The extinction magnitude at wavelength λ, Aλ, is
( ) ( )
ò
å
l µ l A C a dn dada , , 6 i i i extwhere Cexti (l,a) is the extinction cross section of a grain of type i with radius a. We define the extinction curve as
(l - ) ( - )=( l - ) ( - )
E V E B V A AV AB AV , where AV
and AB are the extinctions at visual (5500 Å) and blue (4400 Å) wavelengths.
Figure3shows the extinction curves with/without Coulomb explosion at L3 4512 pc away from the nucleus. The extinction
curve with Coulomb explosion can successfully reproduce a flat extinction curve as well as the absence of a 2175 Å bump. In addition, the predicted extinction curve is consistent with the observation by Gaskell & Benker (2007). Meanwhile, the
extinction curve without Coulomb explosion, or
( )
=
amini maxasubi ,amin,MRN , shows a prominent 2175Å bump.
This is because sublimation does not remove small graphite grains, although small silicate grains are removed (Figure 2).
Since observed AGN extinction curves do not show such a bump (Czerny et al. 2004; Gaskell et al. 2004; Gaskell & Benker 2007), the sublimation model is insufficient to
reproduce observed extinction curves.
Figure4shows extinction curves at various radial distances. Even if the radial distances are changed, the overall shape of the extinction curve with Coulomb explosion is still similar to the one from Gaskell & Benker (2007) up to r 10L45
1
2 pc,
while the thermal sublimation model remains inconsistent with observations. When increasing the distance from the AGN, Uion
decreases, and then smaller grains can survive from Coulomb explosion; nevertheless, 2175Å is still weak for the model with Coulomb explosion.
Extinction curves with Coulomb explosion are not sensitive to the choice of maximum grain radius as long as it is larger than 0.25 mm (Figure 5). When grain radius is smaller this
value, the extinction curve steeply increases with decreasing wavelength.
Extinction curves with Coulomb explosion are found to be similar to those observed by Gaskell & Benker (2007). In
addition, if the maximum grain radius is smaller than 0.25μm, the curves become similar to those observed by Czerny et al. (2004). However, our model fails to explain observations by
Gaskell et al.(2004). Explaining such extinction curves might
require an additional mechanism, such as a reduced-graphite abundance(Gaskell et al.2004).
4. Discussion
4.1. Comparison with Observations of the Torus Innermost Radius
We have shown that the Coulomb explosion can be a more important process for dust destruction than thermal sublima-tion. Meanwhile, near-IR dust reverberation mapping observa-tions for AGNs, which show that the color temperatures of the variable hot dust emission agree with the dust sublimation temperature(1400 − 2000 K), and the innermost radius of the dust torus Rin is proportional to the square root of the AGN
luminosity (RinµLAGN
1 2 ), strongly suggest that the dust
inner-most radius is determined by the thermal sublimation(Koshida et al. 2014; Yoshii et al. 2014; Minezaki et al. 2019; Gravity Collaboration et al.2020and references therein). This apparent conflict can be attributable to the difference of gas density.
While the ambient gas density of nH=10 cm2 -3 assumed throughout the calculations in this work is a reasonable assumption for the outflowing gas at the polar region of AGNs, the gas density of the equatorial dust torus is expected to be much higher. The gas at the innermost part of the dust torus can be as dense as broad emission line regions, where
Figure 2.Grain radius against a distance from the AGN. Black and red lines indicate asuband aCE, respectively, where aCEis computed for ˆSmax,9=1for
both silicate and graphite grains. Solid and dashed lines indicate silicate and graphite grains, respectively. Gray dotted and dashed–dotted lines are aCEfor
ˆ =
Smax,9 10 for both graphite and silicate grains, respectively. Grains with
a asub, aCEwill be disrupted.
Figure 3.Extinction curves with and without Coulomb explosion are shown in red solid and blue dashed lines, respectively. For reference, the gray short-dashed line is the average Milky Way extinction curve, which is computed with
m
=
amin 0.005 mandamax=0.25μm. Circles indicate observed values taken
from Gaskell & Benker(2007), whereas crosses and squares indicate those
taken from Czerny et al.(2004) and Gaskell et al. (2004), respectively. We
assumeamax=1 mm .
~
-nH 1010cm 3 (e.g., Baskin & Laor 2018; Kokubo & Minezaki 2020); in such a dense gas region, higher dust
sublimation temperatures are expected (Tsub=1880 K and 1503K for graphite and silicate grains, respectively), and the importance of the Coulomb explosion relative to the thermal sublimation is significantly reduced due to inefficient grain charging by the enhanced electron collision rate (see Section 2.2). Therefore, unlike in the case of the polar dust
region, the dust destruction at the innermost region of the
equatorial dust torus must be governed by the thermal sublimation.
4.2. Tensile Strength of Small Grains?
Coulomb explosion depends on the tensile strength assumed. Figure 6 shows how the tensile strength affects extinction curves. In Figure 6, both silicate and graphite grains are assumed to have the same tensile strength. As the tensile
Figure 4.Same as Figure3, but for different distances from the AGN. For all lines, the AGN luminosity is set asL45=1. Left and right panels show the results with and without Coulomb explosion, respectively.
Figure 5.Extinction curves for various amax, where tensile strength of graphite
and silicate grains are ˆSmax,9=1and 10, respectively.r=3L45 1
2 pc is assumed.
The gray short-dashed line shows the Milky Way values.
Figure 6.Predicted extinction curves by the Coulomb explosion model with various tensile strength values. Solid, dashed, and dotted–dashed lines correspond to ˆSmax,9=1, 10, 100, respectively. Both silicate and graphite grains have the same tensile strength with an assumption ofamax=1μm.
strength increases, Coulomb explosion becomes inefficient, and then both small silicate and graphite grains can survive. As a result, extinction curves show an increase toward shorter wavelengths with a prominent 2175Å bump. Hence, observed extinction curves, e.g., a lack of a 2175Å bump, seems to be reproduced when ˆSmax,910, and this is within a range of measured values for bulk materials(e.g., Section 2.4.1).
Under the assumption of the tensile strength for bulk materials determined by laboratory experiments, the Coulomb explosion leads to the absence of small dust grains in close vicinity to AGNs and thus can naturally explain the observed flat extinction curve. Conversely, if the tensile strength of the cosmic dust is far stronger than that for the bulk materials due to, e.g., crystallization by annealing for hot small grains, the graphite grains survive even under the large electrostatic potential and a 2175Å bump feature is unavoidable. Therefore, if our scenario for the flat extinction curve by the Coulomb explosion is true, it also suggests that the tensile strength of the cosmic dust must be close to the value of the bulk materials. However, we should keep in mind that if PAH nanoparticles are the carrier of a 2175Å bump, the bump might be suppressed by destroying these particles as suggested by observations(e.g., Sturm et al.2000).
5. Conclusion
In this paper, we have shown that thermal sublimation is insufficient to reproduce observed AGN extinction curves because this model predicts too strong of a 2175Å bump due to preferential survival of small graphite grains. We have proposed that Coulomb explosion can successfully reproduces flat extinction curves as well as the absence of 2175 Å bump as long as the tensile strength is lower than1010erg cm-3. The
predicted extinction curves have shown to be very similar to those observed by Gaskell & Benker(2007) as well as Czerny
et al. (2004). The Coulomb explosion model implies that the
variety of radiation environment (Uion) and maximum grain
radius may partly explain various types of observed AGN extinction curves(Czerny et al.2004; Gaskell & Benker2007).
R.T. would like to thank Joseph Weingartner for his kind cooperation of our code validation. R.T. and M.K. were supported by a Research Fellowship for Young Scientists from the Japan Society for the Promotion of Science (JSPS; JP17J02411 and JP17J01884, respectively). This work was also supported by JSPS KAKENHI grant Nos. JP19H05068 (R.T.) and JP18K13584 (K.I.). This work was supported by the Program for Establishing a Consortium for the Development of Human Resources in Science and Technology, Japan Science and Technology Agency(JST).
ORCID iDs
Ryo Tazaki https://orcid.org/0000-0003-1451-6836
Kohei Ichikawa https://orcid.org/0000-0002-4377-903X
Mitsuru Kokubo https://orcid.org/0000-0001-6402-1415
References
Aniano, G., Draine, B. T., Calzetti, D., et al. 2012,ApJ,756, 138
Barlow, M. J. 1978,MNRAS,183, 397
Baskin, A., & Laor, A. 2018,MNRAS,474, 1970
Bohren, C. F., & Huffman, D. R. 1983, Absorption and Scattering of Light by Small Particles(New York: Wiley)
Burke, J. R., & Silk, J. 1974,ApJ,190, 1
Compiègne, M., Verstraete, L., Jones, A., et al. 2011,A&A,525, A103
Czerny, B., Li, J., Loska, Z., & Szczerba, R. 2004,MNRAS,348, L54
Draine, B. T. 1978,ApJS,36, 595
Draine, B. T. 1979,ApJ,230, 106
Draine, B. T. 2003,ApJ,598, 1026
Draine, B. T., & Lee, H. M. 1984,ApJ,285, 89
Draine, B. T., & Salpeter, E. E. 1979,ApJ,231, 77
Draine, B. T., & Sutin, B. 1987,ApJ,320, 803
Fruchter, A., Krolik, J. H., & Rhoads, J. E. 2001,ApJ,563, 597
Gallerani, S., Maiolino, R., Juarez, Y., et al. 2010,A&A,523, A85
Gaskell, C. M., & Benker, A. J. 2007, arXiv:0711.1013
Gaskell, C. M., Goosmann, R. W., Antonucci, R. R. J., & Whysong, D. H. 2004,ApJ,616, 147
Gouriet, K., Carrez, P., & Cordier, P. 2019,Minerals, 9, 787
Gravity Collaboration, Pfuhl, O., Davies, R., et al. 2020,A&A,634, A1
Grevesse, N., & Sauval, A. J. 1998,SSRv,85, 161
Guhathakurta, P., & Draine, B. T. 1989,ApJ,345, 230
Hjorth, J., Vreeswijk, P. M., Gall, C., & Watson, D. 2013,ApJ,768, 173
Hoang, T., Tram, L. N., Lee, H., & Ahn, S.-H. 2019,NatAs,3, 766
Hönig, S. F. 2019,ApJ,884, 171
Hönig, S. F., Kishimoto, M., Antonucci, R., et al. 2012,ApJ,755, 149
Hönig, S. F., Kishimoto, M., Tristram, K. R. W., et al. 2013,ApJ,771, 87
Kokubo, M., & Minezaki, T. 2020,MNRAS,491, 4615
Koshida, S., Minezaki, T., Yoshii, Y., et al. 2014,ApJ,788, 159
Laor, A., & Draine, B. T. 1993,ApJ,402, 441
Leftley, J. H., Tristram, K. R. W., Hönig, S. F., et al. 2018,ApJ,862, 17
Li, A. 2007, in ASP Conf. Ser. 373, Dust in Active Galactic Nuclei, ed. L. C. Ho & J. W. Wang(San Francisco, CA: ASP),561
Li, A., & Draine, B. T. 2001,ApJ,554, 778
López-Gonzaga, N., Burtscher, L., Tristram, K. R. W., Meisenheimer, K., & Schartmann, M. 2016,A&A,591, A47
MacMillan, N. H. 1972,JMatS,7, 239
Maiolino, R., Marconi, A., & Oliva, E. 2001a,A&A,365, 37
Maiolino, R., Marconi, A., Salvati, M., et al. 2001b,A&A,365, 28
Maiolino, R., Schneider, R., Oliva, E., et al. 2004,Natur,431, 533
Minezaki, T., Yoshii, Y., Kobayashi, Y., et al. 2019,ApJ,886, 150
Nenkova, M., Sirocky, M. M., Ivezić, Ž., & Elitzur, M. 2008,ApJ,685, 147
Sturm, E., Lutz, D., Tran, D., et al. 2000, A&A,358, 481
Tazaki, R., & Ichikawa, K. 2020, ApJ, in press (doi:10.3847/1538-4357/ ab72f6)
Tristram, K. R. W., Burtscher, L., Jaffe, W., et al. 2014,A&A,563, A82
Urry, C. M., & Padovani, P. 1995,PASP,107, 803
van de Hulst, H. C. 1957, Light Scattering by Small Particles(New York: Wiley)
Wada, K., Schartmann, M., & Meijerink, R. 2016,ApJL,828, L19
Watson, W. D. 1973,JOSA,63, 164
Waxman, E., & Draine, B. T. 2000,ApJ,537, 796
Weingartner, J. C., & Draine, B. T. 2001a,ApJ,548, 296
Weingartner, J. C., & Draine, B. T. 2001b,ApJS,134, 263
Weingartner, J. C., Draine, B. T., & Barr, D. K. 2006,ApJ,645, 1188
Yoshii, Y., Kobayashi, Y., Minezaki, T., Koshida, S., & Peterson, B. A. 2014,
ApJL,784, L11