第 55 卷 第 2 期
2020 年 4 月
JOURNAL OF SOUTHWEST JIAOTONG UNIVERSITY
Vol. 55 No. 2
Apr. 2020
ISSN: 0258-2724 DOI:10.35741/issn.0258-2724.55.2.57
Research articleEconomics
T
OURISTS
’
S
ATISFACTION
,
L
OYALTY AND
I
NTENTION
TO
R
ETURN
: S
URVEY AT
P
HONG
N
HA
-
K
E
B
ANG
N
ATIONAL
P
ARK
,
V
IETNAM
游客的满意度,忠诚度和回返意向:越南蓬卡克邦国家公园的调
查
Phan Thanh Hai a, *, Mai Thi Thuong b, Nguyen Le Dinh Quy c
a Faculty of Accounting, Institute of Research and Development, Duy Tan University
254 Nguyen Van Linh St., Thanh Khe District, Da Nang, 550000, Vietnam, [email protected]
b
Faculty of International Hospitality Management, Hospitality & Tourism Institute, Duy Tan University 254 Nguyen Van Linh St., Thanh Khe District, Da Nang, 550000, Vietnam, [email protected]
c VNUK Institute for Research and Executive Education, The University of Danang
158A Le Loi St., Hai Chau District, Da Nang, 550000, Vietnam, [email protected]
Received: February 01, 2020 ▪ Review: April 2, 2020 ▪ Accepted: April 20, 2020
This article is an open access article distributed under the terms and conditions of the Creative Commons Attribution License (http://creativecommons.org/licenses/by/4.0)
Abstract
This study was conducted to determine the impact of the destination image and emotional value on the tourists’ satisfaction, loyalty and intention to return to Phong Nha Ke Bang national park, Vietnam. The methods used by the authors include qualitative research and quantitative research based on Cronbach' Alpha, Exploratory Factor Analysis, Confirmatory Factor Analysis, and Structural Equation Modelling analysis. The study is based on data collected from May to July 2019 through a survey of 270 visitors. Research results show that destination image and emotional value are significantly associated with visitor satisfaction and loyalty and the intention to return. Additionally, there are significant differences between tourist groups in terms of gender and types of foreign and native visitors. In terms of age and income of visitors, the research results show that there are no significant differences. The research results also made recommendations for tourism authorities and local residents and travel companies to enhance satisfaction, loyalty and intention to return of tourists during their visits.
Keywords:Loyalty, Intention to Return, Satisfaction, Phong Nha - Ke Bang, Vietnam
摘要 这项研究的目的是确定目的地形象和情感价值对游客的满意度,忠诚度和返回越南丰芽可邦
国家公园的意图的影响。作者使用的方法包括基于克伦巴赫的阿尔法的定性研究和定量研究,探 索性因子分析,验证性因子分析和结构方程模型分析。该研究基于 2019 年 5 月至 2019 年 7 月通
过对 270 位访问者进行的调查收集的数据。研究结果表明,目的地形象和情感价值与访客的满意 度和忠诚度以及返回的意愿密切相关。此外,旅游者群体在性别,外国游客和本地游客类型方面 也存在显着差异。从访问者的年龄和收入方面,研究结果表明没有显着差异。研究结果还为旅游 部门,当地居民和旅行公司提出了建议,以提高他们在访问期间的满意度,忠诚度和回国意向。 关键词: 忠诚,回返意向,满意度,越南防芽康邦
I. I
NTRODUCTIONPhong Nha - Ke Bang is a famous Vietnamese tourist destination in recent years. It was recognized by UNESCO in 2003 as a world natural heritage site according to geological and geomorphological criteria, and in 2015 based on its biodiversity and ecological diversity. This is one of the very attractive destinations for tourists to explore because of its world-famous cave systems such as Son Doong, Thien Duong, Phong Nha, and its diversity of plants and animals. Over the past years, this tourist destination has attracted hundreds of thousands of visitors each year.
Like any tourist destination in the world and in Vietnam, this national park seeks to attract many of visitors because this will contribute to promoting the development of the local economy and promoting pictures of people and landscapes here. In order to do so, it is necessary to constantly improve the satisfaction and loyalty of visitors to encourage their return.
Research on the satisfaction, loyalty and return intention of tourist destinations is an intriguing topic. These factors are influenced by many things, including destination image and emotional value of visitors [37]. Some typical of studies include those of Bigne et al. [2], Chi and Qu. [4], Lee [15], and Williams and Soutar [35].
In Vietnam, many studies related to the above-mentioned relationship have been
conducted at various tourist
destinations including those of Duc and Kien [6], Nguyen Dinh Tho [19], and Thuy and Tuan [30]. However, thus far, no study has been conducted at Phong Nha - Ke Bang. Therefore, it is necessary to perform a study based on collecting data from the actual survey results for the tourists.
Accordingly, this article aims to present the following goals:
(i) Present a literature review of studies related to destination image, emotional value with satisfaction, loyalty and intention to return of visitors through the research of many previous authors. At the same time, clearly indicate the
interaction relationship between these factors in order to determine the theoretical research model. (ii) Proposal of the research model, research hypotheses and contents, including research design and analysis of research results on the relationship between concepts. In this section, the authors present the data collection and the methods used to test the initial hypotheses to establish an experimental research model.
(iii) The authors draw conclusions and recommendations from their research results and determine the research limitations as well as future directions.
In addition to the introduction, the structure of the article will include the following sections: presentation of relevant research situations and proposal of research model, presentation of data and research methods, the results of the research and a discussion. The final section will include presentation of conclusions and recommendations for the authorities, tourism agencies, local people and businesses to organize tourism activities related to this park in the future.
II. L
ITERATURER
EVIEWANDR
ESEARCHM
ODELA. Overview of Research Situation Related to the Concepts
1) Destination Image
This is a very interesting concept for many people involved in tourism because it is the perception visitors have of a specific destination or a certain region when they travel [16].
Destination images are understood as impressions, the perception of visitors about the place that they are experiencing. Many studies have also shown the relationship between destination images and various factors related to visitors such as satisfaction, loyalty or intention to return. This can be seen in the research by many different authors [2], [4], [6], [21], [28], [33], [34], [36].
Depending on the views of each author, the destination image can be measured by many different factors, the most common of which are tourism environment, natural and cultural
conditions, infrastructure for tourism, and support from local government. Specifically, the tourism
environment is expressed through the sense of
travel safety, the friendliness of local residents, the cleanliness of the tourist site, whether the prices of services and goods at tourist destinations are reasonable and whether necessary information about tourist destinations is easily accessible [2], [21]. In addition, the tourism environment is often evaluated based on many different aspects such as the situation and quality of life of residents at the tourist destination and the products and services that tourists provide [16].
Natural and cultural conditions are aspects
related to the natural landscape, environment, weather, landscapes and architectural structures around and on tourist sites and typical products of the culture or heritage [16], [24], [26]. Previous studies showed that the natural and cultural conditions bring about a positive and attractive experience for the tourism destination.
Infrastructure is the road systems and means
of transport serving the moving, staying or visiting of tourists. This is clearly shown in the studies of Duc and Kien [6], Lin et al. [16], Nguyen Dinh Tho [19], and Piewdang et al. [20]. A good infrastructure system will contribute to attracting people, including tourists, from other places to the locality.
The support of local authorities at tourist sites
creates a positive and impressive effect for visitors when exploring and travelling locally. This support is evident through administrative services, information systems, visitor guidance and support, security, and a hotline to respond to incidents [6], [19], [20].
Therefore, the destination image can be measured by many different factors and it has an impact on visitor satisfaction, loyalty and intention to return. This result is shown in many studies so far [2], [4], [6], [21], [26], [28], [29], [30], [34].
2) Emotional Value
According to Sweeney and Souter [29], emotional value is the state or emotion of consumers when buying products and services as well as their impressions in using these products and services.
Meanwhile, for the tourism field in particular, the emotional value of visitors is assessed by their feelings of safety, sense of discovery, and feelings of excitement when experiencing travel at the destination [33]. Many studies show that emotional value affects visitors’ satisfaction and loyalty [7], [8], [9], [14], [32].
3) Guests' Satisfaction
Satisfaction is the emotional state resulting from the use of products and services [27]. Satisfaction is a concept used to measure a person's level of feeling based on comparing the results obtained from consuming a product or service with his or her expectations. For tourism services, visitors’ satisfaction involves their feeling and emotional state after experiencing the tourist destination compared to their expectations before arrival. Satisfaction positively affected visitor loyalty in studies by Chen and Chen [3], Duc and Kien [6], Horng et al. [12], Hung and Petrick [14], Lee [15], Yoon and Uysal [33]. Meanwhile, Thuy and Tuan [30] and showed that the greater the visitor satisfaction, the higher their stimulation, which greatly influences their intention of returning and helps them gain more experiences to share with the people around them.
4) Loyalty
Customer loyalty is a term used to indicate repeat purchases, or the demonstration of a consistent attitude when using a supplier’s service [10]. In the field of tourism, visitor loyalty to a destination involves commitment, engagement, familiarity, and willingness to return in the future. Visitor loyalty is an area of great concern for many actors, including destination marketers. This importance results from the fact that the greater a visitor’s loyalty, the lower the cost of attracting or retaining visitors [5]. Tourists loyalty to a destination is considered as a hobby or intends to return to the destination that visitors experience and will intend to introduce others to that place. Loyalty is expressed through the referring of destinations to others, returning in the future and encouraging family participation [12], [15], [23], [33], [34].
5) Intention to Return
Many previous studies have confirmed that intention to return indicates a visitor’s willingness to come back to the same destination. This level is expressed through awareness and commitment to return to the destination; at the very least, it means introducing and encouraging friends and family to visit [4], [21], [26], [28], [30], [31], [33].
Researched in many studies, visitors’ intention to return involves many factors, including the destination’s image, satisfaction, and loyalty [12], [15], [23], [33], [34].
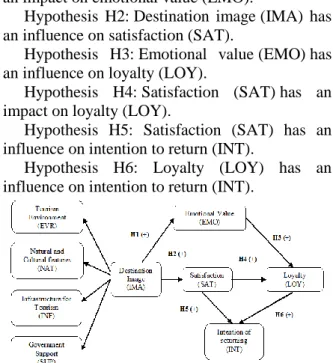
B. Theoretical Research Model
Based on the results published in numerous previous articles, the authors propose a
theoretical research model with the following hypotheses:
Hypothesis H1: Destination image (IMA) has an impact on emotional value (EMO).
Hypothesis H2: Destination image (IMA) has an influence on satisfaction (SAT).
Hypothesis H3: Emotional value (EMO) has an influence on loyalty (LOY).
Hypothesis H4: Satisfaction (SAT) has an impact on loyalty (LOY).
Hypothesis H5: Satisfaction (SAT) has an influence on intention to return (INT).
Hypothesis H6: Loyalty (LOY) has an influence on intention to return (INT).
Figure 1. Model and hypotheses
III. D
ATA ANDR
ESEARCHM
ETHODOLOGYA. Data Collection and Sample Size
To test the research hypotheses, data have been collected from interviews with nearly 290 tourists visiting the national park. The data collection was done by interviewing tourists directly and having them fill out an independent questionnaire. This process was performed from May 2019 to July 2019. After eliminating incomplete answer sheets, 270 questionnaires were processed. According to Bollen [1], the sample size in normal studies should be five times larger than the number of observations used for measurement (ratio 5:1). As such, the sample of 270 visitors is perfectly suitable. The results of the study were analyzed using SPSS software, AMOS.
1) The Scale
The study’s scale was designed based on questionnaire with 35 observations and using the five-point Likert scale. This questionnaire was developed and revised through several steps: reviewing and evaluating the initial research review; interviewing experts who are local tourism managers, tourism lecturers at some universities for their opinions; trial interviews with small sample sizes with 30 random tourists.
The environment tourism scale (EVR) consists of five observations; the infrastructure for tourism scale (INF) consists of
four observations; the natural and cultural characteristics scale (NAT) consists of five observations; the support of local government scale (SUP) consists of four observations; the emotional value scale (EMO) consists of four observations; the visitor satisfaction scale (SAT) consists of four observations; the loyalty scale (LOY) consists of four observations; and the intention to return scale (INT) consists of five observations. Table 1.
Dimesions of and scales
Symbol Scales and dimensions Source
I. Image of destination IMA
1. Travel environment (EVR)
[2], [21] EVR 1 I feel safe travelling here
EVR 2 Residents are friendly and polite EVR 3 The environment in this national park is
very clean
EVR 4 The management activities at this national park were well implemented
EVR 5
The information about this national park is clear, detailed
and easily accessible
2. Natural and cultural characteristics (NAT)
[2], [16], [21] NAT 1 This national park has poetic scenery NAT 2 The scenery at this national park is very
impressive
NAT 3 The history of spiritual places is special
NAT 4
The environment and atmosphere at this national park are clean and free of pollution
NAT 5 There are many impressive and unique souvenir products
3. Tourism infrastructure (INF)
[6], [16], [19] INF 1
The transport system leading to this national park is good and congestion rarely occurs
INF 2 Transportation to this national park is convenient
INF 3
The infrastructure system in this national park is organized and arranged to convenient
INF 4 Places to stay before, during and after traveling are easy to find
4. Local government support (SUP)
[6], [19], [28] SUP 1 The government has timely hotlines to
assist visitors
SUP 2 Security systems at tourist destinations ensure safety for visitors
SUP 3 There are media programs to raise awareness for residents and visitors SUP 4 Request of public information of prices
of tourism products and services
II. Emotional value (EMO)
[35] EMO1 This national park creates a sense of
excitement
EMO2 This national park creates a stimulation for visitors
EMO3 This national park feels romantic EMO4 This national pPark creates a sense of
desire to explore
III. Satisfaction (SAT)
[3], [15], SAT1 I feel there are many benefits in traveling
Symbol Scales and dimensions Source
to this national park [22]
SAT2 I feel there many benefits when traveling to this national park
SAT3 The trip was very good, as how I expected
SAT4 Overall, I am pleased to have visited this national park
IV. Loyalty (LOY)
[17] LOY1
I always choose Phong Nha Ke Bang as my first choice over other tourist destinations
LOY2
I will endeavour to come back to this national park again because it is the best choice for me on tourism
LOY3 I will be a loyal visitor of this national park
LOY4 I would recommend this national park to everyone
V. Intention to return (INT)
[4] INT1 I am ready to return to travel to this
national park
INT2 I would consider this national park a future sightseeing option
[18] INT3 I will introduce others to this national
park
INT4 I encourage friends and relatives to come to this national park
INT5 I would recommend the destination is this national park to friends and relatives
B. Methods of Analysis
To achieve the research goal the authors used SPSS and AMOS 20 software to carry out the research method with the following steps.
1) Testing the Scales
The Cronbach' Alpha (CRA) reliability coefficient technique was used in this study. The authors agree that when the CRA is greater than 0.8, reliability is obtained.
The Exploratory Factor Analysis (EFA) analysis technique was also used to measure the value of the scale. Variables with insignificant correlation coefficients were removed from the scale. Criteria for selecting items had to have factor loading of > 0.4, a total extraction variance of ≥ 0.50, and a KMO test coefficient of > 0.05 [11].
2) Model Testing
The authors used Confirmatory Factor Analysis (CFA) and linear Structural Equation Modelling (SEM) analyses to consider the relevance of the research model when used to measure actual data. In this study, the suitability level was assessed through the following criteria: TLI > 0.90 [11], RMSEA < 0.07 [11], p value > 0.05 [11], CFI > 0.95 [13], and Chi-square / df. ratio < 5 [25].
IV. R
ESULT ANDD
ISCUSSIONBased on the survey results of 270 visiting tourists as mentioned above, the
authors analyzed the impact of each specific factor based on the initial theoretical model. The result is presented as follows:
A. Descriptive Statistics
In Table 3, the sample details of the 270 participants surveyed showed that male visitors accounted for the higher proportion than female visitors, that the age of the visitors was relatively equal, but that the group aged 35 and under accounted for 54.4% of people surveyed. The number of indigenous visitors participating in the survey was larger than that of foreign visitors, and most participants had average incomes. Table 2.
Descriptive statistics (authors' survey, 2019)
Characteristics Frequency Percent
1. Gender N = 270 100%
Male 115 42.6%
Female 155 57.4%
2. The age of the visitors N = 270 100%
Under 25 years old 66 24.4
From 26 to 35 years old 81 30.0
From 36 to 45 years old 41 15.2
From 46 to 55 years old 42 15.6
Over 56 years old 40 14.8
3. Type of tourist N = 270 100%
Native 191 70.7
Foreign 79 29.3
4. Income of visitors N = 270 100%
Less than VND 9 million 187 69.3
From 10 million to 15 million VND 67 24.8
Over VND 15 million 16 5.9
Table 3.
Test results of Cronbach's alpha coefficients on scales (authors' research, 2019)
Concept Symbol Number of
obs. variable
Cronbach's alpha
Independent variables
Image of destination IMA
Tourism environment EVR 5 .907
Natural and cultural
characteristics NAT 5 .895
Infrastructure for
tourism INF 4 .897
Government support SUP 4 .856
Emotional value ECO 4 .831
Dependent variables
Visitor satisfaction SAT 4 .902
Loyalty LOY 4 .928
Intention to return INT 5 .898
B. Testing Cronbach's Alpha Coefficients
Based on the data in Table 4, we concluded that the scales ensure reliability and all observed variables will be used in subsequent analyses.
C. EFA and CFA Analysis
1) EFA Analysis of the Factors
From the survey results, the data is analyzed to discover the factors, with the following results: Table 4 .
EFA analysis of the factors (authors' survey data, 2019)
Variables Factors 1 2 3 4 5 6 7 8 EVR5 .847 EVR2 .825 EVR4 .825 EVR3 .823 EVR1 .806 INT2 .876 INT5 .847 INT1 .833 INT3 .832 INT4 .761 NAT4 .899 NAT2 .872 NAT1 .829 NAT3 .814 NAT5 .683 SAT1 .919 SAT4 .852 SAT2 .829 SAT3 .816 INF1 .932 INF4 .915 INF3 .760 INF2 .739 LOY1 .842 LOY4 .821 LOY3 .794 LOY2 .778 SUP1 .822 SUP3 .783 SUP4 .769 SUP2 .695 EMO4 .788 EMO3 .689 EMO2 .674 EMO1 .671 Eigenvalue Max = 8.426; Min = 1.050
Cumulative % 24.076 74.691 Kaiser-Meyer-Olkin (KMO) .851 Bartlett's test Chi-square 7057.846 DF 595 Sig. .000
The results of the analysis show that KMO, P-value indicators are 0.000 < 0.05, extracted
variance, factor loading, eigenvalue coefficients are guaranteed and the factors of the research model are suitable.
2) The Results of CFA Analysis
From Table 5, we see that the credibility recombination, variance extracted is guaranteed.
Table 5.
C.R and AVE test (authors' survey data, 2019)
Symbol Number
of obs C.R AVE
1. Image of destination IMA Tourism environment EVR 4 .984 .941 Natural and cultural
characteristics
NAT 5 .938 .754
Infrastructure for tourism
INF 4 .878 .6 54
Government support SUP 4 .860 .614
2.Emotional value ECO 4 .965 .875
3.The satisfaction of visitors
SAT 4 .934 .781
4. Loyalty LOY 4 .985 .944
5. Intention to return INT 5 .908 .668
Figure 2. CFA results
From Figure 2, the indicators for df, p, GFI, RMSEA, Chi-Square/df, TFI, and CFI are reasonable. From there, the authors came to the conclusion that the model is perfectly appropriate.
D. Testing the Research Model and the Research Hypotheses
Based on the results of Figure 3, we find that the data are perfectly relevant. This confirms that the research model of the authors is completely consistent with the actual collected data. Thus, the conceptual relationships have achieved theoretical expectations.
Figure 3. SEM results
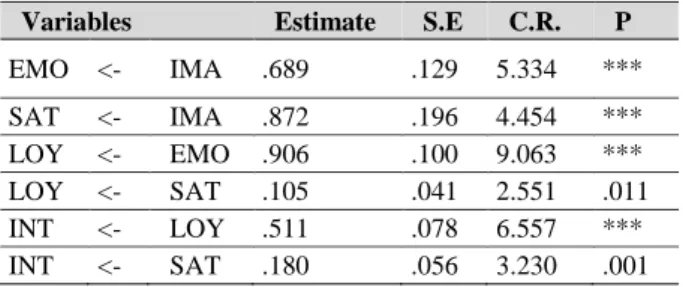
Table 6.
Test of hypotheses (authors' research, 2019)
Variables Estimate S.E C.R. P
EMO <- IMA .689 .129 5.334 *** SAT <- IMA .872 .196 4.454 *** LOY <- EMO .906 .100 9.063 *** LOY <- SAT .105 .041 2.551 .011 INT <- LOY .511 .078 6.557 *** INT <- SAT .180 .056 3.230 .001
Based on the results in Table 6, all six initial hypotheses are accepted and the experimental research model is completely meaningful. The authors continued to conduct experiments to test the demographic characteristics of the sample. The results show that in terms of gender, women have higher satisfaction levels, loyalty and intention to return than men. Meanwhile foreign tourists have a more positive difference
compared to native tourists. However, the study found that for different age groups and income groups, there was no statistically significant difference.
V. C
ONCLUSIONANDR
ECOMMENDATIONSResearch by authors conducted at this national park has determined that destination imagery influences satisfaction and loyalty of visitors as well as their intention to return. This result shows similarities with many previously published studies in a number of other tourist destinations and in different countries such as those conducted by Duc and Kien [6], Nguyen Dinh Tho [19], Thuy and Tuan [30], and many others [2], [4], [17], [18], [26], [33], [35].
In recent years, this national park has opened and attracted many tourists. The majority of visitors have many good impressions and are satisfied with this destination. However, to further improve the satisfaction and loyalty of visitors during their next visit, the authors have made the following recommendations:
This national park is a world heritage and a gem in need of protection, not only for Vietnam, but also for its international stature. Tourism development to raise local budget revenues, improve living standards, and raise the income of residents around the tourist site is important. However, preserving and enhancing the image and attractiveness of destinations that especially protect the natural landscape, environment, and wild natural atmosphere of the ecosystems is even more important.
Therefore, local government and residents must be aware of protecting and developing tourism activities in the heritage in a sustainable way. Besides, to create favorable conditions for tourists, local authorities should continue to improve transportation infrastructure, accommodation, and supplementary services for tourism, diversifying cultural activities to retain and create a better impression for visitors, especially native visitors.
Local tourism management authorities and leaders in this particular national park need to develop a tourism development strategy in addition to preserving a sustainable heritage system during different periods. This national park needs to develop professional customer support departments that take special care of visitors' feelings before, during, and after their experience here. Over the past several years, media promoting the image of this national park has gradually created an impression, boosting its popularity with visitors. However, more attention should be paid to ensuring the security and safety for tourists during their visit, strictly controlling the prices of goods and services provided to tourists at the tourist destination, and ensuring
security and enjoyment of an impressive travel experience.
According to the direct survey of the authors, visitors to this national park are up to 70% native tourists and 30% foreign tourists. For native tourists, the normal loyalty and intention to return are very low compared to foreign tourists. Therefore, this national park needs to consider investment in the intelligent tourists control system to recognize nationality, offering returning tourists appropriate and encouraging preferential policies.
Local authorities, especially tourism companies, also need to pay attention to the development and renewal of tourism programs to this national park, strengthening the linkages with other tourism destinations within and outside the the locality to diversify its tourism and support localities that attract tourists.
Although the initial research goal has been set, this study has certain limitations. One is that experimental surveys were only conducted in this national park, so the research coverage is limited. The research and survey time of the author group was conducted between May 2019 and July 2019, which only includes summer travel, so the representation may be limited. The research results are based on a survey of 270 visitors, a small fraction of the several hundred thousands visitors who come to this park, which reduces the general and representative level. Future study can survey a larger number of visitors. A longer survey period can also provide more complete, accurate and sufficient evaluation.
A
CKNOWLEDGMENTThe author would like to thank the Editor-in-Chief Professor Zhai Wanming and a reviewer for their helpful comments that in our view have helped to improve the quality of manuscript significantly.