Title The Role of Transcriptomics: Physiological Equivalence Basedon Gene Expression Profiles( 本文(Fulltext) ) Author(s) 三浦, 詩織 Report No.(Doctoral Degree) 博士(農学) 甲第672号 Issue Date 2017-03-13 Type 博士論文 Version ETD URL http://hdl.handle.net/20.500.12099/56220 ※この資料の著作権は、各資料の著者・学協会・出版社等に帰属します。
The Role of Transcriptomics:
Physiological Equivalence Based on
Gene Expression Profiles
(ࢺࣛࣥࢫࢡࣜࣉࢺ࣑ࢡࢫࡢᙺ㸸
㑇ఏᏊⓎ⌧ࣉࣟࣇࣝᇶ࡙ࡃ⏕⌮Ꮫⓗྠ➼ᛶ
)
2016
The United Graduate School of Agricultural Science, Gifu University
Science of Biological Resources
(Gifu University)
The Role of Transcriptomics:
Physiological Equivalence Based on
Gene Expression Profiles
(ࢺࣛࣥࢫࢡࣜࣉࢺ࣑ࢡࢫࡢᙺ㸸
㑇ఏᏊⓎ⌧ࣉࣟࣇࣝᇶ࡙ࡃ⏕⌮Ꮫⓗྠ➼ᛶ
)
CONTENTS
CHAPTER I. The role of transcriptomics: physiological equivalence based on gene
expression profiles · ··· 1
1 RNA and transcriptomics ··· 2
2 Methods of transcriptomics ··· 4
2.1 DNA microarray ··· 5
2.2 RNA-seq · ··· 7
3 Transcriptomics for physiological difference ··· 8
3.1 Evaluation for genetic background ··· 9
3.2 Evaluation for environmental effects ··· 10
3.3 Evaluation for toxicological damage ··· 13
3.4 Evaluation for diseases ··· 15
4 Transcriptomics for physiological equality ··· 17
4.1 Capacity ··· 17
4.2 Reproducibility ··· 19
4.3 Stability ··· 21
4.4 Margin of safety ··· 23
CHAPTER II. Oligonucleotide microarray analysis of dietary-induced hyperlipidemia
gene expression profiles in miniature pigs ··· 30
1 Introduction ··· 31
2 Materials and methods ··· 34
3 Results ··· 40
4 Discussion ··· 48
5 Conclusion ··· 57
CHAPTER III. Evaluation of the physiology of miniature pig fed Shochu distillery waste using mRNA expression profiling ··· 76
1 Introduction ··· 77
2 Materials and methods ··· 79
3 Results ··· 83
4 Discussion ··· 88
ACKNOWLEDGMENTS ··· 99
1
CHAPTER I
The role of transcriptomics: physiological equivalence
based on gene expression profiles
2
1. RNA and transcriptomics
The “Central dogma of molecular biology”, as defined by Francis Crick, explains the flow of genetic information within a biological system (Crick, 1970). This concept states that genetic information encoded in DNA is transcribed to RNA, and RNA is translated to protein. The biological activities of cells, tissues, and organisms are based on the central dogma of molecular biology. RNA is an important factor required to mediate gene and protein expression. There are two types of RNA, non-coding RNA (ncRNA) and messenger RNA (mRNA or protein-coding RNA). ncRNAs play several key roles in gene regulation including transcriptional and post-transcriptional regulation, regulation of alternative splicing, control of transcription factor binding, chromatin modification, and protein-coding RNA stabilization (Louro et al., 2009; Pertea, 2012) (Table 1). ncRNAs include ribosomal RNA (rRNA) and transfer RNA (tRNA) and are classified into two broad groups by size. Long ncRNAs (lncRNA) are greater than 200 nucleotides and small ncRNAs (sncRNA) are 200 nucleotides or less. lncRNAs include large intergenic ncRNAs, long intronic ncRNAs, antisense RNAs, and pseudogene RNAs. lncRNAs play critical and specialized roles in numerous biological processes including the regulation of gene expression, and pre- and post-transcriptional modulation of epigenetic regulation (Rinn and Chang, 2012; Guo
3
et al., 2015). sncRNAs also have several functions: microRNAs (miRNAs) and small interfering RNAs (siRNAs) modulate post-transcriptional gene expression by binding to specific mRNAs; small nucleolar RNAs chemically modify rRNAs and other RNAs; and piwi-interacting RNAs inhibit transposon function through the PIWI protein, and maintain genomic constancy in germline cells. Other ncRNAs include small nuclear RNA, transcription initiation RNA, X-inactivation RNA, and promoter-associated RNA. Dysfunction of ncRNA is associated with complex diseases such as cancer, and neurological, developmental, and cardiovascular diseases (Taft et al., 2010; Esteller, 2011). More than 90% of the genome is transcribed into RNA, and it is estimated that mRNA constitutes approximately 62% of the transcripts (Pertea, 2012). mRNA plays a key role in transcription and reflects the information of almost all expressed genes. The complete set of mRNA, or primary transcripts, under a specific condition or in a specific cell is defined as the “transcriptome”. Transcriptomics is the study of the transcriptome and enables researchers to elucidate gene expression dynamics under different circumstances. This leads to a deeper understanding of the function of each gene in the genome, and the regulation of gene expression, and aids in the elucidation of molecular mechanisms of abnormal states such as diseases.
4
In this study, we describe the general application of transcriptomics and recommend approaches for analyzing whole genome expression profiling data. Additionally, we performed two microarray experiments using pig model for evaluation change and constancy respectively.
2. Methods of transcriptomics
The transcriptome is complex. Over the past decade, several approaches have been developed to elucidate its intricacy and recent dramatic advances in analytical technologies have allowed researchers to further appreciate the transcriptome. In the 1990s, expressed sequence tag (EST) sequencing was employed to rapidly identify expressed genes and gene fragments (Schuler et al., 1996). Although EST sequencing is a high-throughput technique, it is expensive. Tag-based methods including serial analysis of gene expression, cap analysis of gene expression, and massively parallel signature sequencing were developed, but were unable to discriminate between genetic isoforms and were very expensive to apply on a large scale. Microarray was developed for genome-wide analysis, and has become the most widely used approach for transcriptomics. Recently, RNA sequencing (RNA-seq) using next generation sequencing technology has allowed the transcriptome to be characterized, and the
5
number of studies using RNA-seq have gradually increased (Ghosh and Qin, 2010; Yu and Lin, 2016). Microarray and RNA-seq have become the main tools used in transcriptome research. These tools allow us to simultaneously analyze the expression of a large number of genes and to focus on physiological equivalence. Several studies have compared the accuracy of microarray and RNA-seq measurements (Marioni et al., 2008; Fu et al., 2009; Su et al., 2011; Zhang et al., 2015). It was found that the biological interpretation of detected genes was mostly consistent between the data of the two technologies, and that RNA-seq provides better detection sensitivity than does microarray. To validate the accuracy of these techniques, it is necessary to quantitatively evaluate the expression levels of genes detected as having altered expression by DNA microarray or RNA-seq. Therefore, Real-Time Reverse-Transcriptase PCR is performed after global analysis in most studies.
2.1 DNA microarray
DNA microarray analysis was established in 1995 as a new technology to analyze gene expression (Schena et al., 1995). Since then, microarrays are being widely used across biological disciplines. The number of published papers using the technology continues to increase, as does the number of commercial suppliers of
6
microarrays, associated reagents, and analysis hardware and software (Kawasaki, 2006; Yauk and Berndt, 2007).
The microarray technique is based on the basic principle of "DNA Hybridization" and uses DNA chips consisting of many oligonucleotides (probes) spotted onto a glass slide. Probes are deposited onto glass slides via the direct (in situ) synthesis of oligonucleotide probes onto the chip surface using photolithographic methods (Gao et al., 2004) or by deposition methods, which include contact-spotting using pins and deposition by ink jet (Hughes et al., 2001; Sethi et al., 2008). Presently, these arrays comprise mostly 40- to 70-mer oligonucleotides spotted on a glass slide. This technique makes it possible to semi-quantitatively measure the expression levels of large numbers (1,000-40,000) of genes simultaneously. In conjunction with computational analysis tools, microarray analysis enables the identification of genes that vary in expression in different biological contexts (Schena et al., 1995; Quackenbush, 2001).
The microarray method consists of several processes. Total RNA is extracted from the sample and reverse-transcribed into complementary DNA (cDNA). cDNA is labeled with fluorescent dyes, hybridized to the DNA chip, and scanned to produce microarray image data. The intensity of fluorescence, which reflects the degree of
7
hybridization and transcript copy number, is digitized by appropriate software. However, microarray has several limitations including requiring information about genome sequence to produce the oligonucleotides, and inaccuracy of data owing to high background from nonspecific cross-hybridization.
2.2 RNA-seq
RNA-seq is a new approach involving next-generation sequencing and allows a quantitative analysis of all expressed genome regions (Wang et al., 2009). The RNA-seq method consists of several steps: extraction of total RNA, reverse transcription of RNA to cDNA, construction of a cDNA fragment library, sequencing using a high throughput sequencing platform, generation of single-end or paired-end reads 30–400 base pairs in length, and sequence alignment (Wang et al., 2009; Griffith et al., 2015). Recently, a method allowing direct single molecule RNA sequencing, without prior conversion of RNA to cDNA, was reported (Ozsolak et al., 2009).
RNA-seq captures RNA directly to build a sequence, allowing for the detection of new transcription products, fused sequences, and single nucleotide polymorphisms of unknown genes without gene-specific biases. Additional advantages of RNA-seq
8
include low background noise, large and dynamic signal range, and detection with no requirement for prior sequence information. More recently, RNA-seq has emerged as the preferred approach for genome-wide expression analysis (Wang et al., 2009; Rowley et al., 2011; Su et al., 2014) .
3. Transcriptomics for physiological difference
DNA microarray and RNA-seq technology provide a wide range of novel application opportunities relating to gene expression profiles, which can be applied to various studies. The availability of transcriptomic technology has provided new opportunities for researchers to characterize global gene expression profiles. Recent advances in transcriptomics have allowed us to identify specific genes, gene families, and pathways associated with biological responses. The mechanisms regulating biological reactions, as well as the identification of genes implicated in these responses, are of great interest to the research community. These techniques could serve to assign functions to previously unannotated genes and to allocate gene groups to functional pathways (DeRisi et al., 1996; Han et al., 2015). Additionally, these techniques contribute to our understanding of biological mechanisms and responses to environmental stimuli (Miller and Tang, 2009). The identification of differentially
9
expressed genes is helpful to show the biological distinction and physiological difference between two different sets of conditions.
3.1 Evaluation for genetic background
Organisms sustain biological activity based on information contained within the genome. The characteristics of the individual are distinctively determined by genetic information, the expression of which defines the phenotype (sex, aging, tissues, individuals, and species). Detection of genes differentially expressed between these phenotypes helps to characterize the sample and allows us to evaluate individual subjects.
Differences in gene expression resulting from changes in intrinsic conditions such as sex (Balakrishnan et al., 2012; Blekhman et al., 2010; Conforto and Waxman, 2012; Jansen et al., 2014; Caetano-Anolles et al., 2015; Sakashita et al., 2015) and aging (Brink et al., 2009; Wilson et al., 2010; Takahashi et al., 2011; Naumova et al., 2012; Steegenga et al., 2014; Roux et al., 2015; Wei et al., 2015) can be identified using microarray and RNA-seq techniques. Liu et al. (2013) reported that aging results in sexually dimorphic changes in the skeletal muscle transcriptome, and they detected differential expression of genes related to oxidative
10
phosphorylation, immune function, and muscle protein catabolism. Data show that gene expression dynamics related to aging vary according to sex, and suggest that older women tend to be more predisposed to loss of muscle function with aging. Many studies show that normal tissues have their own gene expression profiles and have identified organ specific gene sets that are highly expressed in a tissue selective manner in the mouse (Su et al., 2002), rat (Walker et al., 2004), dog (Briggs et al., 2011), pig (Hornshøj et al., 2007), and human (Hsiao et al., 2001; Shmueli et al., 2003; Son et al., 2005; Kilpinen et al., 2008). Transcriptomics can also be used to compare gene expression data across species (Chan et al., 2009; Merkin et al., 2012; Sudmant et al., 2015). These studies provide new insights into the molecular basis of tissue and organismal diversity. Transcriptomics can be used to identify genes that contribute to this diversity, and can be utilized to build a biological gene database.
3.2 Evaluation for environmental effects
Recent progress in transcriptomics enables us to identify genes and pathways associated with responses to exogenous abiotic stresses (Ma et al., 2012; Jogaiah et al., 2013; Deshmukh et al., 2014; Evans, 2015). Many studies have used DNA
11
microarrays to infer how organisms respond to different environments (Gracey and Cossins, 2003; Cossins et al., 2006; Gracey, 2007; Evans and Hofmann, 2012), such as temperature (Murata et al., 2006; Yang et al., 2010; Long et al., 2012; Aguado-Urda et al., 2013; Logan and Buckley, 2015), osmolality (Posas et al., 2000; Evans and Somero, 2008; Melamed et al., 2008; Halbeisen and Gerber, 2009), oxygen (Ton et al., 2003; Garnczarska, 2006; Swiderek et al., 2008; Otsuka et al., 2010; Gracey et al., 2011; Shinde et al., 2015) and pH (Leaphart et al., 2006; Serrano et al., 2006; Worden et al., 2009; Evans et al., 2013). Detection of genes with expression changes in response to environmental change helps to predict the fragility, resistance, and adaptability of an organism, tissue, or cell in the environment. Additionally, genes with constant expression in the presence of environmental change can be identified and are potentially important for overall survival. Transcriptomics using RNA-seq in fishes have reported many new genes that participate in metabolic functions, protein folding and degradation, developmental processes, oxygen transport, and protein synthesis (Liu et al., 2013). These studies have also identified heat shock protein genes that are differentially expressed following alterations in temperature (Liu et al., 2013; Smith et al., 2013). Coble et al. (2014) identified differential expression of genes related to decrease
12
internal temperatures, reduced hyperthermia-induced apoptosis, and promotion of tissue repair occurring in the liver of heat-exposed broiler chickens. In addition, they also found that the expression of genes involved in the regulation of perturbed cellular calcium changes following heat exposure.
Moreover, an adaptive response to various exogenous environmental stresses, including osmotic pressure and starvation, was validated at a genome level using RNA-seq (Xia et al., 2013; Johnson et al., 2015). RNA-seq is being applied to study the stress response similar to how microarray is being used assess the physiological state.
Transcriptomics has been especially useful in the field of experimental embryology, where it has been used to evaluate the in vitro and in vivo environments. Transcriptomic data of embryonic cells produced in vitro and those developed in vivo have been compared in the mouse (Ren et al., 2015), pig (Østrup et al., 2013; Whitworth et al., 2015), bovine (Driver et al., 2012; Degrelle, 2015), and sheep (Wei et al., 2016). These studies have identified crucial discordances between the in vitro and in vivo expression of several genes and gene pathways. Individual genes, and pathways, function in complex biological processes. Minor changes in the expression of several genes may perturb a pathway and possibly have drastic
13
biological effects (Han et al., 2015). Transcriptomics helps researchers to identify differences in embryo gene expression in vivo and in vitro. These analyses may assist in improving culture conditions so that in vitro analyses can more accurately represent in vivo physiological conditions.
3.3 Evaluation for toxicological damage
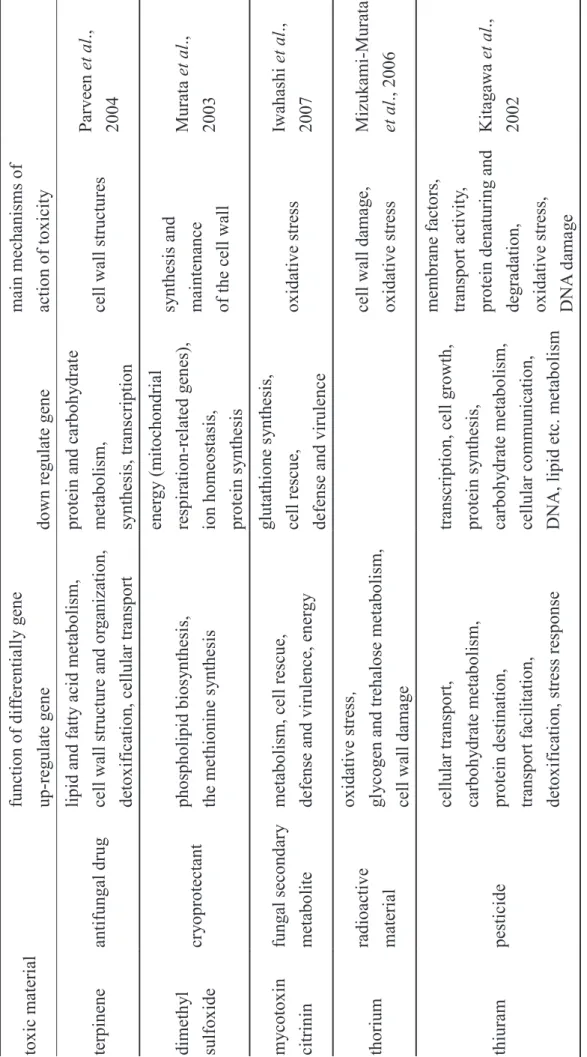
Evaluation of chemical stress or toxicogenomics is critically important for transcriptome analysis. Afshari et al. (1999) and Nuwaysir et al. (1999) demonstrated the efficacy of microarray as a tool for assessing chemical and environmental toxicity in a bioassay. Our group has applied microarrays to examine the molecular response of a yeast model using various toxic materials. We have detected differentially expressed genes and determined the mechanism against the toxic matter for each of terpinene (Parveen et al., 2004), dimethyl sulfoxide (Murata et al., 2003), mycotoxin citrinin (Iwahashi et al., 2007), thorium (Mizukami-Murata et al., 2006), cadmium (Momose and Iwahashi, 2001), and thiuram (Kitagawa et al., 2002) (Table 2).
The application of microarray to toxicogenomics is not limited to yeast cells. Various different models are being used to assess cadmium stress, including fungus
14
(Zhao et al., 2015), plants (Oono et al., 2014; He et al., 2015; Xu et al., 2015; Oono et al., 2016), fish (Bougas et al., 2013), mollusk (Meng et al., 2013), mouse (Hu et al., 2014), and human cells (Cartularo et al., 2016). Huang et al. (2012) reported that perfluorooctane sulfonate affects the expression of genes related to neurobehavioral defects, mitochondrial dysfunction, and the metabolism of proteins and fats. Identification of differentially expressed genes helps to reveal statistical significance (e.g. fold change and significance test) and/or biological significance (Tseng et al., 2012) and to clarify the mechanisms regulating adaptive responses. RNA-seq can also be applied to study toxicogenomics and has been used to evaluate changes in miRNA expression in response to multiple environmental factors including arsenic (Zhang et al., 2016), cigarette smoke (Beane et al., 2011; Hackett et al., 2012), the carcinogen benzo[a]pyrene (Van Delft et al., 2012) and gamma-irradiation (Moskalev et al., 2014).
We are exposed to many substances that can have a direct or indirect influence on us including drugs, additives, and toxic chemicals. Risk assessment for these materials using transcriptomics is a means to evaluate the degree of toxicity, or risk, that such substances pose to an organism.
15
3.4 Evaluation for diseases
Comparison of genome-wide expression patterns among patient samples presents us with measurable information and helps to identify genes that would be reasonable targets for therapeutic intervention (Afshari et al., 1999; Chin and Kong, 2002; Dudda-Subramanya et al., 2003; Saei and Omidi, 2011). The invention of technologies for transcriptomics, using genome-wide analysis and computational approaches, has made it possible to identify the prognostic significance of individual gene expression changes from thousands of markers. For example, in cancer studies, this technology is employed to obtain comprehensive gene expression profiles in both normal tissues (Saito-Hisaminato et al., 2002) and cancer tissues including those from hepatocellular carcinomas, pancreatic cancers, and esophageal squamous cell carcinomas (Okabe et al., 2001; Han et al., 2002; Macgregor, 2003; Nakamura et al., 2004; Yamabuki et al., 2006; D’Angelo et al., 2014; Zhu and Tsao, 2014; Nishimura et al., 2015). Using microarrays, biomarkers for Parkinson’s disease (Alonso-Navarro et al., 2014; Sun et al., 2014) and myocardial infarction (Devaux et al., 2010; Głogowska-Ligus and Dąbek, 2012) have been identified. Additionally, DNA microarrays are used to study complex diseases, in which hundreds of genes are often implicated, such as allergies,
16
diabetes, and obesity (Rome et al., 2009; S. Wang et al., 2009; Rodríguez-Acebes et al., 2010; Liu et al., 2013; Lu and Liao, 2015). Some reports indicate that these diseases rely on multiple gene interactions, rather than changes in a single causal gene, and that many different mechanisms and pathways are linked together (Benson and Breitling, 2006). While more illness biomarkers have been identified using microarray, RNA-seq is emerging as a very powerful tool to identify biomarkers of cancer (Wood et al., 2007; Berger et al., 2010; Pflueger et al., 2011; Cancer Genome Atlas Research Network., 2013; Fumagalli et al., 2014; Kosti et al., 2016), Alzheimer’s disease (Satoh et al., 2014), tuberculosis (Zhang et al., 2014), and cirrhosis (Tan et al., 2014). RNA-seq may be a more suitable platform for the search of precise biomarkers than traditional omics approaches, including microarray or proteomics because of its ability to detect novel genes/exons, RNA editing, fusion transcripts, and allele-specific expression. Still, RNA-seq does have limitations and issues resulting from several biases including experimental/technical procedures, downstream computational analyses, and informatics infrastructures (Costa et al., 2013).
Genome-wide analysis has boosted the biomarker diagnostics industry and contributes to disease subtype classification, disease diagnosis and prognosis,
17
selection of therapeutic treatments, and disease prevention (He et al., 2006; Sun et al., 2013; Su et al., 2014; Aibar et al., 2015).
4. Transcriptomics for physiological equality
Most transcriptome analyses have been aimed at detecting genes with altered expression levels. Many researchers analyze expression patterns to identify a characteristic expression pattern following exposure to change, as detailed in the previous section. Although transcriptome analysis has been a powerful tool for biological and biomedical studies, it remains to be determined whether these technologies can be applied with high accuracy and precision. Proof of invariability or/and constancy of gene expression profiles provides internal evidence of biological stability. Transcriptome analysis enables us to check the technical/biological uniformity using genome-wide screening for gene expression.
4.1 Capacity
Gene expression profiles reflect biological capacity and vary according to the situation at the time. For example, expression profiles change during the process of differentiation and generation (Mansergh et al., 2009; Goggolidou et al., 2013;
18
Iruretagoyena et al., 2014; Shiraki et al., 2014; Alonso-Martin et al., 2016). DNA microarray is tool used to evaluate cell properties by comparing the expression profiles of all genes. In some stem cell research reports, the degree of differentiation and development is evaluated by examining the similarity of gene expression patterns. Global gene-expression patterns were compared between human induced pluripotent stem (iPS) cells and human embryonic stem (ES) cells using oligonucleotide DNA microarrays (Takahashi et al., 2007). A high correlation of global gene-expression patterns was found between iPS cells and ES cells, suggesting that established iPS cells are similar to ES cells. Hrvatin et al. (2014) reported that differentiated human stem cells are analogous to fetal β cells rather than adult β cells. Mishra et al. (2008) demonstrated that human bone marrow-derived mesenchymal stem cells exposed to tumor-conditioned medium over a prolonged period assumed a carcinoma associated fibroblast-like myofibroblastic phenotype. Handel et al. (2016) generated transcriptome data to compare iPS cell derived neurons to human fetal and adult brain and indicated that iPS cell-derived cortical neurons closely resembled primary fetal brain cells. Tanaka et al. (2013) confirmed that the human iPS cell derived myogenic differentiation cells were similar to those of perfectly differentiated human
19
myoblast cells and quite divergent from those of undifferentiated iPS cells. Therefore, transcriptomics provides evidence for the establishment of cell-specific identities.
Moreover, Datson et al. (2007) reported the comparison of gene expression profiles between tissues in the same individual. This study reported that a high correlation coefficient was obtained when comparing gene expression in marmoset neuronal tissues (hippocampus and cortex) indicating a high degree of similarity in expression profiles. Additionally, comparison of hippocampal gene expression with that of all peripheral tissues resulted in a severe drop in the correlation coefficient. Thus, transcriptome analysis is useful to demonstrate biological similarity between cells or tissues, and for the determination of genetic characteristics.
4.2 Reproducibility
Biological experiments need to be reproduced multiple times under the same experimental conditions. To demonstrate evidence of reproducibility is important for data to be comparable (Chen et al., 2007; Darbani and Stewart, 2014). The Micro Array Quality Control (MAQC) project was established to construct quality control and standardization tools using four titration samples which are measured
20
on seven microarray platforms and three alternative gene expression technologies. The MAQC project had already proven the reproducibility of microarray data by the quantitative signal values and the qualitative detection calls (MAQC Consortium et al., 2006). To validate and extend these observations, numerous researchers have independently validated microarray data (Yang et al., 2002; Burgoon et al., 2005; Guo et al., 2006; ’t Hoen et al., 2008).
In addition to the technical reproducibility of microarray results, biological and physiological reproducibility are also important. Iwahashi et al. (2009) and Takahashi et al. (2012) demonstrated the importance of reproducibility of expression profiles among individuals under the same experimental conditions. This reproducibility proved the stability of an experimental protocol that affected the biology and physiology. Therefore, the reproducibility of gene expression patterns observed under the same experimental conditions suggests that the experimental and analysis methods used are stable and robust. However, MAQC does not provide conclusions related to inter-platform compatibility. There are differences in the fluorescent intensities measured by different platforms, and even within each platform site-by-site variability exists (Chen et al., 2007).
21
Reproducibility of RNA-seq has been demonstrated by multi-group reports (Tang et al., 2015), across laboratories (’t Hoen et al., 2013), and among technical replicates (Marioni et al., 2008; Mortazavi et al., 2008; Anders and Huber, 2010; Bullard et al., 2010; Ozsolak et al., 2010; Roberts et al., 2011). Danielsson et al. (2015) compared RNA-seq data sets of human brain, heart, and kidney samples from different laboratories and studies and concluded that RNA-seq expression measurements show global consistency after log transformation and elimination of batch effects. To establish the reproducibility and comparability of RNA-seq, the RNA Sequencing Quality Control (SEQC) project was constituted and coordinated by the Food and Drug Administration. The role of the SEQC is to assess the performance of RNA-seq across laboratories and to dissect different sequencing platforms and data analysis pipelines (SEQC/MAQC-III Consortium, 2014).
4.3 Stability
It is essential that there is a high correlation and reproducibility within and between replicated experiments (within established standards) for data to be considered reliable and robust (Yauk and Berndt, 2007). In 2001, the Functional Genomics Data Society (http://fged.org/) described the Minimum Information About a
22
Microarray Experiment (http://fged.org/projects/miame/) to establish a standard for recording and reporting microarray-based gene expression data (Brazma et al., 2001). They provide six factors for standardization: experimental design, array design, sample, hybridization, measurements, and normalization. However, this report does not indicate the most suitable standardized analytical methods, which may result in the variance of data.
To overcome the dispersion of microarray data, standardization is carried out in various experimental models such as yeasts (Mizukami et al., 2004; Taymaz-Nikerel et al., 2016), mice (Williams et al., 2004), rats (L. Guo et al., 2006), and non-human primates (Ebeling et al., 2011). Microarray is employed to prove the stability of both experimental conditions and experimental subjects. Iwahashi et al. (2009) used genomics to report on the physiology of medaka, which are used as a model animal for toxicity testing. Medaka mRNA expression was measured in individuals maintained within, as well as beyond, the Organization for Economic Cooperation and Development (OECD) guidelines for the fish acute toxicity test. They found that the toxic environment specified within the OECD guidelines did not affect the expression profiles of medaka and indicated that extraordinary conditions, beyond the guidelines, decreased reproducibility of data.
23
Takahashi et al. (2011) conducted microarray analysis to evaluate variations in whole blood gene expression patterns in different individual miniature pigs at different ages. The number of expressed genes and variation in gene expression intensity within miniature pigs of the same age were observed to converge with aging, and gene expression became uniform after 20 weeks of age. This report reveals the age at which genetic uniformity of the large animal model was reached. It is a basic concept of biological experiments that all conditions, except the variable being measured, must be the same. Demonstration of biological standardization and uniformity of genetic background using transcriptomics provides great value for laboratory animals in biological experiments. Such analyses allow for efficient and accurate experimental results and contribute to the standardization of breeding and rearing methods.
4.4 Margin of safety
Few studies have applied transcriptomics to the issue of food safety. We have introduced this new application of transcriptomics (Miura et al., 2016). We have used transcriptomics to demonstrate the safety of a diet consisting of a by-product of Japanese liquor production (shochu distilled water: SDW) for use as pig feed.
24
We evaluated the expression profiles of pigs fed with SDW, hyperlipid diet, and feed containing toxicant. We observed a high correlation between the gene expression profiles of the control and SDW feeding groups. Furthermore, the expression profiles of these two groups were different from those of the hyperlipidemia and toxicant model groups. These data indicated that feeding with SDW did not have a physiological effect on the pigs and assessed such feeding as safe. Therefore, microarray can be used to test foods and demonstrate proof of similarity with the normal state, making it a valuable approach for evaluating safety.
In the medical field, preclinical and clinical drug safety studies are a key prerequisite of the drug approval process. Non-human primates and pigs are important models for such studies. Ebeling et al. (2011) reported the genetic similarity of the non-human primate Macaca fascicularis to human. However, from the viewpoint of animal welfare, usage of these species in animal experiments has declined, and the opportunity of animal experimentation is limited. Active utilization of transcriptomics, which can obtain a large volume of information simultaneously, improves our understanding of the in vivo pharmacokinetics of model organisms and provides a significant contribution to the global “3R” animal
25
welfare initiative: reduce, refine, and replace animal experiments.
5. Conclusion
Transcriptomics has allowed us to simultaneously identify gene expression dynamics and differential gene expression. Transcriptomics is useful to identify illness biomarkers as well as biological responses to various stimulations and stresses, and plays a key role in advancing genomic and molecular biology research.
However, using this approach, we may overlook potentially important functions of genes that are not induced by the particular condition being examined. Not only should we concentrate on detecting specific differentially expressed genes, but we should also examine the entire expression profile. In addition, standardization of experimental conditions is essential and an absolute requirement for the legitimacy of the experiment. Uniformity of experimental conditions is brought about by adjustment of the technical, platform, and biological biases.
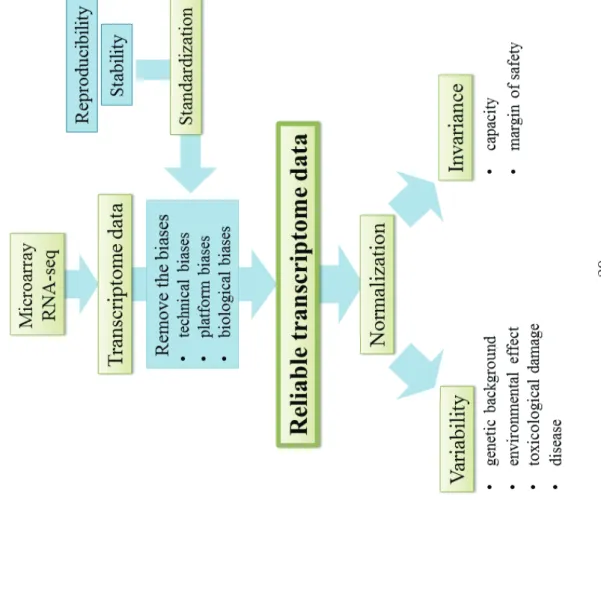
In conclusion, transcriptome analysis can be used to validate the standardization of an experiment by eliminating biological biases. As well as using transcriptomics to identify change or variability, we should take advantage of these approaches as
26
evidence of the invariance, constancy, and reproducibility of our system of interest (Figure 1).
27 Ta ble 1. L ist of major no n-coding RN As and their main functions Function cat eg or y Ty pe Functions protein synthesis rRNA ribosomal RNA Constituent of ribosomes tRNA transfe r RN A T ra nsport o f a m ino acids throug h ribosomes transcr iptional
modification, replication of DNA
snoRNA
small nucleolar RNA
Chemicall
y-modified o
f rRNA
and othe
r RNA; meth
ylation and the
ge ne spseudouridine mod ifica tion snRNA small nuclea r RNA Functions of pre-mRNA splicing , rRN A processing and histone mRNA 3' end-fo rmation reg ulation of ex pression piRNA PI WI -int er acti ng R N A
Inhibit the fun
ction of the transposon throu
gh P IW I protein, and maintains the g enomic constancy of the ge rmline cells miRNA micro RNA
Modulate the post
-transc riptional g en e ex pression b y bindin g to spec ific mRNA siR N A small interf erin g RNA Repress g ene ex pression after transcr iption ca lled the RNA int erfer ence (RNA int erf erenc e: R N Ai) xi R N A X-inac tivation RNA In activate an X c hromosome tiRNA transcr iption initiation R N A Reg ulation of tr anscr ipti on b y ta rg etin g epi gen etic silencing compl ex es lincRNA lar ge inter genic RNA
Repress the trans
criptome response d epend on p5 3 pRNA promoter -asso ciated RN A Mediate transc riptional gene sile ncin g and tr anscr iptional g en e acti vati on
28 Ta ble 2. Evaluation of to xicit y b y ye ast DNA microa rra y tox ic mater ial func tion of dif fere ntiall y ge ne main mec hanisms of action of tox icit y up-reg ulate gene down r eg ulate gene terpinene antifunga l dru g lipid and f att y acid metab olism, cell wa ll structure and or ga niz ation, detox ifica
tion, cellular transport
protein and ca
rboh
yd
rat
e
metabolism, synthesis, trans
cription cell wa ll structures Parve en et al ., 2004 dimeth yl sulfox ide cr yoprotectant phospholipid bios yn thesi s, the methionine s ynthesis ener gy (mitochondrial re spiration -r elated g en es) ,
ion homeostasis, protein s
ynthesis sy nthesis and maintena nce of the c ell wa ll Mura ta et al ., 2003 my co to xi n citrinin funga l second ar y metabolite
metabolism, cell rescue, defe
nse and virulenc e, en er gy gl utathione s ynthesis, cell rescu e, defe nse and virulenc e ox idative stre ss Iw ahashi et al ., 2007 thorium ra dioac tive material ox idative stre ss䠈 gl yc og en and treh alose metabolism, cell wa ll dama ge cell wa ll dama ge , ox idative stre ss Miz ukami -Mura ta et al ., 2006 thiuram pesticide cellular transpo rt, carboh yd ra te metabolism ,
protein destination, transport fa
cilitation, detox ifica tion, stress response transcr iption, ce ll grow th , protein s ynthesis, carboh yd ra te metabolism , cellular communica tion, DNA,
lipid etc. metaboli
sm membrane f actors, transport acti vit y, protein denaturin g and
degradation, oxidative stre
ss, DNA d ama ge Kitaga wa et al ., 2002
29 Fi gu re 1. Re commended workflow of tr anscr ipto m ics
30
CHAPTER II
Oligonucleotide microarray analysis of dietary-induced
hyperlipidemia gene expression profiles in miniature pigs
31
1 Introduction
Hyperlipidemia is well recognized as a risk factor for cardiovascular disease (CVD). As diet represents the most important determinant of hyperlipidemia, dietary animal models can be useful for the study of CVD progression (Lissner and Heitmann, 1995). High-fat, high- cholesterol, and high-sugar diets have been shown to induce hyperlipidemia, obesity, and insulin resistance in humans and rodents (Russell and Proctor, 2006; Oron-Herman et al., 2008; Radonjic et al., 2009). Dietary-induced hyperlipidemia pig models have also been established (Kobari et al., 1991; de Smet et al., 1997; Orbe et al., 2001; Bowles et al., 2004; Yin et al., 2004; C. Zhang et al., 2006; De Keyzer et al., 2009).
Compared to rodents, pigs are a useful animal model for elucidating the molecular mechanisms underlying the transition from a healthy state to the progression of diseases caused by hyperlipidemia because they are able to breed stably over a long period, and have a similar anatomy and digestive physiology to humans (Simon and Maibach, 2000; Lunney, 2007). In addition, miniature pigs are easier to breed and to handle than other non-primates are, making them a convenient species for preclinical tests (Vodicka et al., 2005). In September 2003, the Swine Genome Sequencing Consortium (SGSC) was formed to promote pig genome sequencing under international coordination (Schook et
32
al., 2005). The swine research environment has been enhanced since members of the SGSC announced a completed swine genome map in November 2009 (Archibald et al., 2010). To evaluate temporal changes in gene expression profiles with the progression of dietary-induced alterations, minimally invasive blood sampling, which allows for the direct measurement of immune-responsive blood cells, excels over other invasive biopsy techniques for disease diagnostics and assessment of drug responses, as well as health monitoring. If biomarker candidate genes can be identified from blood analyses, these may be useful for diagnosis in humans. Use of whole blood is preferable to other specimens on two accounts. Firstly, RNA expression and degradation are susceptible to artificial manipulations such as cell separation and extraction. Whole blood manipulation can reduce these risks via the use of RNA blood collection tubes. Secondly, whole blood is an attractive prime tissue due to its critical role in immune responses, metabolism, and communication with cells and the extracellular matrix in almost all body tissues and organs. Whole blood will depart from the normal state when a considerable alteration occurs in some blood cell subpopulations, tissues, or organs. Moreover, blood samples can be obtained repeatedly from miniature pigs, and blood RNA contains an enormous amount of information on the expression of messenger RNA and non-coding functional RNA molecules that are not translated into proteins.
33
Thus, analysis of blood RNA provides an opportunity to detect subtle changes in physiological state. We consider it particularly important to identify gene expression characteristics in whole blood. Microarray techniques allow the detection of genome-wide perturbations in response to different treatments and the measurement of various responses using a multitude of gene probes. Toxicogenomics, in which microarray techniques are specifically used in toxicology tests, has been widely recognized as one of the standard safety procedures for chemicals (Tong et al., 2003; Pennie et al., 2004; Williams-Devane et al., 2009). Gene expression microarrays have been used particularly for the screening of genes involved in specific biological processes of interest. Microarrays also allow the clustering of genes according to similar patterns of expression or functions. In this study, we conducted a series of whole blood microarray experiments to evaluate long-term alterations during 27-week feeding periods using specific pathogen-free (SPF) miniature pigs. There are two main types of dietary protocols for hyperlipidemia pig models, one with cholesterol and animal lipids (Kobari et al., 1991; de Smet et al., 1997; Orbe et al., 2001; Bowles et al., 2004; De Keyzer et al., 2009), and the other with cholesterol, animal lipids, and sucrose (Yin et al., 2004; Zhang et al., 2006). Some studies have focused primarily on a subset of genes, but this approach cannot elucidate whole blood RNA profiles during the process of
34
change. We selected two typical dietary protocols. One was a high-fat and high-cholesterol diet (HFCD) containing 15% lard and 2% cholesterol; the other was a high-fat, high-cholesterol, and high-sucrose diet (HFCSD) containing 15% lard, 2% cholesterol, and 37% sucrose. The present microarray analyses of whole blood were conducted according to the following aspects. The first analysis dealt with similarity among individuals based on the correlation coefficient. Variation among individuals of the same dietary group and between the different dietary periods was examined. The second analysis addressed the function of genes. Up- or down-regulated genes for each dietary protocol were examined by functional categorization. While whole blood RNA derives from white blood cell RNA, whole blood gene expression profiles may not entirely correspond to those of white blood cells (Takahashi et al., 2011). White blood cell microarray analyses conducted at the end of each dietary period are greatly influenced by diet, and the variations between the expression profiles of white blood cells and whole blood were assessed for each dietary group
2 Materials and Methods
Animals
35
1.5 m2 at the breeder’s specific pathogen free (SPF) facility (Japan Farm Co., Ltd,
Kagoshima, Japan) for 27 weeks. Body weights at the beginning of the experiment were 5.1 (2.6) kg (mean (standard deviation; SD)). During this period, 5 pigs were fed with 450 g/day standard dry feed (Kodakara73, Marubeni Nisshin Feed Co., Ltd., Tokyo Japan), and had unlimited access to water (control group). Five pigs were fed a high-fat, high-cholesterol diet containing 15% lard and 2% cholesterol (HFCD group). The 5 remaining pigs were fed a high-fat, high-cholesterol and high-sucrose diet containing 15% lard, 2% cholesterol, and 37% sucrose (HFCSD group). During dissections, the heart, liver, kidney, stomach, and spleen were excised and weighed immediately.
Hematology and clinical chemistries
Blood samples were collected from the superior vena cava after 5, 10, 14, 19, 23, and 27 weeks of the feeding period. Blood (EDTA), plasma (EDTA), and serum samples for hematology and biochemical tests were collected 24 hours after fasting. Hematology and biochemical tests were conducted by Clinical Pathology Laboratory, Inc. (http://www.patho.co.jp/index.html) (Kagoshima, Japan) using standard clinical methods.
36
MIAME compliance and data availability
The microarray experiments described in this manuscript were MIAME compliant and the raw data have been deposited in the Gene Expression Omnibus (GEO) database (Accession number GSE 32616,
http://www.ncbi.nlm.nih.gov/geo/query/acc.cgi?acc=GSE32616.)
Preparation of samples and microarray assays
Whole blood samples for microarray analyses were collected from each subject in
PAXgeneTM tubes (Qiagen/BD GmbH, UK), incubated at room temperature for 4 hours
for RNA stabilization, and then stored at -80°C. RNA was extracted from whole blood
using the PAXgeneTM Blood RNA System Kit (Qiagen GmbH, Germany) according to
the manufacturer’s guidelines. RNA from white blood cells was extracted from whole blood samples using a LeukoLOCK Total RNA Isolation kit (Ambion, Austin, TX). Isolations were performed according to the manufacturer’s protocol. The quality of the
purified RNA was verified using an Agilent® 2100 Bioanalyzer (Agilent Technolo- gies,
Santa Clara, CA). RNA concentrations were determined using a NanoDrop® ND-1000
spectrophotometer (NanoDrop Technologies, Wilmington, DE). Fluorescent cyanine 3-CTP– labeled cRNA was used for hybridization onto porcine oligo microarray slides
37
(#G2519F#20109, Agilent Technologies) containing 43,603 oligonucleotide probes at 65℃ for 17 h. The hybridized microarray slides were washed according to the manufacturer’s instructions and were scanned with an Agilent DNA Microarray Scanner (#G2565BA, Agilent Technologies) at 5-μm resolution. The scanned images were analyzed numerically using Agilent Feature Extraction Software version 9.5.3.1. (Agilent Technologies).
Microarray data analysis
Normalized data using quantile normalization were analyzed using GeneSpring GX software version 10.0.1 (Agilent Technologies). The Gene Ontology (GO) Database (http://www.geneontology.org/) was used to categorize gene expression profiles functionally. GO terms were obtained from the TIGR pig gene indices, Porcine version 14.0 3-11-10 (http://compbio.dfci.harvard.edu/cgi-bin/tgi/gimain.pl?gudb=pig). The TC Annotator List includes the gene number and the GO terms. Out of the 43,603 probes used in the Agilent porcine microarray (#G2519F#20109), GO annotations were available for 6,019 genes. Microarray cDNA probes were classified according to GO terms for different biological processes. For the microarray data analyses, we focused particularly on the variation of dietary-related gene expression profiles. Initially,
38
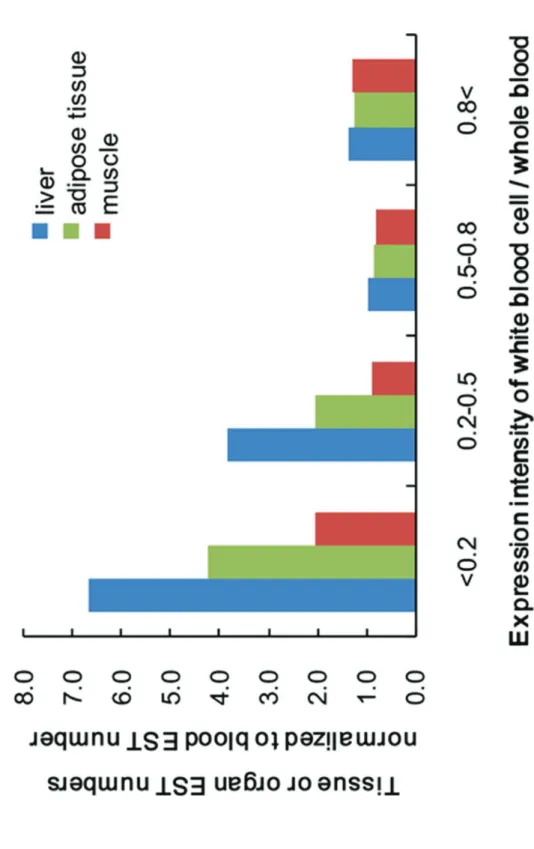
microarray spots of interest were divided into 2 groups: ‘‘absent’’ and ‘‘present,’’ using the flag values provided by the scanner. Background levels were determined from the spots outside of the gene probing area. ‘‘Absent’’ was assigned to spots with a signal intensity that was less than that of the background level, while the rest were marked “present”. Only data for ‘‘present’’ spots were used for the analyses. The intensity ratio of white blood cell gene expression to that of whole blood is a contribution indicator for
white blood cell RNAto whole blood RNA. The relation of tissues or organs ESTs to
the white blood cell contribution indicator was examined. To focus on obesity-related organs, i.e., the liver, adipose tissue, and muscle, the relative EST numbers of these organs to blood ESTs for each gene were calculated using EST profiles from the Unigene NCBI database of the transcriptome. An EST profile breakdown of 22,000 porcine genes by body site is available, comprising 40 organ types, such as the lung, ovary, liver, adipose tissue, muscle, and blood. The profiles show gene expression patterns inferred from EST counts and cDNA library sources (http://www.ncbi.nlm.nih.gov/UniGene/).
Statistical analysis
39
Tukey-Kramer multiple comparisons test for multiple groups. After excluding the unexpressed genes from each set of array data, Pearson correlation coefficients were calculated to identify similarities in gene expression among individuals. Pearson correlation coefficients were analyzed by a one-way factorial ANOVA using Fisher’s Z-transform to normalize the correlation distribution. Correlations were considered statistically significant for ANOVA tests among all groups and t-tests between 2 groups when p < 0.05. All values were expressed as non-transformed mean (standard deviation (SD)). Genes with a fold change greater than 2.0 (p < 0.05) and less than 0.5 (p < 0.05) after 10, 19, and 27 weeks were identified. These genes were mapped to the Gene Ontology and KEGG pathway in the Database for Annotation, Visualization and Integrated Discovery (DAVID Bioinformatics Resources 6.7, National Institute of Allergy and Infectious Diseases, http://david.abcc.ncifcrf.gov/) (Dennis et al., 2003; D. W. Huang et al., 2009). Chi-square tests were performed for feature extractions of GO terms. The expected values were the number of up- and down-regulated genes bearing all GO annotations, and the observed values were specific to each GO term. Simple linear regressions were performed for the scatter plots to obtain the slopes and intercepts, and the significance of each regression slope was verified.
40
Ethical considerations
All experimental protocols were approved by the Committee for the Care and Use of Experimental Animals at AIST (Permit Number: 2009-055A).
3 Results
Characteristics of study subjects
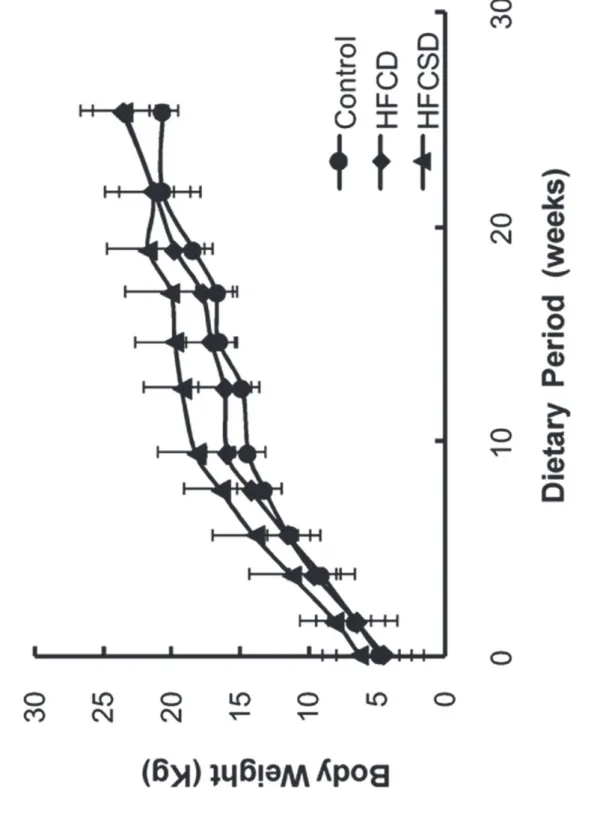
Temporal changes in mean body weights for the 3 dietary groups are shown in Figure 2. One-way ANOVA analysis for dietary-related variation revealed no significant difference at any feeding period except at week 12. In this study, the term ‘‘week’’ refers to the dietary period and not to the period since birth, unless otherwise stated. Table 3 lists the fasting plasma triglyceride concentrations for the group fed the high-fat, high-cholesterol diet (HFCD) and the group fed the high-fat, high-cholesterol, and high-sucrose diet (HFCSD). Almost no changes were observed in fasting plasma triglyceride levels. Fasting plasma total cholesterol concentrations had increased in the HFCD group and the HFCSD group by week 5 of the feeding period (p < 0.001) and were maintained between 350 and 1150 mg/dL from weeks 10–27 (Table 4). Fasting plasma high-density lipoprotein cholesterol (HDL-C) concentrations increased and showed significant differences (p < 0.001) from weeks 10–27 between two dietary
41
treatment groups and control (Table 5). Fasting plasma low-density lipoprotein cholesterol (LDL-C) concentrations also increased and showed significant differences from weeks 5–27 between two dietary treatment groups and control (Table 6). Fasting plasma glucose concentrations remained unchanged (Table 7). The number of white blood cells and the ratios of granulocytes (basophiles, eosinophils, neutrophils, lymphocytes, and monocytes) to white blood cells were not statistically significant among the three test groups (Table 8–13). The liver (p < 0.001) and spleen (p < 0.01) weights were increased significantly compared to the controls in both the HFCD and HFCSD groups. In contrast, the heart, kidney, and stomach weights remained unchanged (Table 14).
Microarray gene expression profiles – Correlation of gene expression
RNA analyses were conducted on blood samples obtained at weeks 10, 19, and 27 of the feeding periods to characterize the dietary effects on gene expression profiles in whole blood and white blood cells of miniature pigs. Each RNA sample was analyzed by porcine gene expression microarray consisting of 43,603 oligonucleotide probes. We evaluated variation in correlation coefficients among individuals on the same diet and between different diet groups.
42
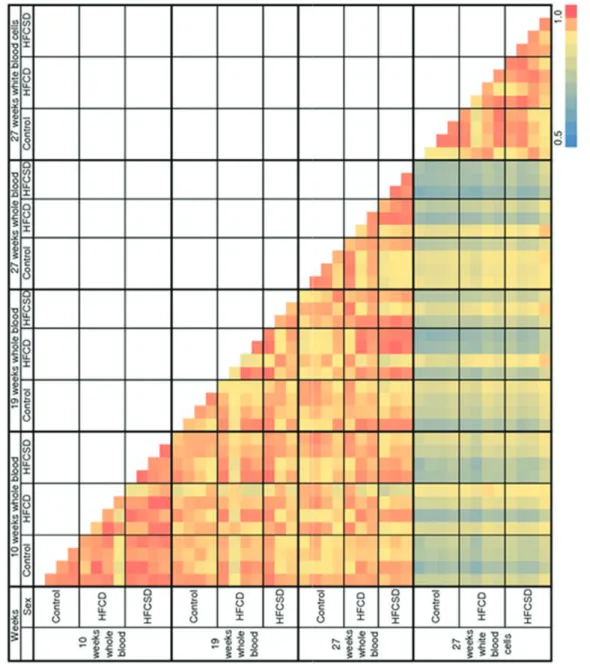
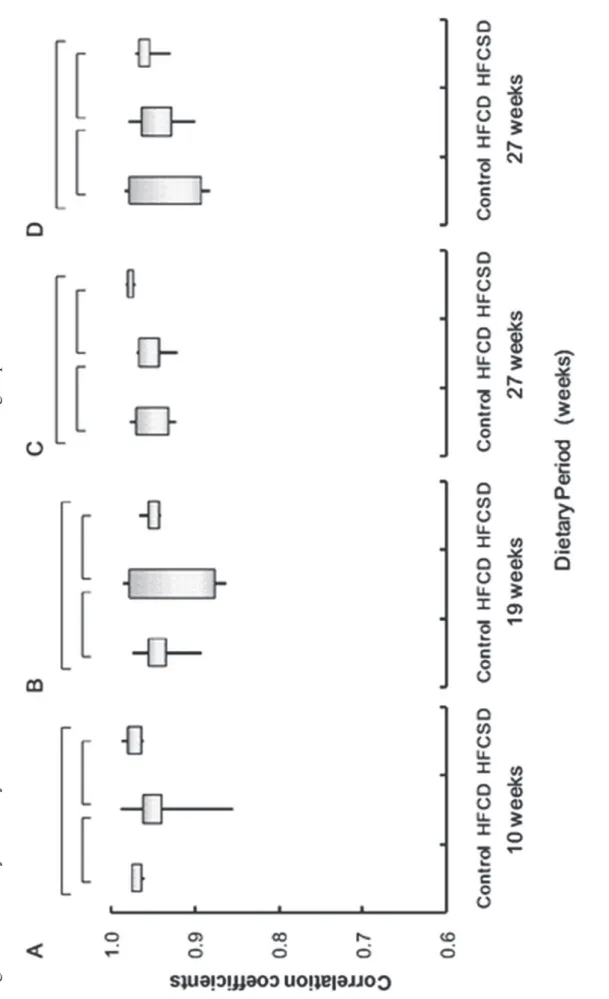
Pearson correlation coefficients were used for the correlation analysis. Correlation coefficients for 45 microarrays in total were obtained for a normalized signals log-scale after excluding ‘‘absent’’ spots, definition of ‘‘absent’’ were described in Materials and Methods. A color-coded pairwise correlation matrix is displayed in Figure 3. Figure 4 illustrates the mean correlation coefficients for gene expression profiles among individuals within the same dietary group, showed the individual difference of the gene expression profiles within the dietary groups during dietary period. Figure 5 presents the mean correlation coefficients for gene expression profiles among different diet groups. The correlation coefficients of whole blood expression profiles within the same diet groups were 0.97 (0.01) (mean (standard deviation; SD)), 0.94 (0.05), and 0.97 (0.01) for the control, HFCD, and HFCSD whole blood at 10 weeks, 0.94 (0.03), 0.93 (0.06), and 0.95 (0.01) at 19 weeks, and 0.95 (0.02), 0.95 (0.03), and 0.98 (0.01) at 27 weeks, respectively. The correlation coefficients of white blood cell expression profiles within the same dietary groups were 0.94 (0.05), 0.95 (0.03), and 0.96 (0.02) for the control, HFCD, and HFCSD groups at 27 weeks, respectively. Using Fisher’s Z-transformation to normalize the correlation distributions, no significant differences in correlation coefficients among dietary groups were observed at any period during the treatments. This indicates uniformity of dietary- induced hyperlipidemia for our protocols. Next, we
43
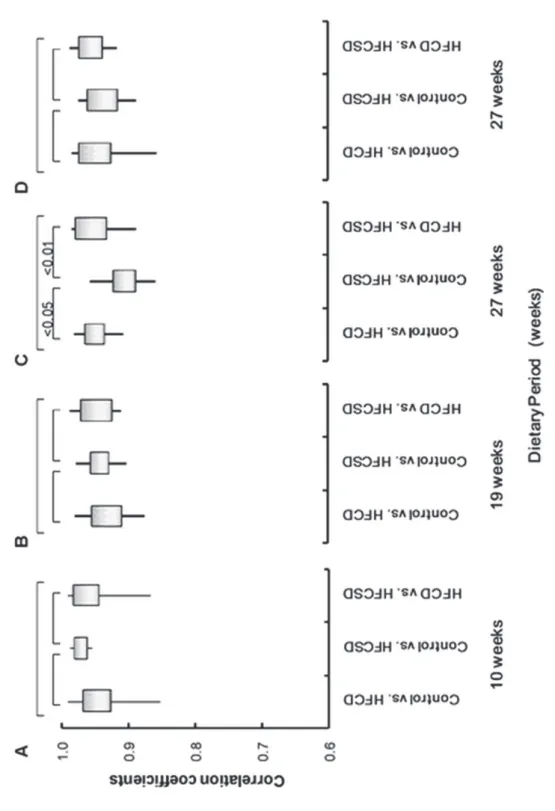
analyzed expression profile correlations among the different diet groups. In Figure 5, ‘‘control vs. HFCD’’ represents the mean correlation coefficient between control and HFCD group individuals. The whole blood correlation coefficients among the different diet groups were 0.95 (0.04), 0.97 (0.01), and 0.96 (0.04) for control vs. HFCD, control vs. HFCSD, and HFCD vs. HFCSD at 10 weeks, 0.93 (0.03), 0.94 (0.02), and 0.95 (0.03) at 19 weeks, and 0.95 (0.03), 0.91 (0.03), and 0.95 (0.03) at 27 weeks, respectively. The white blood cell correlation coefficients among the different diet groups were 0.94 (0.04), 0.94 (0.03), and 0.96 (0.02) for control vs. HFCD, control vs. HFCSD, and HFCD vs. HFCSD at 27 weeks, respectively. Correlations of whole blood expression profiles were statistically significant according to an ANOVA test among all groups at 27 weeks, as a low correlation coefficient was obtained for the control vs. HFCSD groups. This indicates HFCSD differs much from control group and slightly from HFCD 27 weeks in whole blood gene expression profiles.
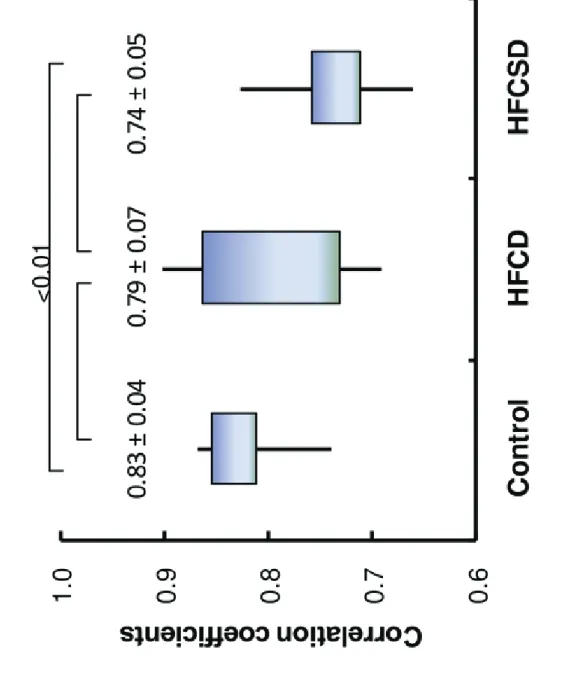
Figure 6 displays the average correlation coefficients between whole blood and white blood cell expression profiles within the same dietary group. The correlation coefficients were 0.83 (0.04), 0.79 (0.07), and 0.74 (0.05) for control, HFCD, and HFCSD at 27 weeks, respectively. Significant differences were observed between the control and HFCSD groups according to an ANOVA analysis using Fisher’s Z-transform
44
(p < 0.01).
Assigning known functions to gene expression – Gene ontology annotation
We identified up- and down-regulated genes and classified these according to function using information from the Gene Ontology (GO) Database to understand the observed differences in whole blood gene expression profiles for the different dietary groups. Top-ranked genes with fold changes in expression greater than 2.0 (p < 0.05; HFCD, Table 15; HFSCD, Table 16) and less than 0.5 (p < 0.05; HFCD, Table 17; HFSCD, Table 18) were selected at 10, 19, and 27 weeks. Genes TC440907, TC448587 (ABCA1), and TC438339 were ranked highest in HFCD and HFCSD during the dietary period. These genes were analyzed using the Database for Annotation, Visualization and Integrated Discovery (DAVID; Table 19, HFCD; Table 20, HFCSD). As a result, the GO categories of many genes up-regulated at the end of the 19- week dietary period in both HFCD and HFCSD groups were related to nucleotide binding (GO: 0000166, GO: GO: 0005524, 0005525, GO: 0017076, GO: 0019001, GO: 00032553, GO: 00032555, GO: 0032561). The GO categories of gene up- regulated after 19 weeks in the HFCD group only were related to catabolic processes (GO: 0009057, GO: 0019941, GO: 0030163, GO: 0043632, GO: 0044257, GO: 0044265,). Many genes down-regulated after 27
45
weeks in both HFCD and HFCSD groups were in the GO categories related to biological adhesion (GO: 0007155, GO: 0022610). In addition, many genes down- regulated at the end of the 27-week dietary period in the HFCSD group only were related to steroid metabolism and lipid biosynthesis (GO: 0006694, GO: 0008202, GO: 0008203, GO: 0008610, GO: 0016125, GO: 0016126). To investigate potential reasons for the differences in gene expression among the diet groups during the dietary period, Chi- square tests were performed to identify whole blood GO categories for each treatment group vs. the control group. The expected values represented the number of up- and down-regulated genes bearing all GO annotations at each period of the diet, and the observed values represented the number of up- and down- regulated genes bearing each specific GO term. A difference of p < 0.05 between groups was considered significant. To identify up- and down-regulated genes, we compared levels of expression for each gene between the control vs. HFCD groups and between the control vs. HFCSD groups at each period using Student’s t-tests. As the lowest number of genes for which the expectation frequency reached 1 or higher was 140 according to the conditions of observed value, the GO terms, which involve more than 140 genes, were used for the Chi-square tests. The results of the Chi- square tests for up- and down-regulated genes are listed in Tables 21–24. The correlation coefficients of
46
constituent gene between whole blood and white blood cells at 27 weeks were calculated for each GO term. Table 21 lists the GO terms for which significant differences were observed in the HFCD and HFCSD groups relative to the expected values. Inflammatory response elements (GO:0006954) were repressed in the HFCD group, and were both induced and repressed in the HFCSD group. The correlation coefficients between whole blood and white blood cells for expression levels of inflammatory response genes were 0.92 (0.03), 0.97 (0.02), and 0.95 (0.02) for the control, HFCD, and HFCSD groups, respectively. Genes involved in reproduction (GO:0000003) were induced in the HFCD group, and were both induced and repressed in the HFCSD group. The correlation coefficients for expression levels of genes involved in reproduction between whole blood and white blood cells were 0.91 (0.02), 0.93 (0.03), and 0.88 (0.03) for the control, HFCD, and HFCSD groups, respectively. Table 22 lists the GO terms for which significant differences were observed in the HFCD group compared to the expected values. Muscle contraction (GO:0006936) and locomotor behavior (GO:0007626) elements were both induced and repressed. Muscle organ development (GO:0007517) and metabolic processes (GO:0008152) were repressed.
47
HFCSD group compared to the expected values. Translation (GO:0006412), embryonic development ending in birth or egg hatching (GO:0009792), electron transport (GO:0006118), and transcription from the RNA polymerase II promoter (GO:0006366) elements were both induced and repressed. Positive regulation of growth rates (GO:0040010), nematode larval development (GO:0002119), intracellular protein transport (GO:0006886) and growth (GO:0040007) elements were induced. A cell surface receptor-linked signaling pathway (GO:0007166) and responses to hypoxia (GO:0001666) were repressed.
Table 24 lists the GO terms for which ratios to the expected values were unchanged in the HFCD and HFCSD groups. In addition, the ratios of up- and down-regulated genes to the each observed values were unchanged at 27 weeks.
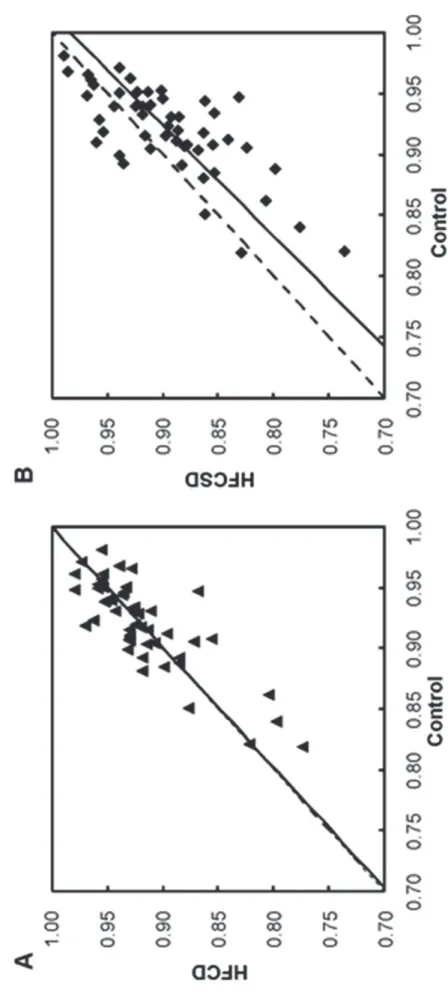
Figure 7 depicts a scatter plot of correlation coefficients between whole blood and white blood cells for each GO term, selected for the Chi-square tests, at 27 weeks of each dietary treatment group relative to the control group. The slope of the HFCD to the controls regression line was 1.007 (p < 0.001). The slope of the HFCSD to the controls regression line was 1.097 (p < 0.001), indicating that the correlation coefficients between whole blood and white blood cell expression levels for many GO terms were low. The predominant GO terms with low correlation coefficients in the HFCSD group
48
were nervous system development (GO:0007399), biological processes (GO:0008150), signal transduction (GO:0007165), regulation of transcription, DNA-dependent (GO:0006355), and cell proliferation (GO:0008283). In contrast, the predominant GO terms with high correlation coefficients in the HFCSD group were skeletal system development (GO:0001501), small GTPase mediated signal transduction (GO:0007264), synaptic transmission (GO:0007268), cell surface receptor linked signaling pathway (GO:0007166), and transcription from the RNA polymerase II promoter (GO:0006366). The intensity ratio of white blood cells to whole blood is a contribution indicator of the white blood cell RNA to whole blood gene expression. To focus on obesity-related organs, i.e., the liver, adipose tissue, and muscle, the relative numbers of ESTs for these organs to blood ESTs for each gene were calculated using EST profiles from the Unigene NCBI database of the transcriptome. The normalized EST values increase when the contribution indicator is small, as shown in Figure 8.
4 Discussion
This study aimed to evaluate the transition of gene expression profiles caused by dietary-induced hyperlipidemia through blood microarray analyses of miniature pigs during a 27-week dietary period.
49
Dietary-induced hyperlipidemia miniature pig models have previously been established. There are 2 main types of dietary protocol, one containing cholesterol and animal lipids (Kobari et al., 1991; de Smet et al., 1997; Orbe et al., 2001; Bowles et al., 2004; Keyzer et al., 2009), and the other containing cholesterol, animal lipids, and sucrose (Yin et al., 2004; Zhang et al., 2006). Some studies have focused their attention on certain kinds of candidate genes with specific functions, but this has not clarified a complete projection of whole blood RNA profiles of the transitions caused by diet-induced hyperlipidemia. Excessive exposure to dietary fats and/or sugars is an essential factor in the initiation of obesity and metabolic syndrome-associated pathologies, two typical conditions associated with diet-induced hyperlipidemia. The fasting plasma total cholesterol level in- creased within a month, and then, either remained high or decreased in the high-fat and high-cholesterol diet (HFCD) models (Kobari et al., 1991; Bowles et al., 2004; Keyzer et al., 2009). In contrast, fasting plasma total cholesterol levels increased throughout the dietary period in the high-fat, high-cholesterol, and high-sucrose diet (HFCSD) models (Zhang et al., 2006). Therefore, in the present study, hyperlipidemia was induced by the administration of a high- fat and high-cholesterol diet or a high-fat, high-cholesterol, and high sucrose diet to Clawn miniature swine.
50
the 27-week feeding period under both feeding treatments. However, fasting plasma glucose concentrations remained unchanged. The liver and spleen weights increased significantly after the 27 weeks, and fatty livers were reported based on autopsies of individuals from both treatment groups. There was no significant difference in body weight, hematology, or other biochemical aspects of blood between individuals from the 2 dietary treatments.
Gene expression profiles of dietary-induced hyperlipidemia for whole blood RNA We used whole blood to evaluate the transition of gene expression profiles. Whole blood RNA is easy to handle compared to isolated white blood cell RNA. In addition, whole blood contains a heterogeneous mixture of subpopulations of blood cells. Associated changes will be reflected on whole blood RNA once a great change has occurred in the composition and expressing condition of subpopulations, tissues, or organs. We previously evaluated the ‘‘healthy state’’ gene expression profile by whole blood microarray analyses of miniature pigs of different age groups, and identified characteristics of age-related gene expression by taking into account the change in the number of expressed genes by age and the similarities of gene expression intensity between individuals (Takahashi et al., 2011). The report on the healthy state of
51
miniature pigs found that the correlation coefficients within the same age groups were 0.87 (0.04), 0.93 (0.03), 0.98 (0.01), and 0.96 (0.02), for the fetal stage, and for 12-, 20-, and 30-week-old male pigs, respectively. Variation in gene expression was greatest for younger subjects and diminished with age. These results indicate that uniformity of laboratory animals can be expected in miniature pigs after 20 weeks of age. In this study, feeding treatments commenced when the pigs were 12 weeks old, RNA analysis was conducted on whole blood sampled after 10, 19, and 27 weeks of the feeding period, and on white blood cell RNA after 27 weeks. Variation in whole blood gene expression intensity among individuals within either the HFCD or the HFCSD group was in the same range as that of the controls at any period, indicating uniformity of dietary-induced hyperlipidemia expression profiles in miniature pigs.
Effects of white blood cells on whole blood gene expression profiles in dietary-induced hyperlipidemia
Most of the nucleated cells in blood are white blood cells such as neutrophils, T cells, B
cells, and monocytes. Min et al. (2010) reported highly correlated results (r2=0.85) for
8,273 genes expressed in both whole blood RNA and peripheral blood mononuclear cell (PBMCs) RNA samples from healthy volunteers. Other researchers have conducted a
52
large-scale genome-wide expression analysis of white blood cell subpopulations (Cobb et al., 2005). That study indicated that correlation coefficients for T cells and monocytes among different healthy subjects were 0.98 (0.01) and 0.97 (0.01), respectively. However, the correlation coefficient between T cells and monocytes for the same subjects (n=5) was 0.88 (0.01), indicating varied correlations between white blood cell subpopulations (Cobb et al., 2005). We believe that no effects of composition ratio of white blood cell subpopulations were observed in our study, because the ratios of granulocytes (neutrophils, eosinophils, and basophils), lymphocytes, and monocytes to white blood cells were statistically insignificant among the three test groups.
In previous studies, tumor-derived RNA was detected in the circulation of cancer patients (Kopreski et al., 1999; Lo et al., 1999). It has also been demonstrated that fetal RNA can be detected in maternal plasma (Poon et al., 2000). These results indicate that whole blood RNA may contain RNA originating from the tissues and/or organs. Hyperlipidemia is one of the risk factors associated with atherosclerosis.
Atherosclerosis was induced by the administration of a high-fat and high-diet to Göttingen miniature swine for a 6-month period (Kobari et al., 1991). The liver and spleen weights were increased significantly compared to the controls in both the HFCD and HFCSD groups in our experiment at the end of each dietary period. Thus white
53
blood cell microarray analyses were conducted at the end of each dietary period, as the tissues and/or organs, such as the liver, spleen, and blood vessels, were presumed to be influenced by dietary treatment.
The average white blood cell correlation coefficients within the HFCD and HFCSD groups were in the same range as that of the controls after the 27-week feeding period. However, variation in whole blood gene expression intensity between the HFCSD group and the control group was statistically significant, whilst variation in white blood cell gene expression intensity between the HFCSD group and the control group was not significant after the 27-week feeding treatments. In addition, the HFCSD correlation coefficient between whole blood and white blood cells after 27 weeks was significantly lower than that of the control and HFCD groups.
The intensity ratio of white blood cell gene expression to that of whole blood shows the contribution of white blood cell RNA to whole blood RNA samples. The intensity ratio of white blood cells to whole blood is, therefore, considered as the contribution indicator. We assume that the low intensity ratio of white blood cell to whole blood gene expression indicates a greater contribution of tissues and/or organs RNA to whole blood RNA. We then compared the EST numbers of the tissue or organ with the contribution indicator, focusing on obesity-related organs such as the liver, adipose tissue, and