STAT I ST I CS
No. 105
2013 September
Articles
Does the Production Efficiency of Minority Tujia Ethnic Enterprises Differ from Han Enterprises? A Case Study of Wufeng in China
……… Junfang SUN ( 1 )
2008 SNA and its Problems
……… Itsuo SAKUMA (15)
Note
The Trend of Usage of Administrative Register in Agricultural Surveys in European Union
……… Hiroshi YOSHIDA (32)
Book Review
Kazunori KIMURA, Statistical Analysis of Income Distributions in Japan, Nihon Keizai Hyouronsha Ltd., Tokyo, 2013
……… Akiyoshi YAMAGUCHI (40)
Activities of the Society
The 57th Session of the Society of Economic Statistics ……… (45) Prospects for the Contribution to the Statistics ……… (56)
JAPAN SOC I ETY OF ECONOM I C STAT I ST I CS
統 計 学
第 105 号
論 文
Does the Production Efficiency of Minority Tujia Ethnic Enterprises Differ from Han Enterprises? A Case Study of Wufeng in China
……… Junfang SUN ( 1 ) 2008SNAとその問題 ……… 作間 逸雄 (15)
研究ノート
EU農業統計調査における行政資料利用の動向 ……… 吉田 央 (32)書 評
木村和範著『格差は「見かけ上」か ― 所得分布の統計解析 ― 』(日本経済評論社,2013) ……… 山口 秋義 (40)本 会 記 事
経済統計学会第57回(2013年度)全国研究大会 ………(45) 『統計学』執筆要綱 ………(56)2013年 9 月
経 済 統 計 学 会
統 計 学 第 一 〇 五 号 ︵ 二 〇 一 三 年 九 月 ︶ 経 済 統 計 学 会Junfang SUN (京都大学経済学部) 作 間 逸 雄(専修大学経済学部) 吉 田 央(東京農工大学農学研究院) 山 口 秋 義(九州国際大学経済学部)
支 部 名
事 務 局
北 海 道 ………… 062−8605 札幌市豊平区旭町 4−1−40北海学園大学経済学部 (011−841−1161) 水 野 谷 武 志 東 北 ………… 986−8580 石巻市南境新水戸 1石巻専修大学経営学部 (0225−22−7711) 深 川 通 寛 関 東 ………… 192−0393 八王子市東中野 742−1中央大学経済学部 (042−674−3424) 芳 賀 寛 関 西 ………… 525−8577 草津市野路東 1−1−1立命館大学経営学部 (077−561−4631) 田 中 力 九 州 ………… 870−1192 大分市大字旦野原 700大分大学経済学部 (097−554−7706) 西 村 善 博編 集 委 員
金 子 治 平(関 西)[長]
西 村 善 博(九 州)[副]
山 田 満(関 東)
橋 本 貴 彦(関 西)
栗原由紀子(関 東)
統 計 学 №105
2013年9月30日 発行 発 行 所経
済
統
計
学
会
〒194−0298 東 京 都 町 田 市 相 原 町4342法 政 大 学 日 本 統 計 研 究 所 内
TEL 042(783)2325 FAX 042(783)2332 h t t p : / / w w w . j s e s t . j p / 発 行 人 代 表 者森
博
美
発 売 所 音 羽 リ ス マ チ ッ ク 株 式 会 社 〒112−0013 東 京 都 文 京 区 音 羽1−6−9 T E L / F A X 0 3 ( 3 9 4 5 ) 3 2 2 7 E−mail:[email protected] 代 表 者 遠 藤 誠 昭和情報プロセス㈱印刷 Ⓒ経済統計学会 社会科学の研究と社会的実践における統計の役割が大きくなるにしたがって,統計にかんす る問題は一段と複雑になってきた。ところが統計学の現状は,その解決にかならずしも十分で あるとはいえない。われわれは統計理論を社会科学の基礎のうえにおくことによって,この課 題にこたえることができると考える。このためには,われわれの研究に社会諸科学の成果をと りいれ,さらに統計の実際と密接に結びつけることが必要であろう。 このような考えから,われわれは,一昨年来経済統計研究会をつくり,共同研究を進めてき た。そしてこれを一層発展させるために本誌を発刊する。 本誌は,会員の研究成果とともに,研究に必要な内外統計関係の資料を収めるが同時に会員 の討論と研究の場である。われわれは,統計関係者および広く社会科学研究者の理解と協力を えて,本誌をさらによりよいものとすることを望むものである。 1955 年 4 月経 済 統 計 研 究 会
経 済 統 計 学 会 会 則
第 1 条 本会は経済統計学会(JSES : Japan Society of Economic Statistics)という。 第 2 条 本会の目的は次のとおりである。 1.社会科学に基礎をおいた統計理論の研究 2 .統計の批判的研究 3.すべての国々の統計学界との交流 4 .共同研究体制の確立 第 3 条 本会は第2条に掲げる目的を達成するために次の事業を行う。 1.研究会の開催 2 .機関誌『統計学』の発刊 3.講習会の開催,講師の派遣,パンフレットの発行等,統計知識の普及に関する事業 4.学会賞の授与 5 .その他本会の目的を達成するために必要な事業 第 4 条 本会は第 2 条に掲げる目的に賛成した以下の会員をもって構成する。 ⑴ 正会員 ⑵ 院生会員 ⑶ 団体会員 2 入会に際しては正会員2名の紹介を必要とし,理事会の承認を得なければならない。 3 会員は別に定める会費を納入しなければならない。 第 5 条 本会の会員は機関誌『統計学』等の配布を受け,本会が開催する研究大会等の学術会合に参加すること ができる。 2 前項にかかわらず,別に定める会員資格停止者については,それを適用しない。 第 6 条 本会に,理事若干名をおく。 2 理事から組織される理事会は,本会の運営にかかわる事項を審議・決定する。 3 全国会計を担当する全国会計担当理事1名をおく。 4 渉外を担当する渉外担当理事1名をおく。 第 7 条 本会に,本会を代表する会長1名をおく。 2 本会に,常任理事若干名をおく。 3 本会に,常任理事を代表する常任理事長を1名おく。 4 本会に,全国会計監査1名をおく。 第 8 条 本会に次の委員会をおく。各委員会に関する規程は別に定める。 1.編集委員会 2 .全国プログラム委員会 3 .学会賞選考委員会 4.ホームページ管理運営委員会 5 .選挙管理委員会 第 9 条 本会は毎年研究大会および会員総会を開く。 第10条 本会の運営にかかわる重要事項の決定は,会員総会の承認を得なければならない。 第11条 本会の会計年度の起算日は,毎年4月1日とする。 2 機関誌の発行等に関する全国会計については,理事会が,全国会計監査の監査を受けて会員総会に報告し, その承認を受ける。 第12条 本会会則の改正,変更および財産の処分は,理事会の審議を経て会員総会の承認を受けなければならない。 付 則 1 .本会は,北海道,東北,関東,関西,九州に支部をおく。 2.本会に研究部会を設置することができる。 3.本会の事務所を東京都町田市相原4342 法政大学日本統計研究所におく。 1953年10月9日(2010年9月16日一部改正[最新])
1. Introduction
Since the reform and opening up, China’s pri-vate enterprises have developed rapidly. Ac-cording to the latest statistics from China’s State Administration for Industry and Com-merce, by the end of 2008, the number of regis-tered private enterprises in China reached 6.57 million, 73 times the number in 1989, while the proportion in total enterprises increased to 67%, 38 times that in 1989. As an important as-pect, the development of enterprises in ethnic areas cannot be ignored. In Western China1), the major residential area of ethnic minorities, private enterprises reached 905,100 in 2008,
accounting for 13.8% of China’s private enter-prises; most of these were founded by local ethnic minorities. With respect to distinguish-ing them from Han enterprises, they are de-fined as ethnic enterprises.
In spite of long-term integration, ethnic mi-norities still differ from Han Chinese in several aspects, such as culture, customs and religious beliefs. Some ethnic groups, for example, Uygur, even use their own languages. The dis-tinctive cultural backgrounds and characteris-tics of ethnic minorities inevitably affect their business practices. Furthermore, the Chinese government has long implemented preferential policies for ethnic minorities, such as family planning, school admission and business financ-ing. These special supports placed ethnic mi-norities and Han Chinese at different positions
Does the Production Efficiency of Minority Tujia Ethnic
Enterprises Differ from Han Enterprises?
A Case Study of Wufeng in China
Junfang SUN
*Summary
This paper describes a case study exploring the determinants of the production efficiency of China’s eth-nic enterprises as they relate to the Tujia etheth-nic minority versus the Han Chinese etheth-nic majority. It is based on our survey data for the Wufeng Tujia Autonomous County for 2010. Our econometric analysis reaches several conclusions. First, bank loans play a role in the development of private enterprises, and the returns to bank loans favor Han enterprises over Tujia enterprises. Second, education levels of entrepre-neurs have a positive effect on production efficiency of enterprises, and the returns to education for Tujia entrepreneurs are greater than for Han entrepreneurs. Third, there is a tendency for the production effi-ciency of Tujia enterprises to be lower than Han enterprises after controlling for other determinants.
Key Words
ethnic enterprise; Han enterprises; production efficiency; Tujia ethnic minority
* Graduate School of Economics, Kyoto University.
Yoshida-honmachi, Sakyo-ku, Kyoto, 606-8501, Japan., E-mail: [email protected]
in market competition.
China’s ethnic enterprises became hot issue recently and attracted increasing public atten-tion. Many studies described the status of eth-nic enterprises in various regions, such as Aba (Li and Yang, 2006), Qinghai (Guo and Chen, 2006), Ganzi (Wang et al., 2008), and Enshi (Chen, 2010). Tao (2010) summarized four de-velopment patterns of small and medium-sized enterprises (SMEs) in ethnic areas. Zhou and Xu (2006) attributed the development gap of the private enterprises in ethnic areas and coastal areas to variations in cultures and gov-ernment behaviors. Among the few studies which provide quantitative analysis, Yang (2006) found that firm size and technical characteris-tics are the main factors that influence access to finance of the private enterprises in ethnic areas. Some scholars also conducted research from the perspective of ethnic entrepreneurs. Heberer (2008) argued that the entrepreneurs of Yi (the seventh largest of the 55 ethnic mi-nority groups in China) are both carriers of eth-nic symbols and agents of modernization. Omarjan and Onishi (2008) found that, in Xingji-ang, generally the education level of ethnic en-trepreneurs’ families is very high, whereas it is not commonly so for Han. All of the above stud-ies help us in furthering research on China’s ethnic enterprises. However, most of the previ-ous studies were still limited in descriptive or merely list statistics. Moreover, Chinese schol-ars mainly choose the enterprises in ethnic ar-eas as subject regardless of entrepreneurs’ eth-nic background. In other words, the etheth-nicity influence on production efficiency was ignored. And for their regression analyses, only one or two aspects of ethnic enterprises were consid-ered such as financing problems. Given that, it is still lack of formal production function model
which can help to describe China’s ethnic enter-prises.
In this study, a production function model was proposed to reveal the determinants of pro-duction efficiency of China’s ethnic enterprises. Through this model, we examined not only the impact of traditional factors on production effi-ciency, such as bank financing and education, but we also considered the impact of some oth-er factors, including ethnicity. Moreovoth-er, we ex-plored the different impact of bank financing and education on returns to ethnic enterprises and Han enterprises through interacted vari-ables.
Tujia ethnic minority was taken as a case study to explore the subtle differences between ethnic enterprises and Han enterprises. Al-though affected by the Han Chinese since ex-changes for many years, the Tujia differ from Han Chinese on culture and economic develop-ment. The economic situation faced by Tujia ethnic minority is very important for ethnic mi-nority policies in China. First, compared to Uygur or Tibetan that have significant ethnic differences from Han Chinese, the Tujia is more likely at transitional stage. It is moderately but different from Han Chinese. Second, the Tujia people mainly reside in central China while oth-er ethnic minorities genoth-erally are concentrated in border regions. For these ethnic groups, the policy makers should also consider political fac-tors while promoting economic development, but for the Tujia, they just need focus on eco-nomic development. The data used in this paper are firm-level micro data from the survey on private enterprises in Wufeng Tujia Autono-mous County. To our knowledge, this is the first survey of private enterprises in a Tujia ethnic area.
follows. Section 2 introduces the background of this research. Section 3 explains the empirical model and the estimation methodology. Section 4 describes the data used and includes some descriptive statistics. Section 5 considers the results of our econometric analysis, and Section 6 presents the conclusions.
2.Background of the research
Tujia ethnic minority, as the sixth largest eth-nic minority in China,has a population over eight million according to the fifth national cen-sus in 2000. They are mainly distributed around Wuling Mountains in central China, straddling the common borders of Hubei, Hunan, and Gui-zhou Provinces, and the Chongqing Municipali-ty. As a result of many years of exchanges with the neighboring Han, the Tujia ethnic minority is inevitably affected by the Han Chinese; today the vast majority of Tujia people use a dialect of Chinese. However, the Tujia ethnic minority clearly differ from Han Chinese. They still keep many distinctive traditional cultures such as weddings and funerals, diets and etiquette. Be-sides, the economic development level in Tujia ethnic areas is generally lower than that of Han, currently 91.7% of the Tujia (and Miao) Autono-mous Regions are designated as the national poverty-stricken counties2).
Wufeng Tujia is selected for a case study since its highest proportion of Tujia population (nearly 85%) among all the Tujia Autonomous Regions. Wufeng, located in the southwest of Hubei Province and adjoins Hunan Province in the south, has been defined as a Tujia Autono-mous County since 1984 (see Figure 1). By the end of 2009, it had a total population of about 210,000. There are 13 ethnic minorities distrib-uted in Wufeng, and Tujia is the largest one, making up 84.8% of the total population. While
the Han Chinese constitute 15.1% of the total, ranked second.
In terms of economic development, Wufeng is a relatively backward area, with a per capita GDP of 49.7% of the national average in 2009, giving it a rank of 28th of the 64 counties and county-level cities in Hubei Province. The per capita disposable income of urban residents was ranked 61st of the 64 regions, and the per capita net income of rural residents ranked 54th. As a typical agricultural area, the value of agricultur-al output accounted for a large proportion of GDP of Wufeng. In 2009, the proportion of pri-mary, secondary and tertiary industries was 32.1: 28.2: 39.6 in 20093).
The private enterprises in Wufeng have ex-perienced rapid development during past two decades. In 1989, the first year for registration of private enterprises in China, only four enter-prises have registered in Wufeng, with a total registered capital of 339,000 yuan. By the end of 2010, the number of registered private enter-prises had increased to 267, with a total regis-tered capital of 703 million yuan. These
enter-Figure 1 Wufeng’s location and adminis-trative division
prises were mainly concentrated in secondary industries, accounting for about 62%. By taking advantage of local natural resources, many en-terprises engaged in refined tea manufacturing, hydropower industry, and mining industry. In general, the private enterprises in Wufeng are small scale. At the end of 2010, the enterprises above the designated size4) accounted for less than 9% of the total in Wufeng.
3.Model and methodology
The model established in this paper is based on a linear Cobb-Douglas production function. The dependent variable is the annual value- added of the enterprise, denoted by Y. It is giv-en by:
In Y= α0+(α1+α2Secondary+α3Tertiary)* In L+(α4+α5Secondary+α6Tertiary)* In K+α7Secondary+α8Tertiary+α9Ethinicity +(α10+α11Ethinicity)*Financing
+(α12+α13Ethinicity)*Eyears+ε ⑴ where L and K represent the labor input and capital input of the enterprise in a year, respec-tively. Here, L is all of the labor, and K is mea-sured as the net value of fixed assets. α0, and ε in our equations represent constant and error terms, and the coefficients α1, α2, α3, …α12, and α13 are unknown parameters that are to be esti-mated. To control for different technologies across industries, we use Secondary dummy variable and Tertiary dummy variable to indicate in which industry the enterprise is engaging. They are used as constant term dummy vari-ables added to α0 and coefficient dummies to
lnL and lnK, which represent interaction terms
with lnL or lnK.
Our key independent variable is Ethnicity dummy variable. It is included in the model to test whether ethnic status brings about any dif-ferences in production efficiency when other
characteristics are the same. If the Ethnicity dummy variable is on (value one), then the en-terprise is owned by a Tujia entrepreneur. The Financing variable represents bank fi-nancing of the enterprise. The rationale of this variable is based on Lin and Li (2001) who con-firmed the positive influence of bank loans on the development of private enterprises. Here we use two methods to measure bank loans. First, we use a Debt dummy variable to indicate whether the enterprise has access to bank loans. If the Debt dummy variable is on (value one), then the enterprise obtained bank loans. Second, we use the proportion of bank loans in the total financing package of the enterprise, denoted by Proportion. In addition, interaction term of Financing variable and the Ethnicity dummy variable are used to examine the differ-ence in returns to bank loans for Tujia enter-prises and Han enterenter-prises.
Hannum and Xie (1998) argued that the edu-cational gap between Han Chinese and ethnic minorities largely explained the ethnic gap in occupational attainment. Consequently, the edu-cation level of entrepreneur is taken into ac-count in this study, which is measured by edu-cation years the entrepreneur has completed, denoted by Eyears. To simplify the calculation, we counted this as six years of primary school, nine years through junior high school, 12 years through senior high middle school and voca-tional school, 15 years through college, and 16 years through university. We also interact the
Eyears variable with the Ethnicity dummy
vari-able to examine the difference in returns to ed-ucation for Tujia enterprises and Han enterpris-es.
Finally, we obtain the empirical model. As we used two proxies to measure bank loans, the model includes two forms of equation, labelled
equation ⑵ and equation ⑶.
In Y= α0+(α1+α2Secondary+α3Tertiary)* In L+(α4+α5Secondary+α6Tertiary)* In K+α7Secondary+α8Tertiary+α9Ethinicity +(α10+α11Ethinicity)*Debt
+(α12+α13Ethinicity)*Eyears+ε ⑵ In Y= α0+(α1+α2Secondary+α3Tertiary)*
In L+(α4+α5Secondary+α6Tertiary)* In K+α7Secondary+α8Tertiary+α9Ethinicity) +(α10+α11Ethinicity)*Proportion
+(α12+α13Ethinicity)*Eyears+ε ⑶ Because the data used in this analysis is cross section one, we use the method of weighted least squares (WLS)5) to avoid het-eroskedasticity. Furthermore, we add the inde-pendent variables behind the Ethnicity dummy variable in the equations one by one to enable us to examine the changes in the coefficient of the Ethnicity dummy variable. The possible changes will indicate the different returns in re-spect of these variables to Tujia enterprises and Han enterprises.
4.Data and descriptive statistics
This study employed stratified random sam-pling to collect data from 110 private enterpris-es for 2010, using interviews and quenterpris-estion-
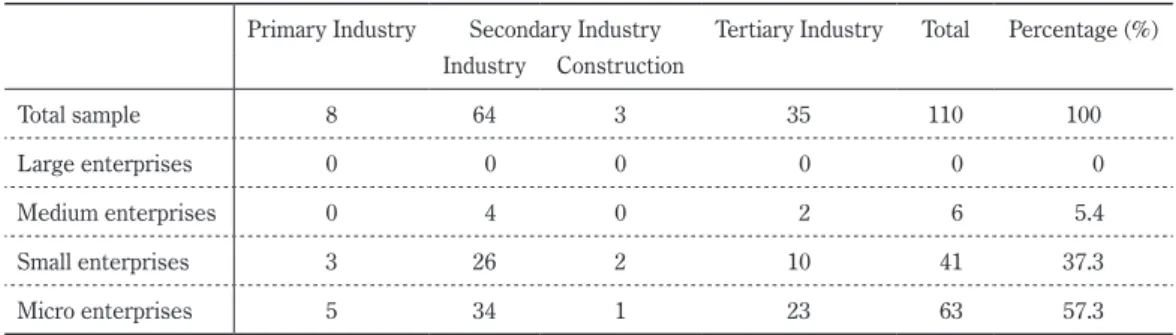
question-naires. All 267 private enterprises in Wufeng were divided into three strata by industry, and then we applied proportionate stratification based on the stratum’s share of the total enter-prises to derive the sample in each stratum. The actual enterprises surveyed were selected by using simple random procedures to draw the sample from each stratum. From our survey of 150, 110 private enterprises responded to our questionnaires with a response rate of 73.3%. Table 1 shows the composition of the respon-dent enterprises. The vast majority of them are small scale. Only nine enterprises are above the designated size, accounting for 8.2% of the re-spondent enterprises. This follows the general trend of private enterprises in Wufeng.
From the perspective of the ethnicity of en-trepreneurs, 76 enterprises were owned by Tu-jia people, and the other 34 were owned by Han Chinese. This is understandable, as the Tujia comprise nearly 85% of the total county popula-tion. Mean values of variables in Table 2 shows that the labor and capital input as well as bank loans of Tujia enterprises seem to be lower than that of Han enterprises; and the average educa-tion level of Tujia entrepreneurs is numerically lower than the Han counterparts’. Further, we
Table 1 Number and composition of the sampled enterprises
Primary Industry Secondary Industry Tertiary Industry Total Percentage (%) Industry Construction Total sample 8 64 3 35 110 100 Large enterprises 0 0 0 0 0 0 Medium enterprises 0 4 0 2 6 5.4 Small enterprises 3 26 2 10 41 37.3 Micro enterprises 5 34 1 23 63 57.3 Note: The sampled enterprises were divided by firm size according to “Classification Standards for SMEs in China
(2011)”. Compared to the previous classification standards in 2003, the main changes are: small enterprises are further subdivided into micro enterprises, and industry classification standards are increased to reflect industry differences.
conduct t-test to examine whether the differ-ences between ethnic and Han enterprises are statistically significant or not. The results re-ported in Table 2 show that the average educa-tion years of Tujia entrepreneurs are signifi-cantly less than that of Han. This confirms the findings of previous studies that the average education level of Tujia people is less than Han (Xu and Li, 2009). However, other variables do not show any significant difference between Tu-jia enterprises and Han enterprises.
To examine more carefully whether the in-dustrial distribution of Tujia enterprises differ from that of Han enterprises, industry classifi-cation is further subdivided into finer details. The comparison of Tujia enterprises and Han
enterprises are presented in Table 3. It shows that most Tujia enterprises are concentrated in Manufacturing, Wholesale and retail trade, and Mining industry, as the same trend as Han en-terprises; and there is no observed difference in their distribution of industries.
Table 4 shows the dependent and indepen-dent variables used in our empirical models.
5.Results and discussion
Table 5 shows the estimates of the exprsions for lnY in equation ⑵, and Table 6 the es-timates for lnY in equation ⑶. For both of them, we use the WLS method.
In our results, output elasticity of capital is estimated to 0.28-0.65, and the output elasticity
Table 2 Descriptive statistics
Tujia Han Tujia-Han2) P-value3)
Numerical variables (Mean)1)
Y (10,000 Yuan) 150.776 (382.162) 489.412 (1165.323) -338.636 0.107 [10,3000] [10,5000] L (Persons) 44 (101.334) 64 (70.689) -20 0.253 [9,750] [9,300] K (10,000 Yuan) 247.868 (695.991) 707.500 (1749.456) -459.632 0.151 [3,5000] [10,8000] Proportion 0.168 (0.236) 0.194 (0.245) -0.026 0.674 [0, 0.5] [0, 0.6] Eyears 12 (2.029) 13 (1.788) -1 0.006*** [6, 16] [9, 16] Dummy variables (Proportion)
Secondary 60.5% 61.8% -1.3% 0.822
Tertiary 30.3% 35.3% -5% 0.564
Debt 34.2% 41.2% -7% 0.548
Obs. No. 76 34
Note: 1) The numbers denote mean values; parentheses, standard deviations; and square brackets, minimum and maxi-mum values.
2) The result of Tujia minus Han shows the difference between Tujia enterprises and Han enterprises.
3) The P-value is the probability value of two-sample t-test. First we conduct homogeneity of variance test (F- test), and we further conduct t-test for two-sample assuming unequal variances when the null hypothesis of F-test (variances of the two samples are homogeneous) is rejected, otherwise, we are conducting t-test for two-sample assuming equal variances. Variables of Y, L, and K are for two-sample t-test assuming unequal variances, the other variables are for two-sample t-test assuming equal variances.
of capital is higher than that of labor. It is well supported empirically, as it was found in works by Chow and Li (2002) and also by Mankiw et al. (1992). In addition, as we explained in sec-tion 3, the statistical significances of industry dummy variables added to the constant term and their coefficient dummies added to lnL and
lnK have controlled the differences of
produc-tion technologies across industries.
In the specifications 4 to 6 of Tables 5 and 6, the coefficients of the Debt dummy variable and the Proportion variable are significantly positive at 1%. This result has two implications. First, the Han enterprises that are able to obtain bank loans have higher production efficiencies. Sec-ond, a higher proportion of bank loans in the
to-Table 3 Industrial distribution
Percentage (%) Tujia Han Agriculture, Forestry, Animal Husbandry & Fishery 9.2% 3.0%
Mining 11.9% 8.8%
Manufacturing 35.5% 44.1% Production & supply of electricity, gas and water 10.5% 5.9% Construction 2.6% 3.0% Wholesale & retail trade 17.1% 23.5% Real estate, renting & business activities 6.6% 8.8% Financial intermediation 0.0% 2.9% Transport, storage & communications 5.3% 0.0% Hotels & restaurants 1.3% 0.0%
Total 100% 100%
Table 4 Data list
Mean Max Min Std. Dev. Obs. No. Dependent variable lnY 4.236 8.517 2.303 1.410 110 Independent variables lnL 3.299 6.620 2.197 0.961 110 Secondary*lnL 2.168 6.620 0 1.930 110 Tertiary*lnL 0.933 4.248 0 1.412 110 lnK 4.309 8.987 1.099 1.707 110 Secondary*lnK 2.953 8.987 0 2.742 110 Tertiary*lnK 1.097 6.215 0 1.735 110 Secondary 0.609 1 0 0.490 110 Tertiary 0.318 1 0 0.468 110 Ethnicity 0.691 1 0 0.464 110 Debt 0.364 1 0 0.483 110 Ethnicity*Debt 0.236 1 0 0.427 110 Proportion 0.176 0.600 0 0.238 110 Ethnicity*Proportion 0.116 0.500 0 0.211 110 Eyears 12.591 16 6 2.011 110 Ethnicity*Eyears 8.473 16 0 5.937 110
tal financing package results in higher produc-tion efficiency for the Han enterprise. These conclusions are also tenable for Tujia enterpris-es when we conducted Wald Tenterpris-est for the signifi-cance of Tujia’s Financing variable namely (α10 +α11Ethnicity)*Debt in equation ⑵ and (α10+ +α11Ethnicity)*Proportion in equation ⑶ (See Table 7). Therefore, it confirms the results of
previous studies of the role of bank loans in the development of private enterprises.
The significantly negative coefficients of the interacted terms of Ethnicity, Debt, and
Propor-tion show that the returns to bank loans favor
Han enterprises over Tujia enterprises. As is well known, the Chinese government has long provided support for enterprises in ethnic trade
Table 5 Estimates of equation (2)
Independent variables 1 2 3 4 5 6 C 1.671*** 1.580*** 1.277*** 1.594*** 0.865*** 1.024*** (15.386) (11.656) (11.978) (10.918) (4.507) (4.711) lnL 0.117* 0.148** 0.357*** 0.091 0.166* 0.162* (1.817) (2.030) (4.975) (0.941) (1.948) (1.906) Secondary*lnL 0.301*** 0.245*** 0.045 0.307*** 0.234** 0.239** (4.393) (2.986) (0.596) (2.939) (2.568) (2.592) Tertiary*lnL 0.341*** 0.309*** -0.143* 0.220** 0.144 0.167* (4.678) (3.837) (-1.758) (2.067) (1.500) (1.763) lnK 0.464*** 0.459*** 0.280*** 0.392*** 0.373*** 0.373*** (17.224) (16.230) (7.665) (8.859) (11.919) (12.310) Secondary*lnK 0.143*** 0.168*** 0.245*** 0.136*** 0.135*** 0.135*** (4.582) (4.610) (6.892) (2.960) (4.429) (4.529) Tertiary*lnK 0.164*** 0.175*** 0.371*** 0.224*** 0.241*** 0.221*** (4.274) (4.357) (9.061) (4.611) (7.333) (6.800) Secondary -1.553*** -1.487*** -0.898*** -1.274*** -1.083*** -1.092*** (-12.588) (-10.812) (-7.629) (-7.975) (-6.599) (-6.439) Tertiary -1.390*** -1.333*** -0.452*** -0.976*** -0.789*** -0.791*** (-9.560) (-8.402) (-3.720) (-6.007) (-4.407) (-4.387) Ethnicity 0.033 -0.025 0.069*** 0.110*** -0.175 (1.337) (-1.434) (3.544) (5.310) (-1.344) Debt 0.520*** 0.604*** 0.617*** 0.624*** (13.219) (15.808) (10.821) (12.779) Ethnicity*Debt -0.237*** -0.221*** -0.241*** (-5.847) (-4.011) (-4.988) Eyears 0.045*** 0.034*** (7.303) (4.013) Ethnicity*Eyears 0.022** (2.307) Adj.R2 0.895 0.894 0.906 0.906 0.908 0.907 F-statistic 117.352 103.290 106.279 98.143 91.427 83.533 Obs. No. 110 110 110 110 110 110
Note: The table presents regression coefficients. The t statistics are reported in parentheses.
counties6) (minzu maoyi xian), and one of the key policies is preferential interest rate policy for enterprises engaging in ethnic trade and production of ethnic articles. Wufeng is one of the ethnic trade counties benefiting from this policy. In the survey, we found that the Tujia enterprises that enjoyed this policy accounted for 50% of the Tujia enterprises that obtained
bank loans in 2010, whereas the proportion for Han enterprises was 35.7%. This suggests that the preferential interest rate policy had less im-pact on Han enterprises. Therefore, although Tujia enterprises were far more likely to benefit from this form of affirmative action policy (Gross, 1977), the policy produced unintended consequences. It was likely to overprotect Tujia
Table 6 Estimates of equation (3)
Independent variables 1 2 3 4 5 6 C 1.671*** 1.580*** 1.302*** 1.613*** 0.989*** 1.317*** (15.386) (11.656) (11.467) (9.071) (4.755) (4.944) lnL 0.117* 0.148** 0.321*** 0.070 0.118 0.083 (1.817) (2.030) (4.412) (0.625) (1.251) (0.868) Secondary*lnL 0.301*** 0.245*** 0.089 0.335*** 0.282*** 0.331*** (4.393) (2.986) (1.150) (2.810) (2.778) (3.197) Tertiary*lnL 0.341*** 0.309*** -0.095 0.259** 0.184* 0.238** (4.678) (3.837) (-1.169) (2.259) (1.863) (2.302) lnK 0.464*** 0.459*** 0.308*** 0.409*** 0.394*** 0.407*** (17.224) (16.230) (8.654) (8.730) (11.110) (12.005) Secondary*lnK 0.143*** 0.168*** 0.219*** 0.121** 0.122*** 0.105*** (4.582) (4.610) (6.074) (2.500) (3.512) (3.210) Tertiary*lnK 0.164*** 0.175*** 0.340*** 0.212*** 0.228*** 0.190*** (4.274) (4.357) (8.508) (3.991) (6.607) (5.616) Secondary -1.553*** -1.487*** -0.959*** -1.317*** -1.175*** -1.250*** (-12.588) (-10.812) (-7.967) (-6.899) (-6.576) (-6.549) Tertiary -1.390*** -1.333*** -0.507*** -1.060*** -0.865*** -0.899*** (-9.560) (-8.402) (-4.178) (-6.160) (-4.784) (-4.534) Ethnicity 0.033 -0.016 0.075*** 0.109*** -0.331** (1.337) (-0.789) (3.934) (5.028) (-2.102) Proportion 0.947*** 1.143*** 1.221*** 1.259*** (13.294) (10.764) (11.170) (12.751) Ethnicity*Proportion -0.474*** -0.488*** -0.577*** (-3.882) (-4.479) (-5.593) Eyears 0.041*** 0.020* (5.981) (1.658) Ethnicity*Eyears 0.036*** (2.973) Adj.R2 0.895 0.894 0.905 0.906 0.907 0.907 F-statistic 117.352 103.290 106.279 96.882 90.227 83.533 Obs. No. 110 110 110 110 110 110
Note: The table presents regression coefficients. The t statistics are reported in parentheses.
enterprises from the realities of marketplace to some extent, and result in their lower returns to bank loans. However, even though the policy effect differed between Tujia enterprises and Han enterprises, we discovered that the re-turns to bank loans were still positive for both of them.
The coefficients of the Eyears variable are positive and significant for all the specifications. It confirms the positive effect of education level of entrepreneurs on the production efficiency of the Han enterprises. The Tujia enterprise can also enjoy positive return of education, this is statistically evidenced by Wald Test for the sig-nificance of Tujia’s Eyears variable namely (α12 +α13Ethnicity)* Eyears (See Table 8). Besides, the significantly positive coefficients of
Ethnici-ty*Eyears variable implies that, with the same education years, Tujia entrepreneurs receive
greater returns from education than Han coun-terparts. The results also show that the average total returns to education of Tujia enterprises are greater than for Han enterprises. For Tujia enterprises, this was 0.672 (results from 0.056 *12), whereas for Han enterprises, this was 0.442 (results from 0.034*13) in Table 5. In Ta-ble 6, the result for Tujia enterprises was 0.672 (results from 0.056*12), whereas for Han en-terprises it was 0.260 (results from 0.020*13)7). One possible reason for the greater returns to education for Tujia entrepreneurs is the overall diminishing returns to education. Due to lower average levels of education for Tujia people, the marginal improvement from educa-tion is likely to result in a correspondingly greater return for the Tujia entrepreneurs. Therefore, the current policy for improving ed-ucation is very effective, not only for the Tujia,
Table 7 Wald Test (H0:α10+α11=0; H1:α10+α11≠0)
Equation (2) Equation (3) specification 4 specification 4
Test Statistic Value df Prob. Test Statistic Value df Prob. Chi-square 78.871 1 0.000 Chi-square 60.207 1 0.000 specification 5 specification 5
Test Statistic Value df Prob. Test Statistic Value df Prob. Chi-square 135.025 1 0.000 Chi-square 98.816 1 0.000 specification 6 specification 6
Test Statistic Value df Prob. Test Statistic Value df Prob. Chi-square 121.690 1 0.000 Chi-square 80.927 1 0.000
Table 8 Wald Test (H0: α12+α13=0; H1: α12+α13≠0)
Equation (2) Equation (3) pecification 6 specification 6
Test Statistic Value df Prob. Test Statistic Value df Prob. Chi-square 80.280 1 0.000 Chi-square 73.661 1 0.000
but also for other ethnic groups with lower edu-cation levels than the Tujia, such as Uygur, Zhuang, and Dong (Xu and Li, 2009). The posi-tive impact from improving education for the Tujia will disappear in the near future because their education level is now quite close to that of the Han. However, other ethnic groups with lower education levels than the Tujia will con-tinue to benefit from this policy for longer peri-ods than the Tujia. And they will eventually catch up with the education levels of the Han. Our survey showed that the Tujia entrepre-neurs generally were more highly educated than the other Tujia people. The higher educa-tion levels of these people were due in large part to their higher levels of intelligence and to their families having good economic conditions at the right time. Therefore, the selection mechanism for Tujia entrepreneurs was likely to work. The more gifted Tujia children could have access to higher education only if they were supported by a family enjoying good eco-nomic conditions during their formative years. When these more gifted people with higher ed-ucation levels became entrepreneurs, they re-ceived higher returns to education. If we can rely on this interpretation, a policy implication can be drawn as follows; if the government pro-vides gifted Tujia children from poor families with more subsidies for education, there will be a likelihood that more Tujia people will become entrepreneurs.
To examine the possible changes of the coef-ficient of Ethnicity dummy variable, we added the independent variables behind the Ethnicity dummy variable in equations one by one. Our results show that the coefficients of the
Ethnic-ity dummy variable became significantly
posi-tive at 1% for specifications 4 and 5, in both Ta-bles 5 and 6. However, when we added the
Ethnicity*Eyears variable for specification 6, the coefficients of the Ethnicity dummy variable turned to negative. Therefore, specifications 4 and 5 present spurious higher production effi-ciency levels for Tujia enterprises. It can be ex-plained by the higher returns to education for Tujia enterprises.
For specification 6, the coefficients of the
Ethnicity dummy variable are negative in both
Tables 5 and 6, and significant at 5% in Table 6. This implies that, after controlling for other de-terminants, there is a tendency for the produc-tion efficiency of Tujia enterprises to be lower than for Han enterprises. Therefore, we cannot attribute the differences in production efficien-cies of Tujia enterprises and Han enterprises to the lower return in bank loans to Tujia enter-prises, or to the lower average education level of Tujia entrepreneurs. There must be other factors outside the model that might be affect-ing the production efficiency of Tujia enterpris-es. Due to data limitations, we need to explore that further in future studies.
6.Conclusions
Using the firm-level micro data of Wufeng private enterprises, we performed an analysis of the ethnicity effect on the production effi-ciency of private enterprises. Our econometric analysis reaches several conclusions.
First, our econometric evidence verified the previous studies in confirming the role of bank loans in the development of private enterprises. Further, we found that the returns to bank loans favor Han enterprises over Tujia enterprises. This was because the preferential interest rate policy may overprotect Tujia enterprises to some extent, so it seemed to be counterproduc-tive.
en-trepreneurs has positive effect on production efficiency of enterprises, and with the same ed-ucation years, Tujia people receive greater re-turns to education than Han people. Moreover, the average total returns to education of Tujia enterprises are greater than Han enterprises. The greater returns to education for Tujia en-trepreneurs may be due to the diminishing re-turns to education applicable to them, or may stem from the selection mechanism of Tujia en-trepreneurs.
Third, we found that the production efficien-cy of Tujia enterprises tend to be lower than Han enterprises after controlling for other de-terminants. Therefore, we cannot attribute their different production efficiencies to the lower returns on bank loans to Tujia enterpris-es, or the lower average education level of Tujia entrepreneurs.
These observations suggest a necessity for government to develop policies for providing nancial services to private enterprises. Bank
fi-nancing is of great significance in improving the production efficiency of private enterprises, but at the same time, the bank loans should be used efficiently. We should note that any further pref-erential interest rate subsidies favoring Tujia enterprises are likely to have a decreasing ben-efit to them. Moreover, it is very helpful for government to improve education of Tujia and other ethnic minorities to enable them to bene-fit from the current higher returns to education. It is possible that that more subsidies for educa-tion, targeting poor Tujia families, would work well to foster more Tujia entrepreneurs. Finally, we should concede to some data limi-tations, in that the present data are derived from a single region. Therefore, further re-search using the data from all the Tujia Autono-mous Regions would be valuable, and it is nec-essary to continue exploring the reasons for the difference in production efficiencies between Tujia enterprises and Han enterprises.
Acknowledgements
I appreciate detailed comments from anonymous referees that significantly improved the paper. I also re-ceived helpful comments from Professor Hiroshi Onishi (Keio University), Professor Go Yano (Kyoto Uni-versity), Professor Junichi Okabe (Yokohama National UniUni-versity), and participants at the 56th JSES Gener-al Conference. All views and errors remain my own.
Notes
1 )It comprises: Chongqing Municipality; Gansu, Guizhou, Qinghai, Shaanxi, Sichuan, and Yunnan Provinces; Ningxia Hui, Tibet, and Xinjiang Uygur Autonomous Regions.
2 )The latest standards for China’s national poverty-stricken counties are: per capita income of 1,300 yuan, for base areas, ethnic minority border areas of 1,500 yuan; per capita GDP of 2,700 yuan; per capita revenue of 120 yuan.
3 )Data source: Hubei Statistical Yearbook. Beijing: China Statistics Press, 2010.
4 )The enterprises above designated size referred to in this paper are defined in the statistical standard of 2010. The enterprises above designated size include industrial enterprises with annual revenue from their principal business of over five million yuan, enterprises in wholesale trades with annual revenue from their principal business of over 20 million yuan, enterprises in retail trades with annual revenue from their principal business of over five million yuan, and enterprises in hotels and catering services
References
Chen, Xia (2010), “Thoughts on improving the environment of private enterprises in ethnic areas: in case of Enshi Tujia and Miao Autonomous Prefecture”, Northern Economy, 4, pp.55-58.
Chow, Gregory C. and Li, Kuiwai (2002), “China’s economic growth: 1952-2010”, Economic Development and
Cultural Change, 51 (1), pp.247-256.
Gross, Barry R. (ed.) (1977), Reverse Discrimination, Buffalo, New York: Prometheus Books. Guo, Hua and Chen, Wenlie (2006), “Analysis on the role of Qinghai Muslim private enterprises in
local economic development”, Nationalities Research in Qinghai, 2, pp.106-111.
Hannum, Emily and Xie, Yu (1998), “Ethnic stratification in northwest China: occupational differ-ences between Han Chinese and national minorities in Xinjiang, 1982-1990”, Demography, 35
(3), pp.323-333.
Heberer, Thomas (2008), “Ethnic entrepreneurs as carriers of ethnic identity: a case study among the Liangshan Yi (Nuosu) in China”, Asian Ethnicity, 2, pp.97-119.
Li, Jihong and Yang, Feng (2006), “Bottleneck and development path of private enterprises in Sich-uan ethnic areas: in case of Aba Tibetan and Qiang Autonomous Prefecture”, Southwest Uni-versity for Nationalities (Humanities & Social and Sciences), 9, pp.185-188.
Lin, Yifu and Li, Yongjun (2001), “Promoting the growth of medium and small-sized enterprises through the development of medium and small-sized financial institutions”, Economic Re-search, 1, pp.10-18.
Mankiw, Gregory N., Romer, David and Weil, David N. (1992), “A contribution to the empirics of economic growth”, The Quarterly Journal of Economics, 107 (2), pp.407-437.
Omarjan, Hasan and Onishi, Hiroshi (2008), “Research on the ethnic entrepreneurs in Xinjiang Uygur Autonomous Region”, East Asian Economic Review, 3, pp.89-97.
Tao, Qingde (2010), Research on Development System of SMEs in China’s Western Ethnic Areas, Bei-jing: People’s Publishing House.
Wang, Pan and Du, Guorong and Li, Nengwu and Zeng, Xuemei (2008), “Research on the develop-ment issues of enterprises in ethnic areas: in case of Ganzi Tibetan Autonomous Prefecture”,
Management Observer, 8, pp.31-32.
Xu, shiying and Li, nan (2009), “Measure and predictive analysis of educational progress of ethnic minorities with a population over one million in China”, Research on Education for Ethnic Mi-norities, 2, pp.63-67.
Yang, Haiyan (2006), “Analysis on financing dilemma of private economy in ethnic areas”, Southwest University for Nationalities (Humanities & Social and Sciences), 5, pp.24-27.
with annual revenue from their principal business of over two million yuan.
5 )The weight used for WLS is the reciprocal of the absolute value of residuals, which comes from the estimation of equation through the method of ordinary least squares (OLS).
6 )Ethnic trade counties are those regions that have a preferential policy for ethnic trade. At present, there are a total of 435 ethnic trade counties designated by the State Council of China.
7 )The values of 12 and 13 are the average number of years of education of Tujia entrepreneurs and Han entrepreneurs, as calculated in Table 2.
Zhao, Jixiong (2007), Wufeng Tujia Autonomous County Overview, Beijing: The Ethnic Pulishing House.
Zhou, Qingxing and Xu, Tongzhu (2006), “Comparative study on private economy between western ethnic areas and eastern coastal areas”, Southwest University for Nationalities (Humanities & Social and Sciences), 1, pp.6-10.
金子治平(編集委員長) 機関誌『統計学』の編集・発行について 1.常時,投稿を受け付けます。 2.各号ごとに投稿の締め切りを設けます。その期日までに受け付けた原稿でも,査読の進捗如何に よっては,その号に掲載されないことがあります。 3.投稿に際しては,2013年9月の総会において改正された「投稿規程」,「執筆要綱」,「査読要領」 をご熟読願います。 4.原稿は編集委員長に宛ててお送り願います。 5.原稿は PDF 形式のファイルとして提出してください。また紙媒体での提出も旧規程に準拠して受 け付けます。紙媒体の送付先も編集委員長としてください。 6.原則としてすべての投稿原稿が査読の対象となります。 7.今後の締め切りは次のとおりです。 A:「論文」・「研究ノート」;B:その他 ⑴ 第106号(2014年3月31日発行予定) A:2014年1月31日;B:2014年2 月28日 ⑵ 第107号(2014年9月30日発行予定) 検討中(学会HPなどでお知らせします) 以上 編集後記 『統計学』第11号(1963年 3 月)以来,発売にご尽力いただいてきた産業統計研究社の廃業にともない, 本号から発売所が音羽リスマチック株式会社に変更になりました。50 年間にわたり発売をお引き受け いただいてきた産業統計研究社に心から感謝いたします。 また,投稿の少なさ等々の要因で発行が遅れて申し訳ありません。会員諸氏の,より活発な研究と多 数の投稿をお待ちしています。 (金子治平 記)
Junfang SUN (京都大学経済学部) 作 間 逸 雄(専修大学経済学部) 吉 田 央(東京農工大学農学研究院) 山 口 秋 義(九州国際大学経済学部)
支 部 名
事 務 局
北 海 道 ………… 062−8605 札幌市豊平区旭町 4−1−40北海学園大学経済学部 (011−841−1161) 水 野 谷 武 志 東 北 ………… 986−8580 石巻市南境新水戸 1石巻専修大学経営学部 (0225−22−7711) 深 川 通 寛 関 東 ………… 192−0393 八王子市東中野 742−1中央大学経済学部 (042−674−3424) 芳 賀 寛 関 西 ………… 525−8577 草津市野路東 1−1−1立命館大学経営学部 (077−561−4631) 田 中 力 九 州 ………… 870−1192 大分市大字旦野原 700大分大学経済学部 (097−554−7706) 西 村 善 博編 集 委 員
金 子 治 平(関 西)[長]
西 村 善 博(九 州)[副]
山 田 満(関 東)
橋 本 貴 彦(関 西)
栗原由紀子(関 東)
統 計 学 №105
2013年9月30日 発行 発 行 所経
済
統
計
学
会
〒194−0298 東 京 都 町 田 市 相 原 町4342法 政 大 学 日 本 統 計 研 究 所 内
TEL 042(783)2325 FAX 042(783)2332 h t t p : / / w w w . j s e s t . j p / 発 行 人 代 表 者森
博
美
発 売 所 音 羽 リ ス マ チ ッ ク 株 式 会 社 〒112−0013 東 京 都 文 京 区 音 羽1−6−9 T E L / F A X 0 3 ( 3 9 4 5 ) 3 2 2 7 E−mail:[email protected] 代 表 者 遠 藤 誠 昭和情報プロセス㈱印刷 Ⓒ経済統計学会 社会科学の研究と社会的実践における統計の役割が大きくなるにしたがって,統計にかんす る問題は一段と複雑になってきた。ところが統計学の現状は,その解決にかならずしも十分で あるとはいえない。われわれは統計理論を社会科学の基礎のうえにおくことによって,この課 題にこたえることができると考える。このためには,われわれの研究に社会諸科学の成果をと りいれ,さらに統計の実際と密接に結びつけることが必要であろう。 このような考えから,われわれは,一昨年来経済統計研究会をつくり,共同研究を進めてき た。そしてこれを一層発展させるために本誌を発刊する。 本誌は,会員の研究成果とともに,研究に必要な内外統計関係の資料を収めるが同時に会員 の討論と研究の場である。われわれは,統計関係者および広く社会科学研究者の理解と協力を えて,本誌をさらによりよいものとすることを望むものである。 1955 年 4 月経 済 統 計 研 究 会
経 済 統 計 学 会 会 則
第 1 条 本会は経済統計学会(JSES : Japan Society of Economic Statistics)という。 第 2 条 本会の目的は次のとおりである。 1.社会科学に基礎をおいた統計理論の研究 2 .統計の批判的研究 3.すべての国々の統計学界との交流 4 .共同研究体制の確立 第 3 条 本会は第2条に掲げる目的を達成するために次の事業を行う。 1.研究会の開催 2 .機関誌『統計学』の発刊 3.講習会の開催,講師の派遣,パンフレットの発行等,統計知識の普及に関する事業 4.学会賞の授与 5 .その他本会の目的を達成するために必要な事業 第 4 条 本会は第 2 条に掲げる目的に賛成した以下の会員をもって構成する。 ⑴ 正会員 ⑵ 院生会員 ⑶ 団体会員 2 入会に際しては正会員2名の紹介を必要とし,理事会の承認を得なければならない。 3 会員は別に定める会費を納入しなければならない。 第 5 条 本会の会員は機関誌『統計学』等の配布を受け,本会が開催する研究大会等の学術会合に参加すること ができる。 2 前項にかかわらず,別に定める会員資格停止者については,それを適用しない。 第 6 条 本会に,理事若干名をおく。 2 理事から組織される理事会は,本会の運営にかかわる事項を審議・決定する。 3 全国会計を担当する全国会計担当理事1名をおく。 4 渉外を担当する渉外担当理事1名をおく。 第 7 条 本会に,本会を代表する会長1名をおく。 2 本会に,常任理事若干名をおく。 3 本会に,常任理事を代表する常任理事長を1名おく。 4 本会に,全国会計監査1名をおく。 第 8 条 本会に次の委員会をおく。各委員会に関する規程は別に定める。 1.編集委員会 2 .全国プログラム委員会 3 .学会賞選考委員会 4.ホームページ管理運営委員会 5 .選挙管理委員会 第 9 条 本会は毎年研究大会および会員総会を開く。 第10条 本会の運営にかかわる重要事項の決定は,会員総会の承認を得なければならない。 第11条 本会の会計年度の起算日は,毎年4月1日とする。 2 機関誌の発行等に関する全国会計については,理事会が,全国会計監査の監査を受けて会員総会に報告し, その承認を受ける。 第12条 本会会則の改正,変更および財産の処分は,理事会の審議を経て会員総会の承認を受けなければならない。 付 則 1 .本会は,北海道,東北,関東,関西,九州に支部をおく。 2.本会に研究部会を設置することができる。 3.本会の事務所を東京都町田市相原4342 法政大学日本統計研究所におく。 1953年10月9日(2010年9月16日一部改正[最新])
STAT I ST I CS
No. 105
2013 September
Articles
Does the Production Efficiency of Minority Tujia Ethnic Enterprises Differ from Han Enterprises? A Case Study of Wufeng in China
……… Junfang SUN ( 1 )
2008 SNA and its Problems
……… Itsuo SAKUMA (15)
Note
The Trend of Usage of Administrative Register in Agricultural Surveys in European Union
……… Hiroshi YOSHIDA (32)
Book Review
Kazunori KIMURA, Statistical Analysis of Income Distributions in Japan, Nihon Keizai Hyouronsha Ltd., Tokyo, 2013
……… Akiyoshi YAMAGUCHI (40)
Activities of the Society
The 57th Session of the Society of Economic Statistics ……… (45) Prospects for the Contribution to the Statistics ……… (56)
JAPAN SOC I ETY OF ECONOM I C STAT I ST I CS
統 計 学
第 105 号
論 文
Does the Production Efficiency of Minority Tujia Ethnic Enterprises Differ from Han Enterprises? A Case Study of Wufeng in China
……… Junfang SUN ( 1 ) 2008SNAとその問題 ……… 作間 逸雄 (15)