E211
Analysis of Global Warming Effects on the Incidence of Tropical Storm-Related Natech Events in
the Future until 2100: A Case Study from the United States
〇Xiaolong LUO, Ana Maria CRUZ
Introduction
A natural hazard triggered technological accident, which is known as a Natech(1), is a typical type of
cascading hazard which always involves chemical releases and can result in economic losses, and environmental and human health problems(2,3).
Tropical storms and their related natural hazards, such as high winds, storm surge and heavy rainfall, can cause Natechs(4,5). Evidence from past accidents,
shows an increasing trend in the number of tropical storm related Natechs (from herein after referred to as TSNatech), and this increase may be caused by climate change.
According to several studies, climate change could affect the intensity, duration, and pathways of tropical storms. Based on studies by Mudd et al. (6,7),
climate change could cause more intense (maximum wind speed) and larger hurricanes (radius to maximum wind speed) in the future, possibly affecting the number of Natechs as facilities or industrial installations in a wider area could be affected by more intense or prolonged tropical storms due to climate change. This study proposes a methodology to estimate the probability of TSNatechs based on wind energy by using Representative Concentration Pathways (RCPs) data and the Scenario Model Intercomparison Project (ScenarioMIP) data.
Fig. 1 (a) Study area (b) the distributions of TSNatech number and tropical storm-number in month
Data and methodology
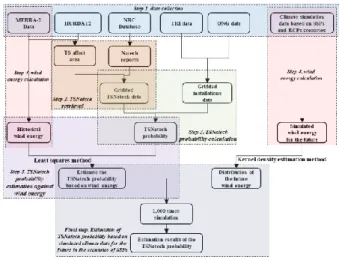
The methodology of this study is shown in Fig 2, and includes the following steps: Data collection; TSNatechs retrieval; TSNatech probability calculation; Wind energy calculation; TSNatech probability estimation against wind energy; and Estimation of TSNatech probability based on simulated climate data for the future under the SSP and RCP scenarios. This study focuses on TSNatechs that occur at fixed facilities and oil drilling platforms. The National Response Center (NRC) database of the
United States is used to identify the TSNatech. The MERRA-2 dataset was employed to determine the areas affected by tropical storms in the United States (U.S.)’s Atlantic coast and the Gulf of Mexico from 1990 to 2017. Through a spatial intersection analysis, the Natech data related to hurricane, storm, lightning, flooding, rain, and wind were spatially retrieved as TSNatechs considering tropical storm pathways, duration and Natech accident timing. Finally, only those TSNatechs that occurred at fixed facilities, storage tanks, and oil drilling platforms were selected as the target data (around 9,295 events) for this study. Furthermore, in order to calculate the TSNatech probability, the U.S. Toxics Release Inventory (TRI) Program’s basic data and the U.S. Oil and Natural Gas (ONG) Platforms data were consulted to count the number of installations that were affected by historical tropical storms.
Fig. 2 Methodology Results
By tranforming the retreived TSNatech data into grids, a generated s-curve was used to fit a type of fragility curve to describe the relationship between TSNatech probability and wind energy in the selected months in every grid for each year (shown in Fig 3 (a) and (b), respectively for each study area).
Fig. 3 fragility curve describing the TSNatech probability against wind energy; the error bars are the standard deviation Based on the identified fragility curves,
TSNatech probabilities are estimated against gridded wind energy for the selected months from 2021 to 2100 in study area A and B.
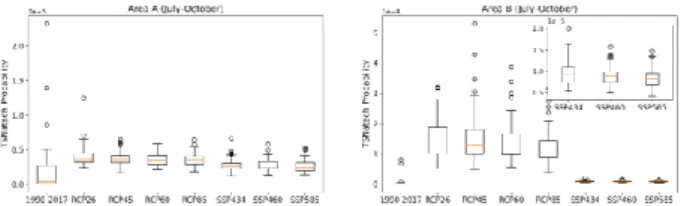
Fig 4 shows the boxplots of estimated TSNatech probability under various climate scenarios. The estimated TSNatech probability in all scenarios are much higher than the TSNatech probability in the period of 1990-2017 both in study area A and B, which suggests that the TSNatech probability may increase in the future 80 years.
Fig. 4 simulation results for the estimation of TSNatech probability based on the simulated climate data in different
climate scenarios Discussion
Since climate change could affect the intensity(8),
frequency(9), and affected area of tropical storms(10),
the occurrence of TSNatech might also be impacted by climate change. In contrast to previous studies regarding climate change and TSNatechs(11), this study
estimates the TSNatech probability for the past and future climate based on wind energy, reports of historical TSNatechs, and climate simulation data.
The identified s-curves suggest that the gridded wind energy can be used to estimate TSNatech probability. Moreover, the s-curves also showed that tropical storms were more prone to trigger Natechs in study area B from 1990 to 2017. Future research studies could investigate if the higher probabilities in Area B are related to tropical storms exceeding the design level of affected infrastructure, an increase in the number of storms that are expected to affect the region, or other factors.
Moreover, TSNatech probability may decrease in the period of 2021 to 2100. That could be explained by the changes of wind energy calculated from the climate simulation data, as wind energy might follow a decreasing trend in the future. A similar decreasing trend in wind energy in the future at the same study area was also reported in the study of Chen(12), in
which he analyzed the impacts of climate change on wind energy in north America. Especially, the decreasing trend in the wind energy of study area B were generated also in the studies of Tobin et al.(13)
and Carvalho et al.(14). However, it is valuable to point
out that even if TSNatech probabilities might decrease in the future 80 years, it may still be much higher than the value in the period of 1990-2017, especially in study area B.
Conclusion
This study presents a methodology through using wind energy to establish the empirical estimation for TSNatech probability in during the months when most TSNatech occurred and tropical-storms formed in the period of 1990 to 2017. Based on this methodology,
the TSNatech probability was also estimated for the period of 2021 to 2100 by using the climate simulation data under various RCP and SSP scenarios. The results show a weak decreasing trend in TSNatech probability in the period of 2021 to 2100. However, compared with the TSNatech probability in the period of 1990 to 2017, the TSNatech probability may increase a lot around the Gulf of Mexico and along the eastern coastal area. Moreover, in a warming climate, the counts of extreme TSNatech probabilities may increase and the clustered occurrence of TSNatech may also become serious. Although this study could conclude that the TSNatech probability might change by following different climate scenario pathways, it remains unclear exactly how the elements in those scenarios affect the changes in TSNatech probability. This could be an important future research direction. References
1. Cruz AM, Okada N. Consideration of natural hazards in the design and risk management of industrial facilities. Natural Hazards, 2008; 44(2):213–227.
2. Krausmann E, Cruz AM. Impact of the 11 March 2011, Great East Japan earthquake and tsunami on the chemical industry. Natural Hazards, 2013; 67(2):811–828.
3. Krausmann E, Cruz AM, Salzano E. Natech Risk Assessment and Management: Reducing the Risk of Natural-Hazard Impact on Hazardous Installations. Pp. 33–52 in Krausmann E, Cruz AM, Salzano EBT-NRA and M (eds). Natech Risk Assessment and Management: Reducing the Risk of Natural-Hazard Impact on Hazardous Installations. Elsevier, 2017.
4. Cruz AM, Steinberg LJ, Luna R. Identifying Hurricane-Induced Hazardous Material Release Scenarios in a Petroleum Refiner. 2001; 6988(May 2014).
5. Necci A, Girgin S, Krausmann E. Understanding Natech Risk Due to Storms - Analysis Lessons Learned and Recommendations., 2018. 6. Mudd L, Wang Y, Letchford C, Rosowsky D. Assessing climate
change impact on the US east coast hurricane hazard: Wind and rain. Structures Congress 2014 - Proceedings of the 2014 Structures Congress, 2014; (August):1426–1436.
7. Mudd L, Wang Y, Letchford C, Rosowsky D. Hurricane wind hazard assessment for a rapidly warming climate scenario. Journal of Wind Engineering and Industrial Aerodynamics, 2014; 133:242–249. 8. Knutson T, Camargo SJ, Chan JCL, Emanuel K, Ho CH, Kossin J,
Mohapatra M, Satoh M, Sugi M, Walsh K, Wu L. Tropical cyclones and climate change assessment. Bulletin of the American Meteorological Society, 2019; 100(10):1987–2007.
9. Walsh KJE, Camargo SJ, Knutson TR, Kossin J, Lee T-C, Murakami H, Patricola C. Tropical cyclones and climate change. Tropical Cyclone Research and Review, 2019; 8(4):240–250.
10. Kossin JP, Emanuel KA, Vecchi GA. The poleward migration of the location of tropical cyclone maximum intensity. Nature, 2014; 509(7500):349–352.
11. Ebad Sichani M, Anarde KA, Capshaw KM, Padgett JE, Meidl RA, Hassanzadeh P, Loch-Temzelides TP, Bedient PB. Hurricane Risk Assessment of Petroleum Infrastructure in a Changing Climate. Frontiers in Built Environment, 2020; 6(July):1–19.
12. Chen L. Impacts of climate change on wind resources over North America based on NA-CORDEX. Renewable Energy, 2020; 153:1428–1438.
13. Tobin I, Vautard R, Balog I, Bréon FM, Jerez S, Ruti PM, Thais F, Vrac M, Yiou P. Assessing climate change impacts on European wind energy from ENSEMBLES high-resolution climate projections. Climatic Change, 2015; 128(1–2):99–112.
14. Carvalho D, Rocha A, Gómez-Gesteira M, Silva Santos C. Potential impacts of climate change on European wind energy resource under the CMIP5 future climate projections. Renewable Energy, 2017; 101(2017):29–40.