博 士 学 位 論 文
Studies on the mechanisms underlying rupture of
abdominal aortic aneurysm and the preventive
methods by functional food factors
近畿大学大学院
農学研究科 応用生命化学専攻
博 士 学 位 論 文
Studies on the mechanisms underlying rupture of
abdominal aortic aneurysm and the preventive
methods by functional food factors
2019 年 3 月
近畿大学大学院
農学研究科 応用生命化学専攻
(英文題目)
Studies on the mechanisms underlying rupture of abdominal aortic
aneurysm and the preventive methods by functional food factors
Hirona Kugo
March 2019
Department of Applied Biological Chemistry,
Graduate School of Agriculture, Kindai University
Laboratory of Applied Cell Biology
(和文題目)
腹部大動脈瘤の破裂機構と機能性食品成分による予防法に関する研究
近畿大学大学院
農学研究科 応用生命化学専攻
久後 裕菜
- - - - - - - - - - - - - - - - - - - - - -
Submitted to the Graduate School, Kindai University, to fulfill the
requirement for the Doctorate Degree.
CONTENTS
Chapter 1 - General Introduction
1.1 Abdominal aortic aneurysm (AAA)
1.2 Pathophysiology of AAA
1.3 Hypoperfusion-induced AAA animal model
1.4 Objective of this study
Chapter 2 - The mechanisms underlying abdominal aortic aneurysm
rupture
2.1 Introduction
2.2 Materials and Methods
2.2.1 Animals
2.2.2 Induction of hypoperfusion in abdominal aortic wall
2.2.3 Sample collection
2.2.4 Histological analysis
2.2.5 Hematoxylin-Eosin (HE) staining
2.2.6 Elastica van Gieson (EVG) staining
2.2.7 Picrosirius red (PSR) staining
2.2.8 Oil Red O staining
2.2.9 Immunohistochemical staining
2.2.10 Serum analysis
2.2.11 Human study
2.2.12 Statistical analysis
2.3 Results
2.3.1 Increase in AAA rupture risk by triolein administration
2.3.2 Adipocytes accumulation in ruptured vascular wall
2.3.3 Pathology of area with adipocytes in vascular wall
2.3.4 Histological analyses of the ruptured area in hypoperfusion-induced
model rat
2.3.5 Correlation between the number of adipocytes in vascular wall and
AAA diameter in hypoperfusion-induced AAA model
2.3.6 Correlation between the amount of TG in human AAA wall and AAA
diameter
Chapter 3 - Appearance of adipocytes in thoracic aortic aneurysmal wall
3.1 Introduction
3.2 Materials and Methods
3.2.1 Human study
3.2.2 Histological analysis
3.3.3 Statistical analysis
3.3 Results
3.3.1 The appearance of adipocytes in human TAA tissue
3.3.2 Histological pathology of areas around adipocytes in TAA wall
3.4 Discussion
Chapter 4 - Suppressive effects of fish oil on development of abdominal
aortic aneurysm
4.1 Introduction
4.2 Materials and Methods
4.2.1 Animals
4.2.2 Fish oil administration from before the induction of hypoperfusion
in vascular wall
4.2.3 Fish oil administration from after the induction of hypoperfusion in
vascular wall
4.2.4 Sample collection
4.2.5 Histological analysis
4.2.6 Statistical analysis
4.3 Results
4.3.1 Suppressive effect of fish oil administration before the induction of
hypoperfusion on the aortic dilation
4.3.2 Suppressive effect of fish oil administration before the induction of
hypoperfusion on the degradation of collagen fibers, MMPs expression,
and oxidative stress in vascular wall
4.3.3 Suppressive effect of fish oil administration after the induction of
hypoperfusion on the AAA rupture risk
4.3.4 Suppressive effect of fish oil administration after the induction of
hypoperfusion on the accumulation of adipocytes in vascular wall
Chapter 5 - Effects of functional food factors on the degradation of fibers
in vascular wall due to nicotine
5.1 Introduction
5.2 Materials and Methods
5.2.1 Animals
5.2.2 Effects of EPA-rich fish oil on nicotine-administered vascular wall
5.2.3 Effects of sesamin and sesamolin-rich sesame extract on
nicotine-administered vascular wall
5.2.4 Sample collection
5.2.5 Histological staining
5.2.6
In situ
gelatin zymography
5.2.7 Statistical analysis
5.3 Results
5.3.1 Suppressive effect of fish oil administration on elastic fiber
destruction due to nicotine
5.3.2 Suppressive effect of fish oil administration on the expression of
MMP-12, oxidative stress, and gelatinolytic activity due to nicotine
5.3.3 Suppressive effect of sesame extract administration on collagen and
elastic fibers destruction due to nicotine
5.3.4 Suppressive effect of sesame extract administration on the
expression of MMP-12 and oxidative stress due to nicotine
5.4 Discussion
Chapter 6 - General Discussion
References
Acknowledgements
List of Publications
1
Chapter 1 - General Introduction
1.1 Abdominal aortic aneurysm (AAA)
Abdominal aortic aneurysm (AAA) is a lethal disease characterized by the irreversible dilation of the abdominal aorta (Fig. 1), and high mortality rate caused by vascular rupture with a sudden death. Vascular rupture is defined by the breakdown of the aortic structure and the retroperitoneal hemorrhage. The risk factors of AAA include advanced age, male sex, smoking, family history and hypertension.1) The detailed
molecular mechanisms underlying vascular expansion and rupture are not completely clear. AAA is a silent disease with almost no subjective symptoms. Therefore, we cannot predict the AAA rupture, and this disease is often coincidentally found at hospitals. Preventing rupture is most important in AAA treatment, because almost patients die due to hemorrhaging when AAAs rupture. A major problem with AAA treatment is that no drug to prevent rupture or inhibit expansion has been developed. Patients with increased rupture risk have no choice but to undergo surgical treatment by means of either open repair with prosthetic graft replacement or endovascular stent graft placement.2) Surgical operations involve taking various risks. Therefore, it is desirable
to establish preventive methods with drugs or diet to prevent AAA rupture.
1.2 Pathophysiology of AAA
Pathophysiology of AAA is characterized by the degradation of vascular structure due to chronic inflammation, and aortic dilation.3) These pathological events
are caused by immune cells, such as neutrophils, monocytes and macrophages, and inflammatory cytokines, including monocyte chemoattractant protein (MCP)-1, tumor necrosis factor (TNF)-α, and interleukin (IL)-6, which are increased in AAA lesion. Subsequently, increased matrix metalloproteinase (MMP) proteins derived from vascular smooth muscle cells (SMCs) and immune cells disrupt the elastin and collagen fibers those are the major structural components of the arterial extracellular matrix (ECM) and play an important role in maintaining the integrity and elasticity of the vascular wall.2, 4, 5) Indeed, pathological analyses of human AAA wall have reported an
increase in chronic inflammation characterized by MMPs expressions, and the activation of MMP-2 and MMP-9 is especially associated with aneurysm formation.6, 7)
2
Figure 1 Images of abdominal aortic aneurysm (AAA). 1: Normal region (infrarenal aortic neck). 2: Aneurysmal region (aortic aneurysm sac). Reproduced from a figure previously published in PLoS One.8)
1.3 Hypoperfusion-induced AAA animal model
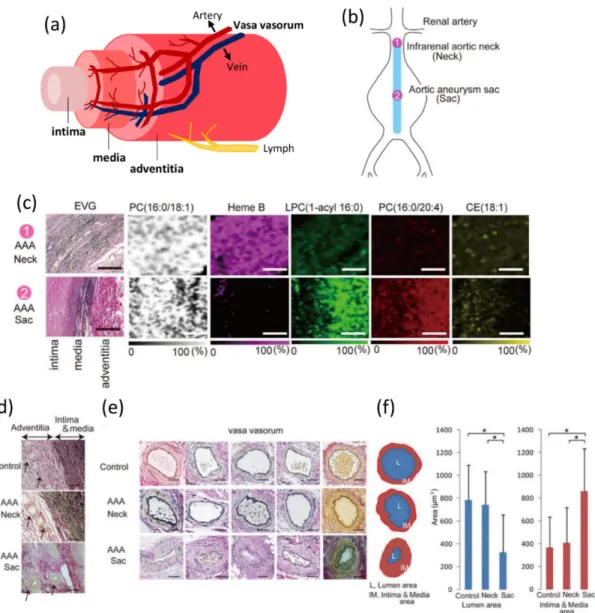
Aortic wall consists of the three layers: the intima, media and adventitia, and the adventitial wall has a blood supply system called vasa vasorum (VV) (Fig. 2a). Vascular wall is constituted by various cells such as fibroblast, SMC and endothelial cell, and these cells exert their respective functions. It is necessary to sufficiently supply oxygen and nutrients to these cells. This role is played by direct perfusion from the aortic blood flow, and perfusion via small blood vessels in the adventitial VV.9)
Previous studies obtained the finding that Heme B, a blood marker, was observed abundantly in the normal region (neck), but was hardly detected in the dilated region (sac) by analysis of the vascular wall in human AAA tissue by matrix-assisted laser desorption/ionization mass spectrometry imaging (MALDI-MSI) (Fig. 2b, c).8) The
luminal area of the VV in the sac wall was significantly smaller than that in the neck wall (Fig. 2d-f).8) Here, experimental AAA was formed by the induction of artificial
vascular hypoperfusion in the abdominal aortic wall of rat.10) Based on these findings,
the obstruction of VV and thereby the hypoperfusion of aortic wall could cause AAA formation. Formed AAAs in hypoperfusion-induced animal model have similar morphological and pathological characteristics to human AAA. Fortunately, this AAA model shows not only aortic dilation but also spontaneous rupture, and this model can be used to evaluate the effects on AAA rupture.Hypoperfusion-induced AAA model can be expected as a novel model capable of analyzing the mechanisms that is a black box in the findings on AAA.
Induction of hypoperfusion could cause lack of oxygen and nutrients. It has been reported that the response to hypoxia is closely associated with inflammatory response,11) and the expression of hypoxia-inducible factor (HIF) -1α affects various
3
inflammatory mediators.12) The production of MMP-2 and MMP-9 is increased by the
activation of HIF-1α.13, 14) HIF-1α strongly may associate with differentially expressed
genes in AAA wall.15) Vascular hypoxia due to hypoperfusion may be one of the cause of
AAA progression.
1.4 Objective of this study
Since AAA rupture is lethal, the preventing aortic rupture is most important in treatment of this disease. In this research, the mechanisms underlying AAA rupture which is not currently clarified were studied. In Chapter 2, pathological analyses of ruptured abdominal aortic walls in hypoperfusion-induced AAA model were performed to investigate the cause of AAA rupture. In Chapter 3, pathological evaluation of human thoracic aortic aneurysm (TAA) tissue was performed to obtain the findings on the difference between the type of other aortic aneurysm and the mechanism of AAA progression.
Here, as a functional food factor expected to be effective in suppressing the AAA dilation and/or rupture, the effects of fish oil on hypoperfusion-induced AAA were studied in Chapter 4. N-3 polyunsaturated fatty acids (n-3PUFAs) are fatty acids, such as eicosapentaenoic acid (EPA) and docosahexaenoic acid (DHA), which is rich in fish oil. N-3 PUFAs are already widely used as a supplement or medicine because of anti-inflammatory and anti-oxidative effects.
Among the risk factors of AAA, it has been reported that cigarette smoking is particularly associated.1, 16) In addition, nicotine which is main component of cigarette
smoke may increase not only AAA progression but also AAA rupture.17) Previous study
has revealed that nicotine could weaken the vascular wall through the degradation of fibers.18) In Chapter 5, the effects of functional food factors on the vascular wall injury
4
Figure 2 Structure of aortic wall, and the stenosis of adventitial vasa vasorum (VV) in AAA wall. (a) Schema of the structure of aortic wall, and (b) the AAA (1: Normal region (infrarenal aortic neck). 2: Aneurysmal region (aortic aneurysm sac)). (c) Comparison of the distribution of Heme B, phosphatidylcholine (PC) (16:0/18:1), lyso-PC (LPC) (1-acyl 16:0), PC (16:0/20:4), and cholesteryl ester (CE) (18:1) as analyzed by MALDI-IMS. Scale bar = 100 mm. (d) Representative adventitial VV. Scale bar = 200 mm. (e) Comparison of the luminal and intima–medial areas among the control, neck, and sac adventitial VV. Scale bar = 100 mm (f) Comparison of the luminal and intima & medial areas among the control, neck, and sac adventitial VV. Reproduced from a figure previously published in PLoS One with slight modification.8)
5
Chapter 2 - The mechanisms underlying abdominal aortic aneurysm
rupture
2.1 Introduction
Because AAA rupture is lethal, the prevention of vascular rupture is most
important for AAA treatment. It has been reported that the AAA rupture risk increases
as the aneurysm diameter increases and/or the expansion rate increases. Currently, the mechanisms underlying AAA progression and rupture has not been elucidated, and there is no effective medical treatment for preventing rupture of AAA. In hypoperfusion-induced AAA animal model, spontaneous vascular rupture was observed.10) Histological
analyses of ruptured walls in hypoperfusion-induced model are suitable for studies on the elucidation of the mechanisms underlying AAA rupture.10) However, the rupture rate
in this animal model was too low (around 10%) to obtain enough samples for pathological analysis of the ruptured walls. Here, the administration of triolein, a triglyceride (TG) species, increased rupture risk in this model. In this research, pathological change between the non-ruptured and ruptured AAA tissues in triolein-administered rats was compared to elucidate the mechanisms underlying AAA rupture.
2.2 Materials and Methods
Materials and methods in this chapter were previously described in Sci. Rep. with slight modifications.19)
2.2.1 Animals
All animal experiments were approved by the Kindai University Animal Care and Use Committee and performed according to the Kindai University Animal Experimentation Regulations (Approval number; KAAG-25-001). Six-week-old male Sprague-Dawley rats (SHIMIZU Laboratory Supplies Co., Ltd, Kyoto, Japan) were provided with food (Table 1) and water ad libitum, in a humidity-controlled room, with a 12-hour light and 12-hour dark cycle. The room temperature was maintained at 25 ± 1 °C. After acclimatization for a week, the induction of hypoperfusion in abdominal aortic wall was performed in all rats to induce AAA. Rats were then orally administrated either water (control group) (n=16), or triolein (n=24) (1145 mg/kg body weight/day) for 4 weeks. Aortic diameters were then measured, and the rats sacrificed. When a rat died by AAA rupture, the aortic diameter was measured and the abdominal aorta immediately isolated. All surgery was performed under anesthesia, and all efforts were made to minimize suffering.
6
Table 1 Diet composition
2.2.2 Induction of hypoperfusion in abdominal aortic wall (Fig. 3)
Induction of hypoperfusion in abdominal aortic wall in rats was performed as previously described.20) First, the infrarenal aorta was exfoliated from the perivascular
tissue. Next, the vessels branching from the abdominal aorta were ligated with a 5-0 silk string (Akiyama Seisakusyo Co., Tokyo, Japan) to block blood supply at a point away from the aorta that does not narrow the aortic lumen. The abdominal aorta was ligated with a 5-0 silk string just below the renal artery and just above the bifurcation of the aorta to block aortic blood flow. A plastic catheter (Medikit, Tokyo, Japan), shortened to 9 mm in length, was inserted via a small incision adjacent to the renal artery branches, and the incision was then repaired with a 6-0 monofilament string (Alfresa Pharma, Osaka, Japan). The abdominal aorta was ligated with a 5-0 silk string together with the plastic catheter. Finally, the 5-0 silk string that blocked the blood in the aorta was untied and blood flow was initiated again. Using this treatment, hypoperfusion is induced in the aortic wall only while blood flow is maintained in the vascular lumen.
7
Figure 3 Induction of abdominal aortic wall hypoperfusion. (a) The infrarenal aorta is exfoliated from the perivascular tissue. (b) Vessels branching from the abdominal aorta are ligated with a 5-0 silk string to block the blood supply, and the abdominal aorta is ligated with a 5-0 silk string just below the renal artery and just above the bifurcation of the aorta to block the aortic blood flow. (c) A plastic catheter shortened to 8–10 mm long is inserted via a small incision adjacent to the renal artery branches. (d) The incision is then repaired with a 6-0 monofilament string and the abdominal aorta is ligated with a 5-0 silk string together with the plastic catheter. (e) The 5-0 silk string blocking the blood flow in the aorta is untied.
2.2.3 Sample collection
The diameter of abdominal aorta was measured using digital calipers (A&D, Tokyo, Japan). The dilation ratio was calculated according to the following formula: dilation ratio (sac/neck) = maximal aneurysm diameter / non-dilated aortic diameter. Aneurysm formation was considered to be formed when the dilation ratio was greater than two. Isolated tissues were fixed in 4% paraformaldehyde (PFA) (Nacalai Tesque, Kyoto, Japan), soaked in sucrose (10%, 15% and 20%), and then embedded in O.C.T. Compound (Sakura Finetek Japan Co., Ltd.). These were stored at −80 °C until required. 2.2.4 Histological analysis
Abdominal aortae were cut with a cryostat (CM1850; Leica Microsystems, Wetzlar, Germany) into 10-µm-thick sections, and mounted on glass slides. Tissue
8
sections were subjected to Hematoxylin-Eosin (HE) staining, Elastica van Gieson (EVG) staining, Picrosirius red (PSR) staining, Oil Red O staining and immunohistochemical staining. Quantitative analysis of histological staining was performed using ImageJ software (National Institutes of Health, Bethesda, Maryland, USA). Areas within 100 µm of an adipocyte were defined as ‘around adipocyte’.
2.2.5 Hematoxylin-Eosin (HE) staining
PFA-fixed tissue sections were placed in hematoxylin for nuclear staining for 10 minutes, and then decolorized in acid alcohol (1% hydrochloric acid (HCl) in 70% ethanol). After rinsing in tap water, the sections were stained with eosin for 5 minutes, and then dehydrated in ethanol (80%, 90%, and 100%). Thereafter, the sections were cleared in xylene and covered with a lipid-soluble mounting medium, Entellan○R New (Merck
KGaA, Germany), and glass cover slips. Quantitative analysis of the thickness of the aortic wall was performed.
2.2.6 Elastica van Gieson (EVG) staining
PFA-fixed tissue sections were stained in resorcin-fuchsin solution for 30 minutes. After rinsing in tap water, the tissue sections were stained for 10 minutes in a 1:1 mixture of Weigert’s iron hematoxylin solution I (1% hematoxylin in ethanol) and solution II (2% ferric chloride in 0.25% HCl). After rinsing with tap water, the sections were stained with 1% fuchsin solution, diluted 3:20 in van Gieson P solution, for 3 minutes. The tissue sections were dehydrated in ethanol (70%, 90%, and 100%), cleared in xylene, and covered with a lipid-soluble mounting medium and glass cover slips. Elastic lamina was categorized into 4 grades: intact elastic lamina was designated grade 1; deletion of wave form or/and dilution of elastic lamina was designated grade 2; partial disappearance of elastic lamina was designated grade 3; and disappearance of elastic lamina was designated as grade 4, with this being the worst state (Fig. 4). EVG stained-sections were then used for the measurement of medial wall thickness.
2.2.7 Picrosirius red (PSR) staining
PFA-fixed tissue sections were stained in Weigert’s iron hematoxylin solution for 10 minutes. The tissue sections were then decolorized in acid alcohol (1% HCl in 70% ethanol). After rinsing in tap water, the tissue sections were stained in 1% Sirius Red (Waldeck) solution, diluted 1:20 in van Gieson P solution, for 10 minutes. The tissue sections were dehydrated in 100% ethanol and covered with a lipid-soluble mounting medium. Quantitative analysis of collagen-positive areas was performed.
9
Figure 4 Elastin grade. (a) Intact elastic lamina (grade 1), (b) deletion of wave form or/and dilution of elastic lamina (grade 2), (c) partial disappearance of elastic lamina (grade 3), and (d) disappearance of elastic lamina (grade 4). Scale bar = 100µm.
2.2.8 Oil Red O staining
PFA-fixed tissue sections were rinsed in 60% isopropanol for 1 minute. The tissue sections were then incubated in Oil Red O solution for 10 minutes. After rinsing in 60% isopropanol for 1 minute, the tissue sections were placed in hematoxylin for nuclear staining for 5 minutes. After rinsing in tap water, slides were covered with an aqueous mounting medium (Nichirei Biosciences, Tokyo, Japan) and glass cover slips. 2.2.9 Immunohistochemical staining
PFA-fixed tissue sections were rinsed in phosphate-buffered saline (PBS) with 1% Triton-X100 and then incubated in 10% oxalic acid for 1 hour. For antigen activation, 0.1% trypsin in PBS was added to the tissue sections. Endogenous horseradish peroxidase (HRP) in the tissue sections was blocked using 3% aqueous hydrogen peroxide in methanol for 8 minutes. After washing in PBS, the tissue sections were blocked with Blocking One Histo. The sections were incubated with the appropriate primary antibody overnight at 4 °C. The histological results from the aortic wall were assessed after staining using the following antibodies: rabbit anti-matrix metalloproteinase (MMP) 2 (1:100; Thermo Scientific), goat anti-MMP9 (1:100; Santa Cruz Biotechnology, Inc.), rabbit anti-MCP-1 (1:50; Novus Biologicals), mouse anti-monocytes/macrophages (MAC387) (1:50; Bio-Rad Laboratories), mouse anti-α-smooth muscle actin (1:400; Santa Cruz Biotechnology, Inc.), rabbit anti-CD163 (1:100; Bioss Antibodies). On the following day, the sections were rinsed in PBS, and incubated with the appropriate secondary antibody conjugated to HRP. Slides were developed with DAB (Vector Laboratories,
10
Burlingame, CA, USA), dehydrated in ethanol (80%, 90%, and 100%), cleared in xylene, and covered with a lipid-soluble mounting medium and glass cover slips.
2.2.10 Serum analysis
Blood samples were collected from rats after 4 weeks of the AAA induction. Serum TG concentration and total cholesterol concentrations were measured, respectively, with triglyceride kit and total cholesterol kit (Wako Pure Chemical industries, Osaka, Japan).
2.2.11 Human study
The study protocol was reviewed and approved by the Hamamatsu University School of Medicine Ethics Committee of Clinical Research (The Ethic Committee’s approval number is 20372012). All procedures used in this study were carried out in accordance with the Clinical Research Ethics Committee of Hamamatsu University School of Medicine. Aortic tissues were collected from patients who underwent elective open surgery for the repair of infra-renal AAA. Aortic diameters were measured pre-operatively by three-dimensional multi-detector computed tomography imaging of the AAA. During surgery, longitudinal tissue strips were collected from the aorta, from the nearby distal portion of the bifurcation of the renal artery to the region of maximal dilation of the aneurysm. The patients were all male, 58 to 89 years old (mean age 69.8 ± 12.0 years). Tissue samples were preserved in rapid freeze storage until required for analysis with biochemical quantitation. Total lipids were extracted from homogenized tissue.
2.2.12 Statistical analysis
Values were expressed as mean ± S.E.M. For between-group comparisons, the Chi-square test or Fisher’s exact test (for situations with small frequencies) was used for categorical variables. Student’s t test for continuous data with Tukey-Kramer test and Mann-Whitney test for scoring data were used. Kaplan–Meier method was used for analysis of survival analysis, and intergroup differences were evaluated by the log-rank test with Holm adjustment for multiple comparisons. A P-value < 0.05 was considered to indicate a statistically significant difference. Statistical analyses were performed using StatView 5.0 software (SAS Institute, Cary, USA) and R 3.2.0 with the EZR package.21)
11
2.3 Results
2.3.1 Increase in AAA rupture risk by triolein administration
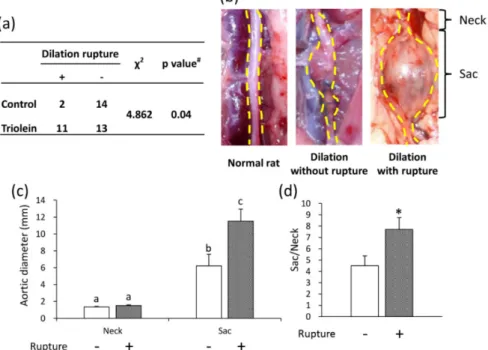
The triolein administered group significantly increased AAA rupture risk compared with the control group (Fig. 5a). The triolein group was divided into a non-ruptured group and a non-ruptured group. Aneurysm formation was observed in both groups, and area with a non-dilated diameter (neck) was observed in both groups (Fig. 5b). The diameter of the dilated aorta (sac) and the dilation ratio (sac/neck) in the ruptured group were significantly increased compared with those in the non-ruptured group (Fig. 5c, d). The initial body weight (g) was not significantly different between the non-ruptured group (239.5 ± 24.0 (g)) and the ruptured group (250.7.5 ± 22.5 (g)). The gain in body weight (g) were not significantly different between the non-ruptured group (4.01 ± 1.1 (g)) and the ruptured group (4.47 ± 1.0 (g)). Serum TG levels were not significantly different between the non-ruptured group (150.0 ± 20.2 (mg/dL)) and the ruptured group (163.2 ± 15.8 (mg/dL)). Total cholesterol levels were not significantly different between the non-ruptured group (61.8 ± 8.2 (mg/dL)) and the ruptured group (67.1 ± 6.4 (mg/dL)).
Figure 5 Effects of triolein administration on AAA rupture and aortic diameter. (a) Effect of triolein administration on AAA rupture ratio. Data are presented as number of rats. #P value of Fisher’s exact test. (b) Representative images of the abdominal aorta from a normal rat and from rats in the triolein administered group. (c) Aortic diameter. (d) Dilation ratio (sac/neck). Data are the mean ± S.E.M. Non-ruptured (n = 13), ruptured (n = 11). Values with different letters are significantly different (P < 0.05). *P < 0.01 versus non-ruptured group. Reproduced from a figure previously published in Sci. Rep.19)
12
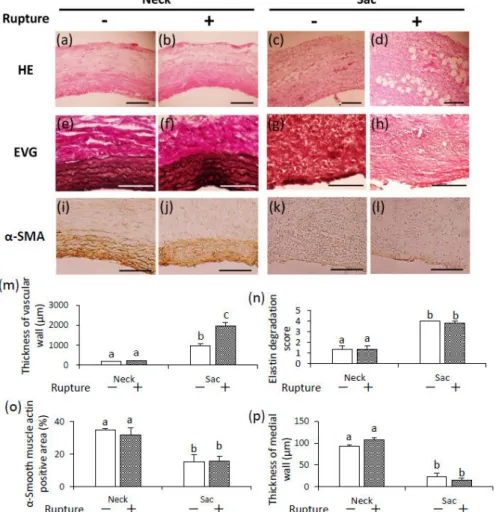
The vascular wall thickness was significantly increased in the AAA sac wall in both ruptured and non-ruptured groups compared with the neck wall (Fig. 6a-d, m). The t vascular wall thickness in the AAA sac wall of the ruptured group was significantly increased compared with that of the non-ruptured group (Fig. 6m). Elastin fibers were observed by EVG staining (Fig. 6e-h). Elastin degradation score was not significantly different between groups (Fig. 6n). Areas positive for SMCs and the thickness of medial wall in the AAA sac wall were significantly decreased compared with those in the neck wall (Fig. 6i-l, o, p). However, there was no difference between the thickness of the medial wall between groups (Fig. 6p).
Figure 6 Thickness of vascular wall, elastin degradation score, and thickness of medial wall. (a-d) Representative images of HE staining (scale bar = 200 µm), (e-h) EVG staining (scale bar = 100 µm), and (i-l) immunostaining for α-smooth muscle actin (scale bar = 100 µm). (m) Quantification of vascular wall thickness, (n) elastin degradation scores, (o) α-smooth muscle actin-positive areas, and (p) medial wall thickness. Data are the mean ± S.E.M. Non-ruptured (n = 5), ruptured (n = 5). Values with different letters are significantly different (P < 0.05). Reproduced from a figure previously published in Sci. Rep. with slight modification.19)
13
2.3.2 Adipocytes accumulation in ruptured vascular wall
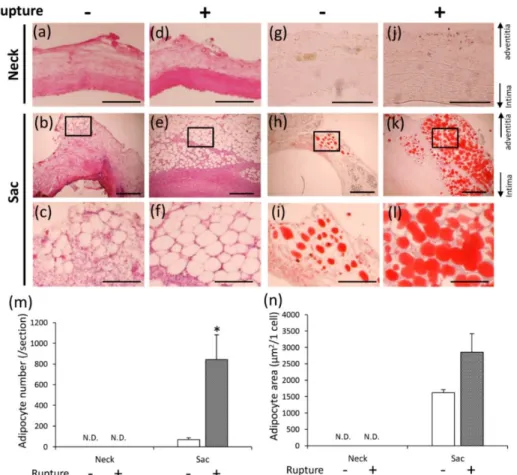
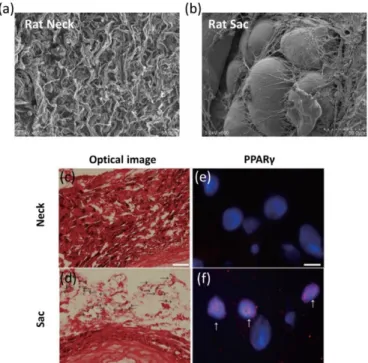
Adipocyte-like cells were observed in the adventitial sac wall in both groups, but not in the neck wall (Fig. 7a-f).
Figure 7 Adipocyte accumulation in non-ruptured and ruptured groups. (a-f) Representative images of HE staining (a, c, d, f: scale bar = 200 µm; b, e: scale bar = 500 µm), and (g-l) Oil Red O staining (g, j: scale bar = 100 µm; h, k: scale bar = 500 µm; i, l: scale bar = 200 µm). The square area in the middle panels is magnified in the bottom panels. (m) Quantification of adipocyte number, and (n) adipocyte area in the non-ruptured and ruptured groups. Data are the mean ± S.E.M. Non-ruptured (n = 7), ruptured (n = 8). *P < 0.01 versus non-ruptured group. N.D. = not detected. Reproduced from a figure previously published in Sci. Rep.19)
These adipocyte-like cells possessed the characteristic morphology of adipocytes as shown in Electron microscopy (Fig. 8b). Peroxisome proliferator-activated receptor γ (PPARγ) was detected in the nucleus of these cells (Fig. 8f), and adipocyte-like cells in the AAA sac wall stained positively with Oil Red O staining (Fig. 7g-l). Therefore, adipocyte-like cells were determined to be adipocytes.
14
The number of adipocytes (/section) in the vascular wall of the AAA sac in the ruptured group was significantly increased compared with the non-raptured group (Fig. 7m). The size of adipocytes (µm2/cell) tended to increase in the ruptured group (Fig. 7n).
Figure 8 Observation of adipocyte and PPARγ staining. Representative electron microscopic image of the vascular wall of the AAA neck (a) and sac (b) from a model rat. Representative optical images of the neck (c) and sac (d) (Scale bar = 200 µm). Representative images of PPARγ staining of neck (e) and sac (f) (Scale bar = 10 µm). Red: PPARγ. Blue: nucleus. Reproduced from a figure previously published in Sci. Rep.19)
2.3.3 Pathology of area with adipocytes in vascular wall
In order to elucidate the pathological significance of ectopic vascular adipocytes, the regions surrounding adipocytes in the vascular wall were analyzed. The ruptured tissues were divided into two groups: area with adipocytes and area without adipocytes. Collagen fibers in the vascular wall were observed by PSR staining (Fig. 9a-e). Collagen-positive areas were significantly decreased in the AAA sac wall compared with the AAA neck wall (Fig. 9p). Collagen-positive areas were significantly decreased in the ruptured group compared with the non-ruptured group (Fig. 9p). In addition, collagen-positive areas were significantly decreased in the areas with adipocytes compared with the areas without adipocytes (Fig. 9p).
15
Because collagen fibers degradation was enhanced in the areas with adipocytes, immunohistochemical examination for MMP-2 (Fig. 9f-j) and MMP-9 (Fig. 9k-o) was performed. Areas positive for MMP-2 and MMP-9 were significantly increased in the AAA sac wall compared with the AAA neck wall (Fig. 9q, r). Areas positive for MMP-2 and MMP-9 in the AAA sac wall between the non-ruptured and the ruptured groups were not significantly different (Fig. 9q, r). On the contrary, areas positive for MMP-2 and MMP-9 in areas with adipocytes were significantly greater compared with areas without adipocytes in the AAA sac wall (Fig. 9q, r).
Figure 9 Observation of collagen fibers, and immunohistochemical staining for MMP-2 and MMP-9. (a-e) Representative images of PSR staining (scale bar = 200 µm), and (f-j) immunostaining for MMP-2 (scale bar = 50 µm) and (k-o) MMP-9 (scale bar = 50 µm). (p) Quantification of the collagen-positive area, (q) MMP-2 positive areas, and (r) MMP-9 positive areas of the vascular wall. Data are the mean ± S.E.M. Values with different letters are significantly different (P < 0.05). Reproduced from a figure previously published in Sci. Rep.19)
16
To clarify the mechanisms underlying the increased areas positive for MMP-2 and MMP-9 and the decreased collagen in the areas with adipocytes, immunohistochemical examination for MCP-1 (Fig. 10a-e), Mac387+
monocytes/macrophages (potentially M1-like macrophages) (Fig. 10f-j), and CD163+
macrophages (consistent with M2-like macrophages) (Fig. 10k-o) was performed. Areas positive for MCP-1, Mac387, and CD163 were significantly increased in the AAA sac wall compared with the AAA neck wall (Fig. 10p-r). Areas positive for MCP-1, Mac387, and CD163 in the AAA sac wall between the non-ruptured and the ruptured groups were not significantly different (Fig. 10p-r). On the contrary, areas positive for MCP-1, Mac387, and CD163 in areas with adipocytes were significantly greater compared with areas without adipocytes in the AAA sac wall (Fig. 10p-r).
Figure 10 Immunohistochemical staining for MCP-1, Mac387 and CD163. (a-e) Representative images of immunostaining for MCP-1 (scale bar = 50 µm), (f-j) Mac387+
monocytes/macrophages (scale bar = 50 µm), and (k-o) CD163 (scale bar = 50 µm). (p) Quantification of the MCP-1-positive area, (q) Mac387+ monocyte/macrophage-positive areas,
and (r) CD163-positive areas of the vascular wall. Data are the mean ± S.E.M. Values with different letters are significantly different (P < 0.05). Reproduced from a figure previously published in Sci. Rep. with slight modification.19)
17
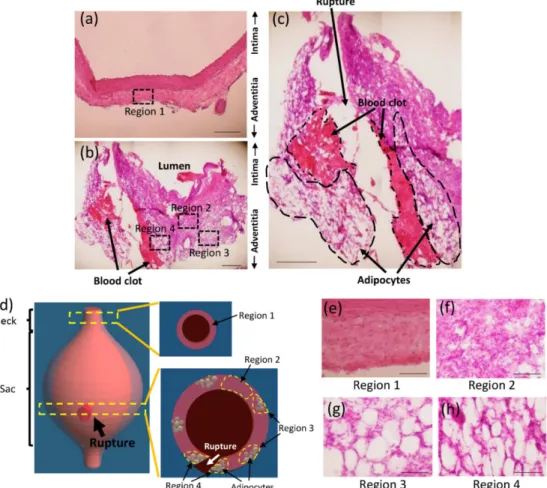
2.3.4 Histological analyses of the ruptured area in hypoperfusion-induced model rat The ruptured area was successfully identified in hypoperfusion-induced model. The intraperitoneal abundance of blood clot was observed (Fig. 11a). Following careful removal of the blood clot, the ruptured area in the vascular wall was identified (Fig. 11b and c).
Figure 11 Images of the ruptured AAA. Ruptured AAA pictured before washing away blood (a) and after washing away blood (b). Schema of the ruptured AAA (c). Reproduced from a figure previously published in J. Oleo Sci.22)
Pathological analyses were performed in the ruptured area. Figure 12a showed the neck wall, and Figure 12b and c showed the cross-section around the ruptured area. The blood clot and adipocytes were observed along the tear in the aortic wall (Fig. 12b, c). Next, the aortic wall were divided into the four groups as shown in Figure 12d: neck area, designated as region 1; sac area without adipocytes, designated as region 2; sac area with adipocytes away from the tear in the aortic wall, designated as region 3; and sac area with adipocytes along the tear in the aortic wall, designated as region 4 (Fig. 12a, b, d-h).
18
Figure 12 Histological analyses of the ruptured AAA wall. Representative images of AAA neck wall (a) and sac wall (b). AAA ruptured area is magnified in the panel (c). (a: scale bar = 200 µm; b, c: scale bar = 500 µm). (d) Aortic wall areas were divided into four groups. Region 1: neck wall (e), region 2: sac wall without adipocytes (f), region 3: sac wall with adipocytes away from the tear in the aortic wall (g) and region 4: sac wall with adipocytes along the tear in the aortic wall (h). (e-h: scale bar = 100 µm). Reproduced from a figure previously published in J. Oleo Sci.22)
Collagen positive areas were significantly decreased in the regions 2, 3, and 4 compared with those in the region 1 (Fig. 13a-d, q). In addition, collagen positive areas were significantly decreased in the regions 3 and 4 compared with those in the region 2 (Fig. 13a-d, q). Collagen positive areas were not significantly different between the regions 3 and 4 (Fig. 13a-d, q). Areas positive for MMP-2, MMP-9, and Mac387+
monocytes/macrophages in each group were evaluated by immunohistochemical staining (Fig. 13e-p). Areas positive for MMP-2, MMP-9, and Mac 387+ monocytes/macrophages
were significantly increased in the regions 2 to 4 compared with those in region 1 (Fig. 13r-t). In addition, areas positive for MMP-2, MMP-9, and Mac 387+
19
monocytes/macrophages were significantly increased in the regions 3 and 4 compared with those in the region 2 (Fig. 13r-t). Areas positive for MMP-2, MMP-9, and Mac387+
monocytes/macrophages were not significantly different between the regions 3 and 4 (Fig. 13r-t).
Figure 13 PSR staining and immunohistochemical staining for MMP2, MMP9 and MAC387+
monocytes/macrophages. (a-d) Representative images of PSR staining, and (e-h) immunostaining for MMP-2, (i-l) MMP-9, and (m-p) Mac387+ monocytes/macrophages. Scale
bar = 50 µm. (q) Quantification of the collagen-positive area, (r) MMP-2 positive area, (s) MMP-9 positive area, and (t) Mac387+ monocyte/macrophage positive area. Data are the
mean ± S.E.M. Values with different letters are significantly different (P < 0.05). Reproduced from a figure previously published in J. Oleo Sci. with slight modification.22)
20
2.3.5 Correlation between the number of adipocytes in vascular wall and AAA diameter in hypoperfusion-induced AAA model
Histological analyses suggested that the ectopic appearance of adipocytes in the aortic wall could be closely associated with AAA rupture. Next, the relationship between vascular adipocytes and AAA diameter was investigated in hypoperfusion-induced model. The dilation ratio was correlated with the number of adipocytes in the aortic wall in hypoperfusion-induced model (Fig. 14a). The dilation ratio was not correlated with the size of adipocytes in the aortic wall in hypoperfusion-induced model (Fig. 14b). In addition, the number and size of adipocytes was not correlated with the body weight in hypoperfusion-induced model (Fig. 14c, d). Next, the relationship among the serum lipids, AAA diameter, and the number of adipocytes. Serum TG and total cholesterol levels were not correlated with the dilation ratio (Fig. 14e, f). In addition, serum TG and total cholesterol levels were not correlated with the number of adipocytes in the aortic wall (Fig. 14g, h).
Figure 14 Relationships between adipocytes in the vascular wall, the dilation ratio (sac/neck), and body weight. The dilation ratio versus the number of adipocytes (a), and the size of adipocytes in aortic wall (b). Body weight versus the number of adipocytes (c), and the size of adipocytes in aortic wall (d). The dilation ratio versus serum triglyceride levels (e), and serum total cholesterol levels (f). The number of adipocytes in aortic wall versus serum triglyceride levels (g), and serum total cholesterol levels (h). Reproduced from a figure previously published in J. Oleo Sci. with slight modification.22)
21
2.3.6 Correlation between the amount of TG in human AAA wall and AAA diameter The relationship between the TG content in human AAA tissue and AAA diameter was studied. The abnormal appearance of adipocytes was mainly observed in the adventitial region in both human and animal model (Fig. 15a-c). The human AAA vascular wall was divided into two groups: 1) the intima and media, and 2) the adventitia. The amount of TG in the adventitia was correlated with AAA diameter, but not in the in the intima and media (Fig. 15d). The amount of total cholesterol in the aortic tissue was not correlated with AAA diameter (Fig. 5e).
Figure 15 Correlation between lipids in the aortic wall and the aortic diameter in human AAA samples. Appearance of adipocytes in human AAA tissues (a, b), and in hypoperfusion-induced animal model (c). The abnormal appearance of adipocytes in human AAA vascular wall has been previously reported.23) (d) The amount of triglyceride in aortic wall versus the
aortic diameter (mm). (e) The amount of total cholesterol in aortic wall versus the aortic diameter (mm). Reproduced from a figure previously published in Sci. Rep.19)
The amount of TG in the aortic tissue was not correlated with serum TG levels (Fig. 16a), serum total cholesterol levels (Fig. 16b), or body mass index (BMI) (Fig. 16c). The amount of total cholesterol in the aortic tissue was not correlated with serum TG levels (Fig. 16d), serum total cholesterol levels (Fig. 16e), or BMI (Fig. 16f). The AAA diameter was also not correlated with serum TG levels (Fig. 16g), serum total cholesterol levels (Fig. 16h), or BMI (Fig. 16i).
22
Figure 16 Relationships between serum lipids (triglyceride (TG) and total cholesterol), BMI and aortic diameter in human AAA samples. The amount of TG in aortic wall versus serum TG levels (a), serum total cholesterol levels (b), and body mass index (BMI) (c). The amount of total cholesterol in aortic wall versus serum TG levels (d), serum total cholesterol levels (e), and BMI (f). Aortic diameter versus serum TG levels (g), serum total cholesterol levels (h) and BMI (i). Aortas were divided into two groups: 1) intima and media, and 2) adventitia. Reproduced from a figure previously published in Sci. Rep.19)
23
2.4 Discussion
Vascular dilation was significantly promoted in the ruptured group (Fig. 5, 6). Histological analyses showed that adipocytes were observed in the sac wall, but not in the neck wall (Fig. 7). This ectopic appearance of adipocytes has been previously reported in human tissues,24) and the pathology in hypoperfusion-induced model was consistent
with the pathology in human AAA. The number of adipocytes in the AAA sac wall in ruptured group was significantly increased (Fig. 7). In the areas with adipocytes, the destruction of collagen fibers and the increase of MMP-2 and MMP-9 expressions were observed (Fig. 9). In addition, the increase of positive areas for MCP-1 and macrophages was observed in the areas with adipocytes (Fig. 10). Therefore, it was suggested that adipocytes accumulated in the vascular wall can induce the chronic inflammation around adipocytes in the aortic wall. It has been reported that hypertrophic adipocytes due to lipid accumulation could cause chronic inflammation in tissues25, 26), and adipocytes
themselves secrete MMP-2 and MMP-9.27) It is speculated that hypertrophic adipocytes
can promote the production of MCP-1, induce the infiltration of macrophages into the areas surrounding adipocytes, and increase the MMP-2 and MMP-9 expressions. The collagen fibers degradation around adipocytes could be enhanced, and thereby the aortic wall weakness and aortic rupture could be accelerated.
Pathological analyses along the tear in the ruptured wall showed many adipocytes in the adventitial wall (Fig. 12). Collagen-positive areas significantly decreased and the protein levels of MMPs and positive areas of monocytes/macrophages significantly increased in this region with adipocytes (Fig. 13). These findings strongly suggest the hypothesis that the abnormal appearance of adipocytes in the vascular wall can be closely involved in AAA rupture.
The amount of TGs in the adventitia was correlated with AAA diameter in human AAA (Fig. 15). In human AAA wall, ectopic adipocytes were observed in the adventitia (Fig. 15). Therefore, the increase of the amount of TGs in the adventitia imply the increase and hypertrophy of adipocytes in the adventitia. In addition, the number of adipocytes was correlated with the aortic dilation ratio in hypoperfusion-induced AAA model (Fig. 14). In human clinical studies, the risk of death from AAA rupture has been reported to correlate with serum TG levels.28, 29) Increased serum TG levels might induce
adipocytes hypertrophy in human AAA wall. However, this study reported that aortic diameter was not correlated with serum TG levels in AAA patients and hypoperfusion-induced model. Further studies are needed to validate the correlation between serum TG levels and AAA.
24
Figure 17 Proposed mechanisms underlying AAA rupture. Vascular hypoperfusion due to the stenosis of adventitial vasa vasorum (VV) may cause the degradation of collagen and elastin fibers and the abnormal appearance of adipocytes in the vascular wall. Hypertrophic adipocytes may induce the recruitment of macrophages around adipocytes. These immune cells may increase matrix metalloproteinase (MMP) -2 and MMP-9 expressions and degrade collagen fibers around adipocytes. The weak vascular wall around adipocytes can tend toward AAA rupture. Reproduced from a figure previously published in J. Oleo Sci. with slight modification.22)
Figure 17 shows the hypothesis of mechanisms underlying uninvited vascular adipocytes-related AAA rupture. Stenosis of the VV occurs in the aortic wall and triggers the degradation of vascular fibers with chronic inflammation and abnormal adipocytes appearance. Adipocytokines secreted from adipocytes may be involved in one of the causes of AAA progression and rupture due to abnormal appearance of adipocytes in the aortic wall. Immune cells such as macrophages accumulate in tissues surrounding adipocytes by secretion of MMPs due to hypertrophic adipocytes. It is speculated that vulnerable areas are developed in the aneurysm wall by the increased number of adipocytes. Doderer et al. also reported the adventitial adipogenic degeneration of the vascular wall in human AAA.30) Krueger et al. reported an increase in inflammation
related factors around adipocytes in the adventitial region of human aneurysm tissue.31)
The mechanisms underlying the appearance of adipocytes and the pathological significance of adipocytes in AAA remain unknown, and further studies are necessary. The appropriate control of vascular adipocytes may treat or prevent AAA rupture.
25
Chapter 3 - Appearance of adipocytes in thoracic aortic aneurysmal wall
3.1 Introduction
Thoracic aortic aneurysm (TAA) is a vascular disease characterized by the gradual and irreversible pathological dilation of the thoracic aortic aorta. The mortality rate due to TAA rupture is very high, and risk factors for TAA include age, sex, hypertension, hyperlipidemia, smoking, and family history.32) The underlying molecular
mechanisms in TAA progression and rupture are still largely unknown. Here, AAA is the most common aneurysm type. It was described in Chapter 2 that the abnormal appearance of adipocytes in aortic wall was strongly associated with AAA rupture risk. However, it was recently reported that adipocytes accumulation was not observed in the vascular wall of popliteal artery aneurysm (PAA), in which rupture is rare.30) Therefore,
the appearance of adipocytes in the vascular wall may be not common pathology among aneurysms formed in different aortae. Whether adipocytes abnormally appear in the TAA wall remains unknown. This study aimed to investigate the relation between adipocytes in the vascular wall and TAA by the pathological analysis of the human TAA walls.
3.2 Materials and Methods
Materials and methods in this chapter were previously described in J. Oleo Sci. with slight modifications.33)
3.2.1 Human study
This study was approved by the Ethical Review Committee of the National Cerebral and Cardiovascular Center and Kindai University. Aortic tissue was collected from patient with TAA undergoing operation by artificial vessel replacement. Control thoracic aortic tissue was collected from surgical specimen. The specimens of the thoracic aortic wall were cut out for analyses, immediately frozen, and stored at -80° C. Availability of specimen size was at least 20×5 mm.
Characteristic of patients are presented in Table 2. The study subjects were patients with ascending aortic aneurysm or descending aortic aneurysm. The present study comprised controls (n=5) and patients with TAA (n=7) with a mean are of 57.6 ± 18.1 years and 69.1 ± 9.4, respectively.
26
Table 2 Characteristic of patients
Reproduced from a figure previously published in J. Oleo Sci.33)
3.2.2 Histological analysis
Aortic tissue cross-sections (10-µm-thick) were prepared using a cryostat (CM1850; Leica Microsystems, Wetzlar, Germany), and aortic walls were used for pathological examinations. Immunohistochemical staining was performed as described in Chapter 2.The patency rate of VV (%) was calculated by dividing the lumen area by the entire area of VV and lumen.
3.3.3 Statistical analysis
Values were expressed as mean ± S.D. Statistical differences were determined by the Mann-Whitney U-test and the Scheffe test. The P-value <0.05 was considered to indicate a statistically significant difference. Statistical analyses were performed using StatView 5.0 software (SAS Institute, Cary, USA).
27
3.3 Results
3.3.1 The appearance of adipocytes in human TAA tissue
The appearance of adipocytes was mainly observed in the adventitia in both human control and TAA walls (Fig. 18A-C), and these adipocytes stained positively with Oil Red O staining (Fig. 18D-F). Adipocytes areas in the vascular wall were significantly increased in the TAA wall compared to the control wall (3.6 ± 4.4 % in the control group, 20.7 ± 11.7 % in the TAA group) (Table 3).
Table 3 Adipocyte area
28
Collagen positive areas were significantly decreased in the TAA wall compared with the control wall (Fig. 18G-J). In addition, collagen positive areas were significantly decreased in the region with adipocytes compared with the region without adipocytes in the TAA wall (Fig. 18G-J).
Figure 18 Observation of the adipocytes and collagen fibers in TAA wall. (A-C) Representative images of EVG staining (scale bar = 400 µm), (D-F) Oil Red O staining (scale bar = 400 µm), and (G-I) PSR staining (scale bar = 400 µm). (J) Quantification of collagen-positive area in the vascular wall. Data are the mean ± S.D. Values with different letters are significantly different (P <0.05) by analysis of variance followed by Scheffe test. Control (n = 5), TAA (n = 7). Reproduced from a figure previously published in J. Oleo Sci.33)
29
3.3.2 Histological pathology of areas around adipocytes in TAA wall
Immunohistochemical analyses for MMP-2 (Fig. 19A-C), MMP-9 (Fig. 19D-F), and Mac387+ monocytes/macrophages (Fig. 19G-I) were performed. Areas positive for
MMP-2, MMP-9 and Mac387+ monocytes/macrophages were significantly increased in
the TAA wall compared with the control wall (Fig. 19J-L). In addition, areas positive for MMP-2, MMP-9 and Mac387+ monocytes/macrophages were significantly increased in
the region with adipocytes compared with the region without adipocytes in the TAA wall (Fig. 19J-L). VVs in TAA walls were observed (Fig. 20A-H). However, VV stenosis was not observed in this experimental group (Fig. 20I).
Figure 19 Immunohistochemical staining for MMP-2, MMP-9, and Mac387+
monocyte/macrophage. (A-C) Representative images of immunostaining for MMP-2 (scale bar = 50 µm), (D-F) MMP-9 (scale bar = 50 µm), and (G-I) Mac387 (scale bar = 50 µm). (J) Quantification of MMP-2 positive area, (K) MMP-9 positive area, and (L) Mac387 positive area in the vascular wall. Data are the mean ± S.D. Values with different letters are significantly different (P <0.05) by analysis of variance followed by Scheffe test. Control (n = 5), TAA (n = 7). Reproduced from a figure previously published in J. Oleo Sci.33)
30
Figure 20 Observation of adventitial vasa vasorum (VV). Representative images of VV in the control wall (A-D), and in the TAA wall (E-H) (scale bar = 50 µm). (I) Quantification of patency rate of VV in control and TAA walls. Statistical differences were determined by the Mann-Whitney U-test. Data are the mean ± S.D. Control (n = 5), TAA (n = 7). Reproduced from a figure previously published in J. Oleo Sci.33)
3.4 Discussion
The appearance of adipocytes, and the destruction of collagen fibers and increase of MMP-2 and MMP-9 expressions surrounding adipocytes were observed in human TAA tissue (Fig. 18, 19). The weakening of the vascular wall due to ectopic adipocytes may be related to not only AAA but also TAA.
TAA is divided into 3 types: aneurysm of ascending aorta, aortic arch aorta, and descending aorta. The mechanisms underlying TAA progression may be dependent on the part of aorta. Perivascular adipose tissue (PVAT) may be associated with the vascular function, inflammation, and diseases,34) and the increased epicardial adipose tissue may
lead to the ascending aortic dilation.35) In this study, the effect of adipocyte accumulation
depending on the site of aneurysm remains unknown and further studies are needed. Hypoperfusion in “abdominal aortae” due to stenosis of VVs can be associated with the abnormal appearance of adipocytes, and the AAA progression and rupture.10, 19)
However, stenosis of VVs in “thoracic aortae” were not observed in this study (Fig. 20). The appearance of adipocytes in the TAA wall may be mediated by factors other than the stenosis of VVs.
This study reported that vascular adipocytes accumulation was observed in not only the AAA wall but also the TAA wall. The abnormal appearance of adipocytes may be associated with the TAA wall weakness. Whether the increase in adipocytes directly lead to the development or the rupture of TAA, and the pathological significance of adipocytes in the TAA wall remain unknown. Further studies are needed.
31
Chapter 4 - Suppressive effects of fish oil on development of abdominal
aortic aneurysm
4.1 Introduction
Hypoperfusion in the aortic wall due to the obstruction of VV could cause the vascular inflammation and AAA formation. However, the preventive methods for hypoperfusion-induced AAA remain unknown. AAA has been histologically characterized by chronic inflammation of the vascular wall. The inflammation in the aortic wall may be important target for suppressing AAA development. Here, this study focused on fish oil. Fish oil contains rich n-3 polyunsaturated fatty acid (n-3PUFA), such as eicosapentaenoic acid (EPA) and docosahexaenoic acid (DHA), which have anti-inflammatory and anti-oxidative effects. The anti-anti-inflammatory effect of n-3PUFA has multiple underlying mechanisms. For example, anti-inflammatory metabolites produced by EPA and DHA, such as resolvin and protectin.36) In addition, fish oil has an inhibitory
effect on the growth of adipocytes.37) The suppressive effects of n-3PUFAs on the AAA
development were previously reported in various AAA animal models.38-42) In clinical
research, low serum EPA levels were associated with the size and growth of AAA.43)
However, the effects of n-3PUFAs on hypoperfusion-induced AAA development remain unknown.
In this study, to evaluate the effects of fish oil on the development and rupture of AAA, EPA-rich fish oil was orally administrated to hypoperfusion-induced AAA model rats, and the suppressive effects of fish oil were studied.
4.2 Materials and Methods
Materials and methods in this chapter were previously described in Biosci.
Biotechnol. Biochem. and Sci. Rep. with slight modifications.19, 44)
4.2.1 Animals
All animal experiments were approved by the Kindai University Animal Care and Use Committee and performed according to the Kindai University Animal Experimentation Regulations (Approval number; KAAG-25-001). Six-week-old male Sprague-Dawley rats (SHIMIZU Laboratory Supplies Co., Ltd, Kyoto, Japan) were provided with food (Table 1) and water ad libitum, in a humidity-controlled room, with a 12-hour light and 12-hour dark cycle and at 25 ± 1 °C.
32
4.2.2 Fish oil administration from before the induction of hypoperfusion in vascular wall
After acclimatization for a week, rats were then orally administrated either triolein (1145 mg/kg body weight/day) (n=5) (control group), or fish oil (1145mg/kg body weight/day; purified TG extracted from sardines; Nippon Suisan Kaisha Ltd. Tokyo, Japan) (n=9) (fish oil group) respectively, for a week. Hypoperfusion was induced in abdominal aortic wall in all rats to induce AAA. After administration for 4 weeks, aortic diameters were then measured, and the rats sacrificed. The fatty acid composition of the fish oil is shown in Table 4.
Table 4 Fatty acid composition
4.2.3 Fish oil administration from after the induction of hypoperfusion in vascular wall
After acclimatization for a week, hypoperfusion was induced in abdominal aortic wall in all rats to induce AAA. Rats were then orally administrated either water (control group) (n=16), triolein (1145 mg/kg body weight/day) (n=24) (triolein group), or fish oil (1145mg/kg body weight/day) (n=19) (fish oil group) for 4 weeks. Aortic diameters were then measured, and the rats sacrificed. The fatty acid composition of the fish oil is shown in Table 4. When a rat died by AAA rupture, the aortic diameter was measured and the abdominal aorta immediately isolated.
33 4.2.4 Sample collection
The diameter of abdominal aorta was measured using digital calipers (A&D, Tokyo, Japan). Aneurysm was considered to be formed when the dilation ratio was greater than two. Isolated tissues were fixed in 4% PFA (Nacalai Tesque, Kyoto, Japan), soaked in sucrose (10%, 15% and 20%), and then embedded in O.C.T. Compound (Sakura Finetek Japan Co., Ltd.). These were stored at −80 °C until required.
4.2.5 Histological analysis
Abdominal aortae were cut with (CM1850; Leica Microsystems, Wetzlar, Germany) into 10-µm-thick sections, and mounted on glass slides. Tissue sections were subjected to histological stainings. The elastin degradation score was evaluated as shown in Figure 4. Quantitative analysis of histological staining was performed using ImageJ software (National Institutes of Health, Bethesda, Maryland, USA). Areas within 100 µm of an adipocyte were defined as ‘around adipocyte’.
4.2.6 Statistical analysis
Values were expressed as mean ± S.E.M. For between-group comparisons, the Chi-square test or Fisher’s exact test (for situations with small frequencies) was used for categorical variables. Student’s t test for continuous data with Tukey-Kramer test and Mann-Whitney test for scoring data were used. Kaplan–Meier method was used for analysis of survival analysis, and intergroup differences were evaluated by the log-rank test with Holm adjustment for multiple comparisons. A P-value < 0.05 was considered to indicate a statistically significant difference. Statistical analyses were performed using StatView 5.0 software (SAS Institute, Cary, USA) and R 3.2.0 with the EZR package.21)
4.3 Results
4.3.1 Suppressive effect of fish oil administration before the induction of hypoperfusion on the aortic dilation
The average final body weight (g) did not differ significantly between the groups (364.3 ± 17.5 g in the control group (administration of triolein), 368.4 ± 42.8 g in the fish oil group (administration of EPA-rich fish oil)). Serum TG levels (mg/dL) were significantly decreased in the fish oil group compared to the control group (57.8 ± 21.1 mg/dL in the control group, 29.5 ± 16.5 mg/dL in the fish oil group). Four weeks after the induction of hypoperfusion, aneurysm formation was observed in both groups (Fig. 20a). Aortic diameter in the AAA sac wall and the dilation ratio were significantly suppressed in the fish oil group compared to the control group (Fig. 20b, c).
34
Figure 21 Aortic diameter. (a) Representative images of the abdominal aorta in non‐treated, control, and fish oil groups. (scale bar = 1.5 mm) (b) Quantitative analysis of the aortic diameter. (c) Dilation rate (sac/neck). Data are represented as mean ± S.E.M. Control group (n = 5), fish oil group (n = 9). *P < 0.05 versus the control group. Reproduced from a figure previously published in Biosci. Biotechnol. Biochem.44)
Figure 22 Observation of collagen and elastic fibers. (a, b) PSR staining (scale bar = 200 µm). (c) Collagen positive area. (d, e) EVG staining (scale bar = 25 µm). (f) Elastin degradation score. Data are represented as mean ± S.E.M. *P < 0.05 versus the control group. Reproduced from a figure previously published in Biosci. Biotechnol. Biochem.44)
35
4.3.2 Suppressive effect of fish oil administration before the induction of hypoperfusion on the degradation of collagen fibers, MMPs expression, and oxidative stress in vascular wall
Collagen positive areas in the adventitial wall were significantly larger in the fish oil group than those in the control group (Fig. 22a-c). The elastin degradation score was not significantly different between groups (Fig. 22d-f). Because the degradation of collagen fibers was suppressed in the fish oil group, immunohistochemical examination for 2 (Fig. 23a-d) and 9 (Fig. 23f-i) was performed. Positive areas for MMP-2 and MMP-9 were significantly decreased in the fish oil group compared with those in the control group (Fig. 23e, j). Positive areas for MCP-1 did not differ significantly between the groups (Fig. 23k-o). Positive areas for malondialdehyde (MDA), the oxidative marker, were significantly decreased in the fish oil group compared with those in the control group (Fig. 23p-t).
Figure 23 Immunohistochemical staining for MMP-2, MMP-9, MCP-1, and MDA. (a–d) Immunostaining for MMP-2. (e) MMP-2 positive areas. (f–i) Immunostaining for MMP-9. (j) MMP-9 positive areas. (k–n) Immunostaining for MCP-1. (o) MCP-1 positive areas. (p–s) Immunostaining for MDA. (t) MDA positive areas. (a, c, f, h, k, m, p, r: scale bar = 200 µm; b, d, g, i, l, n, q, s: scale bar = 50 µm).The squared area in the left-side panels is magnified in the right-side panels as a representative image.Data are represented as mean ± S.E.M. *P < 0.05 versus the control group. Reproduced from a figure previously published in Biosci. Biotechnol. Biochem.44)
36
4.3.3 Suppressive effect of fish oil administration after the induction of hypoperfusion on the AAA rupture risk
Oral administration of fish oil before the induction of hypoperfusion showed suppressive effects on the aortic dilation (Fig. 21). These results showed the preventive effects when fish oil was taken before hypoperfusion of vascular wall. Since AAA is silent disease, it is not often noticed even if hypoperfusion of the vascular wall which triggers AAA occurs. Next, the effects of oral administration of fish oil after the induction of hypoperfusion on the development of AAA were evaluated.
The average final body weight (g) of the rats was not significantly different between the three groups (343.9 ± 44.0 g in the control group, 341.6 ± 29.0 g in the triolein group, and 373.7 ± 20.4 g in the fish oil group). Serum TG levels (mg/dL) in the fish oil group were significantly decreased compared with the triolein group (112.4 ± 52.0 mg/dL in the control group, 134.5 ± 44.2 mg/dL in the triolein group, 67.3 ± 23.7 mg/dL in the fish oil group). Serum total cholesterol levels (mg/dL) were not significantly different between the three groups (85.0 ± 27.7 mg/dL in the control group, 71.5 ± 12.5 mg/dL in the triolein group, 79.4 ± 16.0 mg/dL in the fish oil group).
Figure 24 Suppressive effects of fish oil administration on AAA rupture. (a) Kaplan-Meier curves for AAA rupture. (b) Representative images of abdominal aorta. (c) The aortic diameter. (d) Dilation ratio. Data are the mean ± S.E.M. Control group (n = 16), triolein group (n = 24), fish oil group (n = 19). Reproduced from a figure previously published in Sci. Rep.19)
37
The Kaplan–Meier curves for AAA rupture are shown in Figure 24a, and the rupture risk in the fish oil group significantly decreased compared to triolein group (P = 0.0348). The AAA rupture risk in the control group was not significantly different from either the triolein group (p = 0.0734) or the fish oil group (P = 0.821). Aneurysm formation was observed for all groups (Fig. 24b). The aortic diameter in the AAA sac wall and the dilation ratio were not significantly different between the groups (Fig. 24c, d). 4.3.4 Suppressive effect of fish oil administration after the induction of hypoperfusion on the accumulation of adipocytes in vascular wall
The ectopic adipocytes were observed in the AAA sac wall for all groups (Fig. 25a-f). The number (/section) and size (µm2/cell) of adipocytes were significantly
decreased in the fish oil group compared to the triolein group (Fig. 25g, h). The number and size of adipocytes in the fish oil group were not significantly different from those in the control group (Fig. 25g, h).
Figure 25 Quantification of adipocytes. (a-f) The vascular wall where adipocytes were observed (a, c, e: scale bar = 500 µm; b, d, f: scale bar = 100µm). The square area in the upper panels is magnified in the bottom panels as a representative image.(g) Quantification of the number of adipocytes, and (h) the size of adipocytes. Data are the mean ± S.E.M. Control group (n = 14), triolein group (n = 15), fish oil group (n = 14). Values with different letters are significantly different (P < 0.05). N.D. = not detected. Reproduced from a figure previously published in Sci. Rep.19)
38
Next, for histological analyses, the AAA sac wall were divided into two groups: area with adipocytes and area without adipocytes. The vascular wall thickness was not significantly different between the control, triolein and fish oil groups (Fig. 26).
Figure 26 Thickness of vascular wall. AAA sac areas from the three experimental groups were divided into two groups: those without adipocytes (-) (b, e and h) and those with adipocytes (+) (c, f and i). (a-i) Representative images of HE staining. (a, b, d, e, g, h: scale bar = 100 µm; c, f, i: scale bar = 400 µm). (j) Quantitative analysis of vascular wall thickness. Data are the mean ± S.E.M. Control group (n=9), triolein group (n = 10), fish oil group (n = 8). Values with different letters are significantly different (P < 0.05). Reproduced from a figure previously published in Sci. Rep.19)
39
The elastin degradation score was also not significantly different between the three groups (Fig. 27a-j). Collagen positive areas in the triolein group were significantly decreased in the AAA sac walls with adipocytes compared to those without adipocytes (Fig. 27k-t). On the contrary, collagen positive areas in the fish oil group were not significantly different in the AAA sac walls with adipocytes compared to those without adipocytes (Fig. 27k-t).
Figure 27 Elastin degradation score and collagen positive area. AAA sac areas from the three experimental groups were divided into two groups: those without adipocytes (-) (b, e, h, l, o and r) and those with adipocytes (+) (c, f, j, i, m, p and s). (a-i) Representative images of EVG staining (a, b, d, e, g, h: scale bar = 100 µm; c, f, i: scale bar = 200µm). (j) Elastin degradation scores. (k-s) Representative images of PSR staining (k, n, q: Scale bar = 100 µm, l, o, r: scale bar = 400 µm, m, p, s: scale bar = 50 µm). (t) Collagen-positive areas. Data are the mean ± S.E.M. Control group (n=9), triolein group (n = 10), fish oil group (n = 8). Values with different letters are significantly different (P < 0.05). Reproduced from a figure previously published in Sci. Rep.19)
40
The α-smooth muscle actin positive areas and the medial wall thickness in the AAA neck and sac walls were not significantly different between the three groups (Fig. 28). Areas positive for MMP-2 and MMP-9 in the AAA sac wall without adipocytes were significantly decreased in the fish oil group compared to the triolein group (Fig. 29). Areas positive for MMP-2 and MMP-9 in the AAA sac wall with adipocytes were significantly decreased in the fish oil group compared to the triolein group (Fig. 29). Areas positive for MMP-2 and MMP-9 in the AAA sac wall with adipocytes were not significantly different between the control and fish oil groups (Fig. 29). Areas positive for MCP-1 in the AAA sac wall with adipocytes were significantly decreased in the fish oil group compared to the triolein group (Fig. 30a-j). Areas positive for Mac387+
monocytes/macrophages in the AAA sac wall with adipocytes were also significantly decreased in the fish oil group compared to the triolein group (Fig. 30k-t). Areas positive for MCP-1 and MAC387+ monocytes/macrophages in the AAA sac wall with adipocytes
were not significantly different between the control and fish oil groups (Fig. 30j, t).
Figure 28 Thickness of medial wall. (a-f) Representative images of immunostaining for α-smooth muscle actin (scale bar = 100 µm). (g) Quantification of α-α-smooth muscle actin-positive areas, and (h) the medial wall thickness. Data are the mean ± S.E.M. Values with different letters are significantly different (P < 0.05). Reproduced from a figure previously published in Sci. Rep.19)
41
Figure 29 Immunohistochemical staining for MMP-2 and MMP-9. AAA sac areas from the three experimental groups were divided into two groups: those without adipocytes (-) (b, e, h, l, o and r) and those with adipocytes (+) (c, f, i, m, p and s). (a-i) Immunostaining for MMP-2 (scale bar = 50 µm). (j) MMP-2 positive areas. (k-s) Immunostaining for MMP9 (scale bar = 50 µm). (t) MMP-9 positive areas. Data are the mean ± S.E.M. Control group (n=9), triolein group (n = 10), fish oil group (n = 8). Values with different letters are significantly different (P < 0.05). Reproduced from a figure previously published in Sci. Rep.19)