R E S E A R C H A R T I C L E
Open Access
Effects of audio and visual distraction on
patients
’ vital signs and tolerance during
esophagogastroduodenoscopy: a
randomized controlled trial
Masahiro Sogabe
1,2*, Toshiya Okahisa
1,2, Akira Fukuya
1, Kaizo Kagemoto
1, Yasuyuki Okada
1, Yuka Adachi
2,
Takeshi Kurihara
2, Toru Nii
2, Satoshi Teramae
1, Hironori Tanaka
1, Tetsu Tomonari
1, Koichi Okamoto
1,
Hiroshi Miyamoto
1, Masahiko Nakasono
3and Tetsuji Takayama
1Abstract
Background: Esophagogastroduodenoscopy (EGD) provides an indispensable and unambiguous inspection allowing the discovery upper gastrointestinal lesions. However, many patients are anxious about undergoing EGD. Few studies have investigated the influence on patients’ vital signs and tolerance during EGD using subjective and objective assessments. This study was a prospective randomized controlled study that investigated the influence of audio and visual distraction on EGD. Methods: We randomly divided 289 subjects who underwent EGD into 4 groups (control group, audio group, visual group, combination group) and examined their vital signs, heart rate variability (HRV), psychological items, and acceptance of distraction.
Results: Pulse rate (PR) at post-distraction and post-EGD in the 3 distraction groups were significantly lower than those of control group (p < 0.001 and p < 0.01, respectively). Blood pressure (BP) during and post-EGD was significantly higher than that at pre-EGD in control group (p < 0.05), but no significant elevation of BP was observed during the latter half of EGD and post-EGD in the 3 distraction groups. BP at post-distraction improved significantly compared to pre-distraction in the 3 distraction groups (p < 0.05). There was a significant difference in the low-frequency (LF) power/ high-frequency (HF) power at post-distraction and post-EGD among the 4 groups (p < 0.001 and p < 0.001, respectively). The LF power/HF power at post-distraction and post-EGD in the 3 distraction groups was significantly lower than that in control group (p < 0.05). Several items of profile of mood states (POMS) and the impression of EGD at post-distraction improved significantly compared to those at pre-distraction among the 3 distraction groups (p < 0.05). Visual analog scale (VAS) of willingness for the next use of distraction in the 3 distraction groups was excellent because VAS was more than 70.
(Continued on next page)
© The Author(s). 2020 Open Access This article is licensed under a Creative Commons Attribution 4.0 International License, which permits use, sharing, adaptation, distribution and reproduction in any medium or format, as long as you give appropriate credit to the original author(s) and the source, provide a link to the Creative Commons licence, and indicate if changes were made. The images or other third party material in this article are included in the article's Creative Commons licence, unless indicated otherwise in a credit line to the material. If material is not included in the article's Creative Commons licence and your intended use is not permitted by statutory regulation or exceeds the permitted use, you will need to obtain permission directly from the copyright holder. To view a copy of this licence, visithttp://creativecommons.org/licenses/by/4.0/. The Creative Commons Public Domain Dedication waiver (http://creativecommons.org/publicdomain/zero/1.0/) applies to the data made available in this article, unless otherwise stated in a credit line to the data.
* Correspondence:[email protected]
1Department of Gastroenterology and Oncology, Tokushima University
Graduate School of Biomedical Sciences, 3-18-15 Kuramoto-cho, Tokushima city, Tokushima 770-8503, Japan
2Department of Internal Medicine, Shikoku Central Hospital of the Mutual aid
Association of Public School teachers, Shikokuchuo, Japan Full list of author information is available at the end of the article
(Continued from previous page)
Conclusions: Distractions effectively improved psychological factors, vital signs and some of HRV at pre and post-EGD. Distractions may suppress BP elevation during the latter half of EGD and lead to stability of HRV on EGD.
Trial registration: This prospective trial was registered in the University Hospital Medical Information Network (UMIN) Clinical Trials Registry asUMIN000029637. Registered on 20 October 2017.
Keywords: Esophagogastroduodenoscopy, Vital signs, Heart rate variability, Distraction, Subjective and objective assessment
Background
Medical opportunities for the use of esophagogastroduo-denoscopy (EGD) for the diagnosis of and therapy for etiology of gastrointestinal complaints and upper gastro-intestinal cancer have increased. The development of smaller endoscope diameters reduced the unpleasant feeling and pain during EGD, but some person avoid undergoing EGD because of strong anxiety prior to the procedure [1–3]. Sedation increases the success rate of endoscopy and patient satisfaction during the endo-scopic procedure [4–8], but sedation may increase the likelihood of complications, such as hypotension and respiratory depression [9–13]. Therefore, methods to improve patient anxiety during endoscopic examina-tions without sedation were examined. Several noninva-sive intervention techniques, such as distraction using audio, visual, and olfactory stimulation, were intro-duced to decrease pain and anxiety during endoscopic examinations. Listening to music or watching images during various endoscopic procedures was an effective distraction in several reports, but most these reports used subjective assessments, such as pain, anxiety, and satisfaction [1, 14–16]. Few reports investigated the ef-ficacy of the distraction of listening to music or watch-ing images durwatch-ing EGD uswatch-ing a combination of subjective and objective assessments, including cardio-vascular responses, heart rate variability (HRV), and a psychological questionnaire. We performed a prospect-ive single-blind randomized controlled trial to assess the influence of distractions, such as audio and visual stimuli, during EGD.
Methods
Study design
This study protocol is included in additional Figure 1. This study was designed as a prospective, single-blinded randomized controlled trial, and it was performed at Shikoku Central Hospital of the Mutual Aid Association of Public School teachers. The Ethics Committee in Shi-koku Central Hospital of the Mutual Aid Association of Public School teachers approved the study protocol, which was registered in the University Hospital Medical Information Network (UMIN Clinical Trials Registry, number UMIN000029637).
Diagram of procedures and subject selection
Figure 1 shows a flow diagram of the enrollment and procedures of this study. A total of 360 subjects were scheduled to receive EGD at a regular health check-up at our hospital participated in this study between Octo-ber 2017 and March 2018. The study design was ex-plained, and all subjects provided written informed consent. Seventy-one subjects were excluded from the study if they met any of the following criteria: (1) current medication use; (2) a history of severe heart fail-ure, renal failfail-ure, hepatic failfail-ure, or chronic obstructive pulmonary disease; (3) previous abdominal surgery, in-cluding endoscopic mucosal resection (EMR) and endo-scopic submucosal dissection (ESD); (4) audio or visual disability; (5) previous experience of bad feelings from audio or visual stimuli; (6) a history of anxiety or psychi-atric disorders; (7) pregnant or a possibility of preg-nancy; and (8) receiving a diagnosis of gastrointestinal cancer or required biopsy. Subjects presented to the en-doscopy floor in the morning after a longer than 12-h fasting period. Subjects who was divided into two cat-egories those underwent EGD for the first time and those experienced EGD previously and each subject was randomly divided into 4 groups using a sealed opaque numbered envelope method by the endoscopy nurse who assisted at EGD. All subjects sat on a sofa and rested quietly for 5 min in a private room near the en-doscopy room. Subjects in control group continued to sit on the sofa and rest quietly for 10 min prior to EGD. Subjects in audio group sat on the sofa and listened to music for 10 min. Subjects in visual group sat on the sofa and watched a silent natural image for 10 min. Sub-jects in combination group sat on the sofa and watched a natural image while listening to music for 10 min. The study used healing music, such as country and classical music, based on the tone of a music box, which was chosen as good by 20 volunteers in a pre-meeting prior to the start of this study. The moving images used in this study were various natural images, including a mountain, forest, river, waterfall, lake, and sunset. Music and natural images were delivered using a wall-type Hi-vision liquid crystal teleHi-vision (TH-42AS650; Panasonic Corporation, Osaka, Japan). Pharyngeal anesthesia with lidocaine pump spray (Xylocaine Pump Spray 8%; Astra-Zeneca, Osaka, Japan) without any sedative agents was
applied, and 5 endoscopy specialists with greater than 5 years of experience in endoscopy performed a standard EGD, including observations of the esophagus, stomach, and duodenum, using a conventional single channel endoscope (GIF-H260; Olympus, Tokyo, Japan) without knowledge of the group of the subject. The profile of mood states (POMS) and the visual analog scale (VAS) of impressions for EGD were performed at pre- and post-distraction. VAS of the acceptance of distraction was performed after EGD.
Measurement of vital signs
Pulse rate (PR) and blood pressure (BP) were measured in the right upper arm, and peripheral blood oxygen satur-ation (SpO2) was measured at the left finger using a
moni-tor unit (BSM-7100 Life Scope; NIHON KOHDEN CORPORATION, Tokyo, Japan). These parameters were measured 5 and 15 min after sitting on the sofa, during EGD, and 5 min after EGD procedure. Parameters during EGD were measured just after insertion of the endoscope through the esophagogastric junction (approximately 2 min from the start of EGD) and just after moving the endoscope from the stomach to the esophagogastric junc-tion (approximately 5–7 min from the start of EGD). Assessment of HRV
We assessed autonomic nervous function from pre-EGD to post-EGD using power spectral analysis (PSA). HRV was measured using a Heart Rhythm Scanner (HRV ana-lysis system from Biocom Technologies, Ark Trading
Pacific, Inc.) equipped with software that performed al-gorithms for short-term HRV analysis. A Biocom HRS-08 Bluetooth Wireless Pulse Wave Sensor photoplethys-mography monitor was used in this study, and it was clipped to the right earlobe. Data of the average R-R in-tervals for 5 min were subjected to PSA using the soft-ware of the HRV analysis system. The amplitudes of the low-frequency (LF) range (LF, 0.04–0.15 Hz) and high-frequency (HF) range (HF, 0.15–0.40 Hz) were analyzed using complex demodulation. These LF and HF values were designated as the LF power and HF power, respect-ively. HF power is fluctuation in the heart rate caused by respiration, which is mediated by cardiac parasympa-thetic nervous activity [17,18]. The ratio of LF power to HF power is an index of sympathetic nervous activity [19–22]. The HF power data were converted to a loga-rithmic scale to analyze using linear regression in the present study.
Psychological assessment and acceptance of distraction We used the POMS2 questionnaire for psychological as-sessments between pre- and post-distraction because POMS is a self-report measure that quickly assesses transient, fluctuating feelings and enduring affective states [23,24]. The POMS2 is composed of 35 items and 8 subscale scores. We also used the VAS, which consists of a 100-mm horizontal line scored from 0 to 100 to rate the degrees of strain, anxiety, and fear of EGD. All sub-jects answered the POMS and provided their impres-sions of EGD immediately after sitting on the sofa and
15 min after sitting on the sofa, but prior to EGD. After EGD, subject used the VAS to rate their degrees of satis-faction, usefulness, and willingness to assess the subject’s acceptance of distraction.
Outcomes
The primary outcome measures were psychological fac-tors including POMS and impression for EGD at post-distraction and acceptance of post-distraction including de-grees of satisfaction, usefulness, and willingness for the next use at post EGD. The secondary outcome measures were vital signs, HRV at post-distraction, during EGD, and at post-EGD. Vital signs and HRV were measured at pre-EGD (5 min after sitting on the sofa), pre-EGD (15 min after sitting on the sofa), dur-ing the early and the latter half of EGD, and 5 min after the end of EGD.
Statistical analysis
We assumed that the appropriate sample size for the randomized subjects was over 180 subjects based on the requirement of a significant difference between 4 groups with a significance level of 0.05, power of 80%, and, ef-fect size of 0.25. Additionally, the rate of subjects who fill exclusion criteria or who received a diagnosis of gastrointestinal cancer or a biopsy was 30–40% by refer-ring to our previous prospective randomized trial on en-doscopy. Therefore, the planned required number of subject who receive EGD was over 300. Quantitative data, including subject characteristics, vital signs, POMS score, and VAS scores of impressions for EGD and ac-ceptance of distraction, are expressed as the means ± standard deviation (SD). Parameters of autonomic nervous function are expressed as the means ± stand-ard error of the mean (SEM). All significant differ-ences at a P value less than 0.05 were considered Table 1 Baseline characteristics of subjects in the four groups
Total subjects (n = 289) Control group (n = 73) Audio group (n = 73) Visual group (n = 72) Combination group (n = 71) P-value Age (years) 52.1 ± 6.7 52.8 ± 6.7 52.5 ± 6.6 50.7 ± 7.3 52.3 ± 6.2 NS Gender Male 171 46 45 40 40 NS Female 118 27 28 32 31 Smoking (+/−) 35/254 10/63 9/64 12/60 4/67 NS Drinking (+/−) 165/124 45/28 42/31 40/32 38/33 NS Number of EGD experience 4.3 ± 3.4 (0–20) 4.4 ± 3.9 (0–20) 4.5 ± 3.8 (0–16) 4.1 ± 2.6 (0–11) 4.4 ± 3.3 (0–15) NS
Duration of EGD (sec) 341 ± 98 330 ± 96 351 ± 96 355 ± 116 329 ± 81 NS
First score of POMS (negative mood) A-H 46.5 ± 7.5 46.8 ± 8.0 46.2 ± 6.9 46.6 ± 6.5 46.3 ± 8.3 NS C-B 48.9 ± 8.0 48.4 ± 8.5 49.4 ± 8.1 49.6 ± 7.2 48.3 ± 8.2 NS D-D 48.9 ± 7.2 49.0 ± 7.5 49.8 ± 8.2 48.5 ± 6.7 48.5 ± 6.3 NS F-I 45.7 ± 8.2 46.0 ± 9.6 46.2 ± 7.1 45.3 ± 7.1 45.5 ± 9.0 NS T-A 52.3 ± 9.8 53.0 ± 10.9 50.9 ± 8.6 54.1 ± 9.0 51.4 ± 10.5 NS TMD 47.3 ± 7.8 48.0 ± 9.0 47.5 ± 7.6 47.6 ± 6.7 46.2 ± 7.6 NS (positive mood) V-V 54.6 ± 9.5 54.4 ± 10.6 55.0 ± 8.8 55.3 ± 9.1 53.5 ± 9.3 NS F 58.6 ± 8.9 56.8 ± 9.7 58.6 ± 8.0 59.2 ± 8.7 59.8 ± 9.2 NS VAS of impression for EGD Strain 48.7 ± 27.9 46.6 ± 26.7 47.1 ± 26.9 53.7 ± 27.9 47.3 ± 30.2 NS Anxiety 40.3 ± 27.7 38.5 ± 28.1 44.5 ± 26.8 39.5 ± 25.8 38.8 ± 30.0 NS Fear 32.5 ± 26.7 29.6 ± 25.3 36.3 ± 28.5 32.3 ± 23.2 31.8 ± 29.6 NS
A-H Anger-hostility; C-B Confusion-bewilderment; D-D Depression-dejection; EGD Esophagogastroduodenoscopy; F friendship; F-I Fatigue-languid; POMS Profile of mood states; T-A Tension-anxiety; TMD Total mood distress; VAS Visual analog scale; V-V Vigor-vitality
Data represent the means ± standard deviation (SD) and number for categorical variables. The P-value is based on the m × nχ2
test or Kruskal Wallis test. Significance is at the 5% level
significant. The χ2-test or Mann-Whitney U-test was used for comparisons between 2 groups or pre- and post-distraction in same group. The m × n χ2-test or Kruskal Wallis test was used to analyze differences among 3 or 4 groups. If the Kruskal Wallis test
revealed differences between the groups, then post-hoc pairwise comparisons were performed using the Mann-Whitney U test with Bonferroni correction. All analyses were performed using Med Calc Software (Broekstraat, Mariakerke, Belgium).
Fig. 2 Changes in pulse rate from pre-distraction to post-EGD in the 4 groups. EGD, esophagogastroduodenoscopy; *p < 0.05; **p < 0.005; ***p < 0.001
Fig. 3 Changes in blood pressure from pre-distraction to post-EGD in the 4 groups. EGD, esophagogastroduodenoscopy; *p < 0.05; **p < 0.01; ***p < 0.005; ****p < 0.001
Fig. 4 Changes in blood oxygen saturation from pre-distraction to post-EGD in the 4 groups. EGD, esophagogastroduodenoscopy; *p < 0.01; **p < 0.005
Table 2 Comparison of pulse rate at four points among the four groups
Control group Audio group Visual group Combination
group
P-value Pre-EGD
(5 min after sitting on the sofa) (/min)
Mean 66.8 65.5 64.1 65.4 NS
SD 8.7 9.7 8.0 9.3
Max 49 45 44 42
Min 93 92 87 87
Pre-EGD
(15 min after sitting on the sofa) (/min)
Mean 66.7a 62.8b 60.3bc 59.1c < 0.001
SD 9.7 9.8 8.3 7.8
Max 95 94 85 80
Min 47 43 42 40
Early half of EGD (/min)
Mean 87.5 84.8 82.2 83.2 NS
SD 17.9 16.4 16.7 15.8
Max 136 120 135 120
Min 56 51 46 55
Latter half of EGD (/min)
Mean 76.2 73.8 72.5 70.9 NS
SD 15.3 13.1 14.8 12.8
Max 126 105 126 107
Min 46 42 42 41
5 min after the end of EGD (/min)
Mean 70.6a 69.0b 65.9bc 65.4c < 0.01
SD 10.8 10.8 9.4 8.3
Max 103 95 90 85
Min 50 45 44 40
EGD Esophagogastroduodenoscopy; SD Standard deviation
The P-value is based on the Kruskal Wallis test. Significance is at the 5% level. Post hoc pairwise comparisons were performed using the Mann-Whitney U test with Bonferroni correction. Different letters indicate a significant difference at the 0.00833 (0.05/6) level
Results
Baseline characteristics of subjects
Table 1 shows the baseline characteristics in the 4 groups. There was no significant difference in age, gen-der, smoking, drinking, experience or duration of EGD, POMS, and the impression for EGD among the 4 groups.
Change in vital signs
Figure2shows the changes in PR from pre-EGD to post-EGD in the 4 groups. PRs during the early and the latter half of EGD, and 5 min after the end of EGD were signifi-cantly higher than pre-EGD (5 min after sitting on the sofa) in control group and audio group (p < 0.001, p < 0.001, and p < 0.05). PRs during the early and the lat-ter half of EGD were significantly higher than pre-EGD (5 min after sitting on the sofa) in visual group (p < 0.001 and p < 0.005) and combination group (p < 0.001 and p < 0.05), but there was no significant difference in PR be-tween pre-EGD (5 min after sitting on the sofa) and 5 min after the end of EGD, and PR at pre-EGD (15 min after sitting on the sofa) was significantly lower than pre-EGD (5 min after sitting on the sofa) in visual group (p < 0.005) and combination group (p < 0.001).
Figure3shows the changes in BP from pre-EGD to post-EGD in the 4 groups. BPs during the early and the latter half of EGD, and 5 min after the end of EGD were significantly higher than pre-EGD (5 min after sitting on the sofa) in control group (p < 0.001, p < 0.05, and p < 0.05). BP during the early half of EGD was significantly higher than pre-EGD (5 min after sitting on the sofa) in the 3 distraction groups (p < 0.001), but no significant BP elevation was ob-served during the latter half of EGD and 5 min after the end of EGD. BP at pre-EGD (15 min after sitting on the sofa) was significantly lower than pre-EGD (5 min after sitting on the sofa) in the 3 distraction groups (p < 0.05).
Fig.4 shows the changes in SpO2 from pre-EGD to
post-EGD in the 4 groups. SpO2during the latter half
of EGD was significantly higher than pre-EGD (5 min after sitting on the sofa) in control group, audio group, and visual group (p < 0.01, p < 0.005, and p < 0.005).
Comparison of PR at each point
Table 2shows a comparison of PR at each point among the 4 groups. There was no significant difference in PR Table 3 Comparison of blood pressure at four points among the four groups
Control group Audio group Visual group Combination group P-value Pre-EGD
(5 min after sitting on the sofa) (mmHg)
Mean 122.8 122.4 120.6 128.3 NS
SD 14.6 15.9 14.4 16.7
Max 157 161 157 178
Min 96 90 91 97
Pre-EGD
(15 min after sitting on the sofa) (mmHg)
Mean 121.7b 117.3 114.0a 120.3b < 0.005
SD 13.5 14.6 12.2 15.6
Max 158 156 158 171
Min 98 90 89 90
Early half of EGD (mmHg)
Mean 138.8 139.3 136.9 140.5 NS
SD 21.5 28.8 26.7 23.7
Max 188 214 224 200
Min 91 88 87 79
Latter half of EGD (mmHg)
Mean 130.3 126.7 124.8 128.6 NS
SD 18.5 23.4 22.1 18.3
Max 180 195 194 171
Min 93 88 90 78
5 min after the end of EGD (mmHg)
Mean 128.9a 124.2 122.3b 126.0 < 0.05
SD 15.7 15.2 15.7 14.6
Max 193 164 182 166
Min 97 92 96 100
EGD Esophagogastroduodenoscopy; SD Standard deviation
The P-value is based on the Kruskal Wallis test. Significance is at the 5% level. Post hoc pairwise comparisons were performed using the Mann-Whitney U test with Bonferroni correction. Different letters indicate a significant difference at the 0.00833 (0.05/6) level
at pre-EGD (5 min after sitting on the sofa), during the early half of EGD, and the latter half of EGD among the 4 groups. However, there was a significant difference in PR at pre-EGD (15 min after sitting on the sofa) and 5 min after the end of EGD among the 4 groups on the Kruskal Wallis test (p < 0.001 and p < 0.01). Post-hoc pairwise comparisons revealed that PRs at pre-EGD (15 min after sitting on the sofa) and 5 min after the end of EGD in the 3 distraction groups were significantly lower than control group.
Comparison of BP at each point
Table 3shows a comparison of BP at each point among the 4 groups. There was no significant difference in BP at pre-EGD (5 min after sitting on the sofa), during the early half of EGD, and the latter half of EGD among the 4 groups. However, there was a significant difference in BP at pre-EGD (15 min after sitting on the sofa) and 5 min after the end of EGD among the 4 groups on the Kruskal Wallis test (p < 0.005 and p < 0.05). Post-hoc pairwise comparisons revealed that BP at pre-EGD (15 min after sitting on the sofa) and 5 min after the end of EGD in vis-ual group was significantly lower than control group.
Comparison of SpO2at each point
Table 4 shows a comparison of SpO2 at each point
among the 4 groups. There was no significant difference in SpO2 at pre-EGD (5 min after sitting on the sofa),
pre-EGD (15 min after sitting on the sofa), during the early half of EGD, and the latter half of EGD among the 4 groups. However, there was a significant difference in SpO2at 5 min after the end of EGD among the 4 groups
on the Kruskal Wallis test (p < 0.01). Post-hoc pairwise comparisons revealed that SpO2 at 5 min after the end
of EGD in combination group were significantly higher than control group.
Changes in HRV
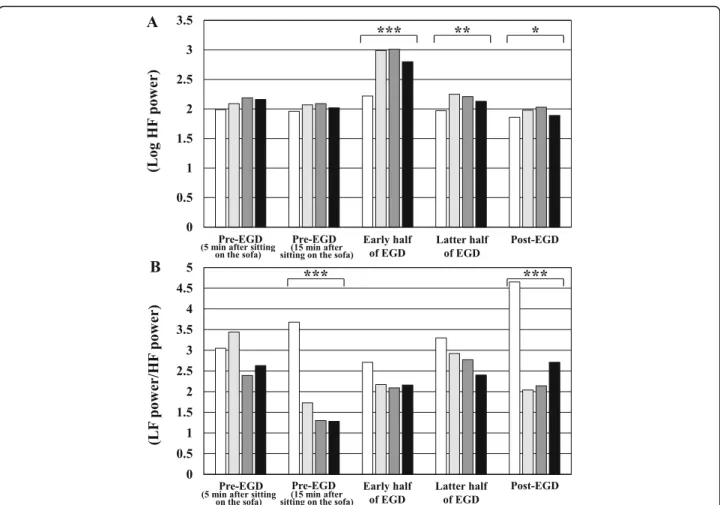
Figure 5-A shows a comparison of Log HF power from pre-EGD to post-EGD among the 4 groups. There was a significant difference in Log HF power during the early and the latter half of EGD, and 5 min after the end of EGD among the 4 groups on the Kruskal Wallis test (p < 0.001, p < 0.01, and p < 0.05). Post-hoc pairwise comparisons revealed that Log HF powers during the early half of EGD in the 3 distraction groups was significantly higher than control group.
Table 4 Comparison of blood oxygen saturation at four points among the four groups
Control group Audio group Visual group Combination group P-value Pre-EGD
(5 min after sitting on the sofa) (%)
Mean 98.2 98.1 98.3 98.5 NS
SD 1.4 0.9 1.2 1.1
Max 100 100 100 100
Min 93 95 94 96
Pre-EGD
(15 min after sitting on the sofa) (%)
Mean 98.5 98.3 98.2 98.5 NS
SD 1.1 1.0 1.3 0.9
Max 100 100 100 100
Min 95 96 94 96
Early half of EGD (%) Mean 98.2 98.3 98.4 98.6 NS
SD 1.6 1.0 1.3 1.2
Max 100 100 100 100
Min 91 95 93 95
Latter half of EGD (%) Mean 98.7 98.6 98.8 98.8 NS
SD 1.5 1.1 1.2 1.2
Max 100 100 100 100
Min 92 96 95 95
5 min after the end of EGD (%) Mean 97.9b 98.1b 98.2 98.6a < 0.01
SD 1.5 1.0 1.2 1.0
Max 100 100 100 100
Min 94 96 95 95
EGD Esophagogastroduodenoscopy; SD Standard deviation
The P-value is based on the Kruskal Wallis test. Significance is at the 5% level. Post hoc pairwise comparisons were performed using the Mann-Whitney U test with Bonferroni correction. Different letters indicate a significant difference at the 0.00833 (0.05/6) level
Figure 5-B shows a comparison of LF power/ HF power from pre-EGD to post-EGD between the 4 groups. There was a significant difference in LF power/ HF power at pre-EGD (15 min after sitting on the sofa) and 5 min after the end of EGD among the 4 groups on the Kruskal Wallis test (p < 0.001 and p < 0.001). Post-hoc pairwise comparisons revealed that LF power/ HF power at pre-EGD (15 min after sitting on the sofa) and 5 min after the end of EGD in the 3 distraction groups was significantly lower than control group.
Influence of distraction on POMS and the impression for EGD
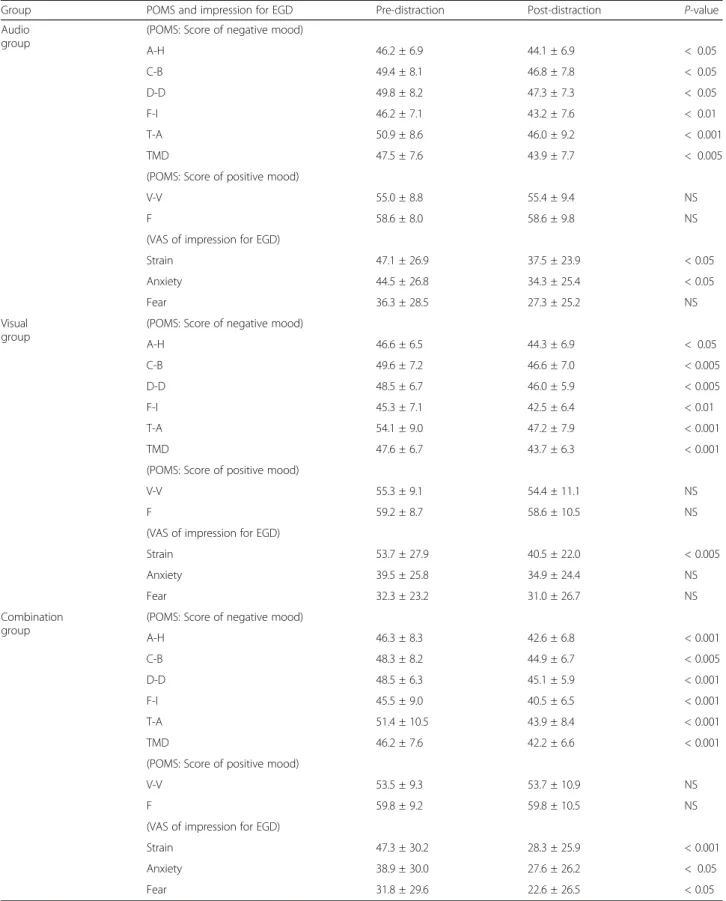
Table 5 shows a comparison of POMS and the impres-sion for EGD between pre- and post-distraction in the 3 distraction groups. The score for negative mood at post-distraction was significantly lower than at pre-post-distraction in the 3 distraction groups (p < 0.05). The VAS scores of strain, anxiety, and fear for EGD at post-distraction were significantly lower than pre-distraction in audio group (p < 0.05, p < 0.05, and NS), visual group
(p < 0.005, NS, and NS), and combination group (p < 0.001, p < 0.05, and p < 0.05).
Acceptance of distraction after EGD
Table 6 shows a comparison of the acceptance of the distraction after EGD among the 3 distraction groups.
There was a significant difference in usefulness of the distraction and satisfaction of the distraction among the 3 groups on the Kruskal Wallis test (p < 0.005). Post-hoc pairwise comparisons revealed that the usefulness of the distraction and the satisfaction of the distraction in combination group was significantly higher than visual group. Although there was no significant difference in willingness for the next use of the distraction among the 3 groups, the degree of willingness for the next use of the distraction was excellent because the VAS was more than 70 in the 3 groups.
Discussion
Several studies examined the benefits of audio and video distraction during various endoscopy procedures
Fig. 5 Changes in heart rate variability from pre-EGD to post-EGD in the 4 groups. a Comparisons of Log HF powers from pre-EGD to post-EGD in the 4 groups. b Comparisons of LF power/ HF power from pre-EGD to post-EGD in the 4 groups. The white bar indicates the values of control group. The light gray bar indicates values of audio group. The dark gray bar indicates values of visual group. The black bar indicates values of combination group. EGD, esophagogastroduodenoscopy; HF, high frequency; LF, low frequency; *P < 0.05; **P < 0.01; ***P < 0.001
Table 5 Comparison of POMS and the impression for EGD between pre- and post-distraction in the three distraction groups
Group POMS and impression for EGD Pre-distraction Post-distraction P-value
Audio group
(POMS: Score of negative mood)
A-H 46.2 ± 6.9 44.1 ± 6.9 < 0.05 C-B 49.4 ± 8.1 46.8 ± 7.8 < 0.05 D-D 49.8 ± 8.2 47.3 ± 7.3 < 0.05 F-I 46.2 ± 7.1 43.2 ± 7.6 < 0.01 T-A 50.9 ± 8.6 46.0 ± 9.2 < 0.001 TMD 47.5 ± 7.6 43.9 ± 7.7 < 0.005
(POMS: Score of positive mood)
V-V 55.0 ± 8.8 55.4 ± 9.4 NS
F 58.6 ± 8.0 58.6 ± 9.8 NS
(VAS of impression for EGD)
Strain 47.1 ± 26.9 37.5 ± 23.9 < 0.05
Anxiety 44.5 ± 26.8 34.3 ± 25.4 < 0.05
Fear 36.3 ± 28.5 27.3 ± 25.2 NS
Visual group
(POMS: Score of negative mood)
A-H 46.6 ± 6.5 44.3 ± 6.9 < 0.05 C-B 49.6 ± 7.2 46.6 ± 7.0 < 0.005 D-D 48.5 ± 6.7 46.0 ± 5.9 < 0.005 F-I 45.3 ± 7.1 42.5 ± 6.4 < 0.01 T-A 54.1 ± 9.0 47.2 ± 7.9 < 0.001 TMD 47.6 ± 6.7 43.7 ± 6.3 < 0.001
(POMS: Score of positive mood)
V-V 55.3 ± 9.1 54.4 ± 11.1 NS
F 59.2 ± 8.7 58.6 ± 10.5 NS
(VAS of impression for EGD)
Strain 53.7 ± 27.9 40.5 ± 22.0 < 0.005
Anxiety 39.5 ± 25.8 34.9 ± 24.4 NS
Fear 32.3 ± 23.2 31.0 ± 26.7 NS
Combination group
(POMS: Score of negative mood)
A-H 46.3 ± 8.3 42.6 ± 6.8 < 0.001 C-B 48.3 ± 8.2 44.9 ± 6.7 < 0.005 D-D 48.5 ± 6.3 45.1 ± 5.9 < 0.001 F-I 45.5 ± 9.0 40.5 ± 6.5 < 0.001 T-A 51.4 ± 10.5 43.9 ± 8.4 < 0.001 TMD 46.2 ± 7.6 42.2 ± 6.6 < 0.001
(POMS: Score of positive mood)
V-V 53.5 ± 9.3 53.7 ± 10.9 NS
F 59.8 ± 9.2 59.8 ± 10.5 NS
(VAS of impression for EGD)
Strain 47.3 ± 30.2 28.3 ± 25.9 < 0.001
Anxiety 38.9 ± 30.0 27.6 ± 26.2 < 0.05
Fear 31.8 ± 29.6 22.6 ± 26.5 < 0.05
A-H Anger-hostility; C-B Confusion-bewilderment; D-D Depression-dejection; EGD Esophagogastroduodenoscopy; F Friendship; F-I Fatigue-languid; POMS Profile of mood states; T-A Tension-anxiety; TMD Total mood distress; VAS Visual analog scale; V-V Vigor-vitality
[1, 14–16, 25–31]. However, no clear recommenda-tions for distraction were established because assess-ments in previous reports were based solely on subjective items, such as tolerance, pain, anxiety and satisfaction. To our knowledge, this is the first study evaluating the influence of distractions on EGD using subjective and objective measures.
The incidence of gastric cancer decreased worldwide in recent decades, but it remains a major cause of cancer-related mortality [32]. Therefore, EGD is an indispensable instrument to discover upper gastrointestinal cancer and perform endoscopic treatments, such as EMR and ESD. Appropriate methods for amount and use of sedation, improved techniques and apparatus for endoscopy were established. However, serious complications related to endoscopic procedures and sedation remain and are a problematic. The exact mechanisms of these complications remain conjectural, but the importance of vital sign changes and causes related to the autonomic nerve system were demonstrated. There were several reports of an associ-ation with endoscopy procedure and the autonomic nervous system, but few reports associated EGD and distractions using objective assessments, such as vital signs and autonomic nervous function [33, 34].
The present study demonstrated that BP at post-distraction (i.e., immediately pre-EGD) in the post-distraction groups improved significantly, but no improvement in BP was observed in the no distraction group. BP during and post-EGD increased significantly in the no distrac-tion group, but no significant BP elevadistrac-tion was observed during the latter half of EGD and post-EGD in the dis-traction groups. There was also no significant elevation in PR at post-EGD in visual group, and combination group. These results suggest that distraction suppresses vital sign elevation at pre-EGD, during a portion of EGD, and at post-EGD.
There was a significant difference in Log HF power during the early half of EGD between the control group and distraction groups. The vomiting reflex affects the early half of EGD because of endoscope insertion. Add-itionally, gastrointestinal distention by air supply from
the top of endoscopy may induce activation of a vagal reflex [35, 36]. Promotion of parasympathetic nervous activity may be induced by not only the influence of traction but also vomiting reflex and gastrointestinal dis-tention because of stimulation of endoscope insertion.
The LF power/HF power ratios at post-distraction (i.e., immediately pre-EGD) and post-EGD in the distraction groups were significantly lower than control group. These results suggest that distraction inhibited activity of sympathetic nervous function.
The psychological influence of music or visual distrac-tion on endoscopy procedures remains controversial, but the number of articles reporting positive effects on anx-iety levels appears slightly greater than negative effects articles [1,14–16,25–31,37]. The present study demon-strated that the scores for negative mood based on POMS and impression of EGD at post-distraction (im-mediately pre-EGD) improved significantly compared to the baseline condition in the distraction groups. Accept-ance of distraction in all distraction groups was relatively good.
The present study had some limitations that should be noted. First, we used healing music and natural images that were selected as good by 20 volunteers in a pre-meeting for the selection of music prior to the start of the present study. However, whether the music and im-ages used in this study were the more suitable for each subject is not clear. Second, different results may occur between persons who underwent EGD for the first time and persons who experienced EGD pre-viously. Further investigation of subjects who undergo EGD for the first time or comparisons between per-sons who undergo EGD for the first time and re-peated procedures is required. Last, there was a possibility of selection bias because all of the partici-pants in the present study were healthy individuals undergoing a medical check-up. The mean of age of the subjects was relatively young. Whether sick per-sons or elderly populations would produce similar re-sults to the present study is not clear. Further studies are necessary to resolve these limitations.
Table 6 Comparison of the acceptance of the distraction after EGD among the three distraction groups
Audio group
Visual group
Combination group P-value
Usefulness of the distraction 72.3 ± 16.5 67.7 ± 15.5a 76.4 ± 17.4b < 0.005 Satisfaction of the distraction 68.6 ± 19.4 64.2 ± 18.6a 74.0 ± 18.6b < 0.005
Willingness for the next use of distraction
76.4 ± 17.3 73.1 ± 20.3 78.1 ± 17.7 NS
EGD Esophagogastroduodenoscopy
Data represent the means ± standard deviation (SD)
The P-value is based on the Kruskal Wallis-test. Significance is at the 5% level. Post hoc pairwise comparisons were performed using the Mann-Whitney U test with Bonferroni correction. Different letters indicate a significant difference at the 0.01667 (0.05/3) level
Conclusions
The present study demonstrated that distractions effect-ively improved psychological factors, vital signs, and HRV at pre and post-EGD. Additionally, distractions suppressed BP elevations during the latter half of EGD and sympathetic nerve function elevation at post-EGD. Although it is important for persons to undergo EGD to discover gastrointestinal lesions, the necessity for im-provements in various physical and psychological condi-tions at pre-EGD should be considered.
Supplementary information
Supplementary information accompanies this paper athttps://doi.org/10. 1186/s12876-020-01274-3.
Additional file 1: Figure 1. This study protocol. BP, blood pressure; EGD, esophagogastroduodenoscopy; HF, high-frequency; HRV, heart rate variability; LF, low-frequency; POMS, profile of mood states; PR, pulse rate.
Abbreviations
BP:Blood pressure; EGD: Esophagogastroduodenoscopy; HF: High-frequency; HRV: Heart rate variability; LF: Low-frequency; POMS: Profile of mood states; PR: Pulse rate; PSA: Power spectral analysis; VAS: Visual analog scale Acknowledgments
The authors would like to thank all subjects in our study. Additionally, the authors would like to thank all endoscopy nurses, the former hospital director (Masaharu Kamata), and the hospital director (Tetsuya Kitagawa) at Shikoku Central Hospital of the Mutual aid Association of Public School teachers.
Authors’ contributions
MS: study concept and design, data collection, statistical analysis, and writing of the draft manuscript, HM and MN: study co-design, AF, KK, YO, YA, and KO: endoscopy, TA, TN, and ST: data collection and data analysis, TK, HT and TT1: data collection and visualization, TO and TT2: study co-design and re-view of the manuscript. All authors have approved the final version of the article.
Funding None.
Availability of data and materials
The datasets used and analyzed during the current study will be available from the corresponding author on reasonable request.
Ethics approval and consent to participate
Written informed consent was obtained from all subjects. The study protocol was approved by the Ethics Committee in Shikoku Central Hospital of the Mutual Aid Association of Public School teachers and this study was performed in accordance with the Declaration of Helsinki. This trial was registered in the University Hospital Medical Information Network (UMIN) Clinical Trials Registry as UMIN000029637.
Consent for publication Not applicable. Competing interests
The authors declare that they have no competing interests. Author details
1
Department of Gastroenterology and Oncology, Tokushima University Graduate School of Biomedical Sciences, 3-18-15 Kuramoto-cho, Tokushima city, Tokushima 770-8503, Japan.2Department of Internal Medicine, Shikoku
Central Hospital of the Mutual aid Association of Public School teachers,
Shikokuchuo, Japan.3Department of Internal Medicine, Tsurugi Municipal
Handa Hospital, Tsurugi, Japan.
Received: 9 July 2019 Accepted: 13 April 2020
References
1. El-Hassan H, McKeown K, Muller AF. Clinical trial: music reduces anxiety levels in patients attending for endoscopy. Aliment Pharmacol Ther. 2009; 30:718–24.
2. Brandt L. Patients’ attitudes and apprehensions about endoscopy: how to calm troubled waters. Am J Gastroenterol. 2001;96:280–4.
3. Johnson JE, Morrissey JF, Leventhal H. Psychological preparation for an endoscopic examination. Gastrointest Endosc. 1973;19:180–1.
4. Keeffe EB, O’Connor KW. 1989 a/S/G/E survey of endoscopic sedation and monitoring practices. Gastrointest Endosc. 1990;36:S13–8.
5. Froehlich F, Gonvers JJ, Fried M. Conscious sedation, clinically relevant complications and monitoring of endoscopy: results of a nationwide survey in Switzerland. Endoscopy. 1994;26:231–4.
6. Abraham NS, Fallone CA, Mayrand S, Huang J, Wieczorek P, Barkun AN. Sedation versus no sedation in the performance of diagnostic upper gastrointestinal endoscopy: a Canadian randomized controlled cost-outcome study. Am J Gastroenterol. 2004;99:1692–9.
7. Cohen LB, Delegge MH, Aisenberg J, Brill JV, Inadomi JM, Kochman ML, et al. AGA Institute review of endoscopic sedation. Gastroenterology. 2007; 133:675–701.
8. McQuaid KR, Laine L. A systematic review and meta-analysis of randomized, controlled trials of moderate sedation for routine endoscopic procedures. Gastrointest Endosc. 2008;67:910–23.
9. Bell GD. Preparation, premedication, and surveillance. Endoscopy. 2004;36: 23–31.
10. Holm C, Christensen M, Rasmussen V, Schulze S, Rosenberg J. Hypoxaemia and myocardial ischaemia during colonoscopy. Scand J Gastroenterol. 1998; 33:769–72.
11. Nelson DB, Barkun AN, Block KP, Burdick JS, Ginsberg GG, Greenwald DA, et al. Propofol use during gastrointestinal endoscopy. Gastrointest Endosc. 2001;53:876–9.
12. Ko CW, Riffle S, Michaels L, Morris C, Holub J, Shapiro JA, et al. Serious complications within 30 days of screening and surveillance colonoscopy are uncommon. Clin Gastroenterol Hepatol. 2010;8:166–73.
13. Lee SY, Son HJ, Lee JM, Bae MH, Kim JJ, Paik SW, et al. Identification of factors that influence conscious sedation in gastrointestinal endoscopy. J Korean Med Sci. 2004;19:536–40.
14. Lee DW, Chan KW, Poon CM, Ko CW, Chan KH, Sin KS, et al. Relaxation music decreases the dose of patientcontrolled sedation during
colonoscopy: a prospective randomized controlled trial. Gastrointest Endosc. 2002;55:33–6.
15. Lembo T, Fitzgerald L, Matin K, Woo K, Mayer EA, Naliboff BD. Audio and visual stimulation reduces patient discomfort during screening flexible sigmoidoscopy. Am J Gastroenterol. 1998;93:1113–6.
16. Lee DW, Chan AC, Wong SK, Fung TM, Li AC, Chan SK, et al. Can visual distraction decrease the dose of patient-controlled sedation required during colonoscopy? A prospective randomized controlled trial. Endoscopy. 2004; 36:197–201.
17. Hayano J, Sakakibara Y, Yamada A, Yamada M, Mukai S, Fujinami T, et al. Accuracy of assessment of cardiac vagal tone by heart rate variability in normal subjects. Am J Cardiol. 1991;67:199–204.
18. Pagani M, Lombardi F, Guzzetti S, Rimoldi O, Furlan R, Pizzinelli P, et al. Power spectral analysis of heart rate and arterial pressure variabilities as a marker of sympatho-vagal interaction in man and conscious dog. Circ Res. 1986;59:178–93.
19. Pomeranz B, Macaulay RJ, Caudill MA, Kutz I, Adam D, Gordon D, et al. Assessment of autonomic function in humans by heart rate spectral analysis. Am J Phys. 1985;248:H151–3.
20. Akselrod S, Gordon D, Ubel FA, Shannon DC, Berger AC, Cohen RJ. Power spectrum analysis of heart rate fluctuation: a quantitative probe of beat-to-beat cardiovascular control. Science. 1981;213:220–2.
21. Malliani A, Pagani M, Lombardi F, Cerutti S. Cardiovascular neural regulation explored in the frequency domain. Circulation. 1991;84:482–92.
22. Task force of the European Society of Cardiology and the North American Society of Pacing and Electrophysiology. Heart rate variability. Standards of
measurement, physiological interpretation, and clinical use. Circulation. 1996;93:1043–65.
23. Kanbara K, Fukunaga M, Mutsuura H, Takeuchi H, Kitamura K, Nakai Y. An exploratory study of subgrouping of patients with functional somatic syndrome based on the psychophysiological stress response: its relationship with moods and subjective variables. Psychosom Med. 2007;69:158–65. 24. Terry PC, Lane AM, Lane HJ, Keohane L. Development and validation of a
mood measure for adolescents. J Sports Sci. 1999;17:861–72.
25. Ovayolu N, Ucan O, Pehlivan S, Pehlivan Y, Buyukhatipoglu H, Savas MC, et al. Listening to Turkish classical music decreases patients’ anxiety, pain, dissatisfaction and the dose of sedative and analgesic drugs during colonoscopy: a prospective randomized controlled trial. World J Gastroenterol. 2006;12:7532–6.
26. López-Cepero Andrada JM, Amaya Vidal A, Castro Aguilar-Tablada T, García Reina I, Silva L, Ruiz Guinaldo A, et al. Anxiety during the performance of colonoscopies: modification using music therapy. Eur J Gastroenterol Hepatol. 2004;16:1381–6.
27. Chlan L, Evans D, Greenleaf M, Walker J. Effects of a single music therapy intervention on anxiety, discomfort, satisfaction, and compliance with screening guidelines in outpatients undergoing flexible sigmoidoscopy. Gastroenterol Nurs. 2000;23:148–56.
28. Palakanis KC, DeNobile JW, Sweeney WB, Blankenship CL. Effect of music therapy on state anxiety in patients undergoing flexible sigmoidoscopy. Dis Colon Rectum. 1994;37:478–81.
29. Hayes A, Buffum M, Lanier E, Rodahl E, Sasso C. A music intervention to reduce anxiety prior to gastrointestinal procedures. Gastroenterol Nurs. 2003;26:145–9.
30. Danhauer SC, Marler B, Rutherford CA, Lovato JF, Asbury DY, McQuellon RP, et al. Music or guided imagery for women undergoing colposcopy: a randomized controlled study of effects on anxiety, perceived pain, and patient satisfaction. J Low Genit Tract Dis. 2007;11:39–45.
31. Colt HG, Powers A, Shanks TG. Effect of music on state anxiety scores in patients undergoing fiberoptic bronchoscopy. Chest. 1999;116:819–24. 32. Siegel R, Naishadham D, Jemal A. Cancer statistics, 2013. CA Cancer J Clin.
2013;63:11–30.
33. Mori A, Ohashi N, Tatebe H, Maruyama T, Inoue H, Takegoshi S, et al. Autonomic nervous function in upper gastrointestinal endoscopy: a prospective randomized comparison between transnasal and oral procedures. J Gastroenterol. 2008;43:38–44.
34. Kataoka H, Hayano J, Mizushima T, Tanaka M, Kubota E, Shimura T, et al. Cardiovascular tolerance and autonomic nervous responses in unsedated upper gastrointestinal small-caliber endoscopy: a comparison between transnasal and peroral procedures with newly developed mouthpiece. Dig Endosc. 2011;23:78–85.
35. Andrews PL, Grundy D, Scratcherd T. Vagal afferent discharge from mechanoreceptors in different regions of the ferret stomach. J Physiol. 1980; 298:513–24.
36. Zhang X, Jiang C, Tan Z, Fogel R. Vagal motor neurons in rats respond to noxious and physiological gastrointestinal distention differentially. Eur J Neurosci. 2002;16:2027–38.
37. Umezawa S, Higurashi T, Uchiyama S, Sakai E, Ohkubo H, Endo H, et al. Visual distraction alone for the improvement of colonoscopy-related pain and satisfaction. World J Gastroenterol. 2015;21:4707–14.
Publisher’s Note
Springer Nature remains neutral with regard to jurisdictional claims in published maps and institutional affiliations.