RESEARCH ARTICLE
Differences among patients with and without
nonalcoholic fatty liver disease having
elevated alanine aminotransferase levels at
various stages of metabolic syndrome
Masahiro SogabeID1,2*, Toshiya Okahisa1,2, Takeshi Kurihara2, Masanori Takehara1, Kaizo Kagemoto1, Jun Okazaki1, Yoshifumi Kida1, Akihiro Hirao1, Hironori TanakaID1, Tetsu TomonariID1, Tatsuya Taniguchi1, Koichi Okamoto1, Masahiko NakasonoID3, Tetsuji TakayamaID1
1 Department of Gastroenterology and Oncology, Tokushima University Graduate School of Biomedical
Sciences, Tokushima, Japan, 2 Department of Internal Medicine, Shikoku Central Hospital of the Mutual aid Association of Public School Teachers, Shikokuchuo, Japan, 3 Department of Internal Medicine, Tsurugi Municipal Handa Hospital, Tsurugi, Japan
Abstract
Background
The prevalence of nonalcoholic fatty liver disease (NAFLD) in the non-obese population has increased and NAFLD is not always recognized in individuals with metabolic syndrome (MS). The risk of cirrhosis is higher in patients having NAFLD with elevated alanine amino-transferase (ALT) levels than in those having NAFLD with normal ALT levels.
Objective
To measure the differences in clinical factors associated with NAFLD having elevation of ALT among subjects with Non-MS, Pre-MS, and MS, and to measure differences in metabo-lites between MS subjects with and without NAFLD having elevation of ALT.
Methods
Among 7,054 persons undergoing health check-ups, we included 3,025 subjects who met the selection criteria. We measured differences in clinical factors for NAFLD having eleva-tion of ALT among subjects with Non-MS, Pre-MS, and MS, and compared metabolites between subjects with and without NAFLD having elevation of ALT in 32 subjects with MS.
Results
The prevalence of NAFLD and NAFLD having elevation of ALT was significantly progres-sively greater in subjects with Non-MS, Pre-MS, and MS (p<0.001, respectively). In the Non-MS group, there were significant differences between subjects with and without NAFLD having elevation of ALT with respect to body mass index (BMI), high-density lipopro-tein cholesterol (HDL-C), low-density lipoprolipopro-tein cholesterol, hemoglobin A1c, uric acid,
a1111111111 a1111111111 a1111111111 a1111111111 a1111111111 OPEN ACCESS
Citation: Sogabe M, Okahisa T, Kurihara T,
Takehara M, Kagemoto K, Okazaki J, et al. (2020) Differences among patients with and without nonalcoholic fatty liver disease having elevated alanine aminotransferase levels at various stages of metabolic syndrome. PLoS ONE 15(8): e0238388. https://doi.org/10.1371/journal.pone.0238388
Editor: Jonathan M. Peterson, East Tennessee
State University, UNITED STATES
Received: May 22, 2020 Accepted: August 14, 2020 Published: August 31, 2020
Copyright:© 2020 Sogabe et al. This is an open access article distributed under the terms of the Creative Commons Attribution License, which permits unrestricted use, distribution, and reproduction in any medium, provided the original author and source are credited.
Data Availability Statement: All relevant data are
within the manuscript and its Supporting Information files.
Funding: This work was supported by
Grants-in-Aid for Scientific Research (KAKENHI) (C) to M.S. (no. 16K09057) from the Japan Society for the Promotion of Science (JSPS) and the funders had no role in this manuscript.
Competing interests: The authors have declared
aspartate aminotransferase (AST); In the Pre-MS group, there were significant differences in BMI, hypertension, AST, and gamma-glutamyl transpeptidase (GGT); In the MS group, there were significant differences in HDL-C, impaired glucose tolerance, AST, and GGT. There were significant differences in levels of metabolites of nicotinamide, inosine, and ace-tyl-L-carnitine between MS subjects with and without NAFLD having elevation of ALT (all p<0.05).
Conclusions
Although NAFLD having elevation of ALT is important for development of NAFLD, differ-ences in factors associated with NAFLD having elevation of ALT at various stages of MS should be considered. Additionally, several metabolites may play roles in the identification of risk for NAFLD in individuals with MS.
Introduction
Despite the fact that the increase in prevalence of metabolic syndrome (MS) that is strongly associated with nonalcoholic fatty liver disease (NAFLD) has been problematic in gastroenter-ology, NAFLD is not always recognized in individuals with MS [1–3]. Persons who are easy to become NAFLD and those who are hard to become NAFLD may exist in individuals who belong to the same MS. Additionally, the prevalence of NAFLD in the non-obese population has gradually increased in Japan, and not low [4,5]. Generally, NAFLD is diagnosed using the presence of fatty liver regardless of assessment of liver enzymes in the context of medical check-ups and NAFLD having elevation of liver enzyme and NAFLD having standard values of liver enzyme have been treated in the same way; nevertheless, patients with NAFLD and ele-vation of alanine aminotransferase (ALT) are at higher risk for cirrhosis than those with NAFLD and normal ALT values [6]. However, there is few reports about NAFLD having eleva-tion of ALT levels at various stages of MS. The aim of this study was to measure the differences in clinical factors associated with NAFLD having elevation of ALT among subjects with Non-MS, Pre-Non-MS, and Non-MS, and to measure differences in metabolites between MS subjects with and without NAFLD having elevation of ALT.
Methods
Study design and subjects
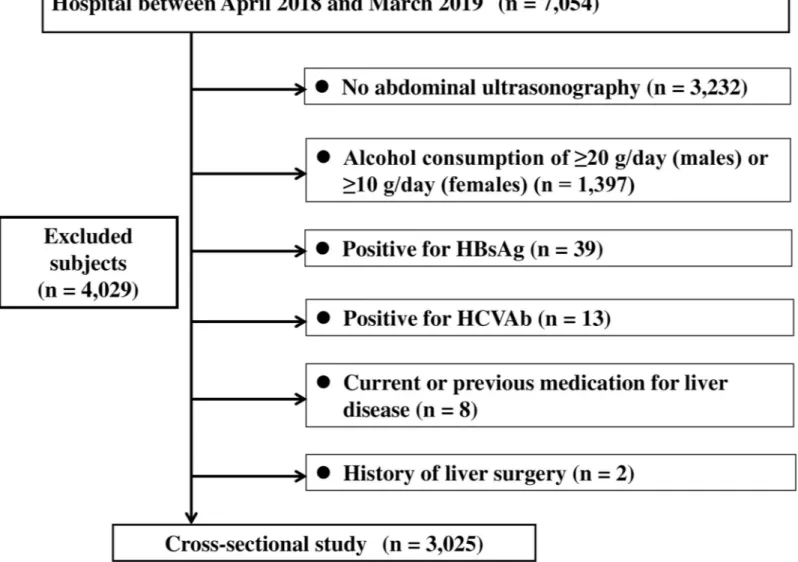
This cross-sectional study was conducted among 7,054 subjects residing in the Shikoku region, Japan, and undergoing regular health check-ups at Shikoku Central Hospital of the Mutual Aid Association of Public School Teachers between April 2018 and March 2019. Among 7,054 subjects, 4,029 subjects were excluded for fulfilling any of the following criteria: (1) positivity for markers of hepatitis B virus infection (hepatitis B surface antigen) and/or hepatitis C virus infection (anti-hepatitis C virus antibodies); (2) alcohol consumption of �20 g/day in males or alcohol consumption of �10 g/day in females; (3) absence of abdominal ultrasonography; (4) history of liver surgery; and (5) current or previous medication for liver disease. Finally, 3,025 subjects were enrolled (Fig 1). The study protocol was approved by the Ethics Committee of Shikoku Central Hospital, and all procedures were performed in accordance with the Declara-tion of Helsinki. All subjects were informed that their clinical data might be retrospectively analyzed, and informed consent was obtained.
Diagnosis of MS
The diagnostic criteria for MS adopted by the World Health Organization (WHO) or the adult treatment panel (ATP) III criteria are used worldwide. However, we adopted the MS criteria proposed by the joint committee of eight Japanese medical societies in 2005 because all sub-jects in our study were Japanese [7]. Component factors of MS criteria are waist circumference (WC) must exceed 85 cm for males or 90 cm for females, and the presence of two or more of the following: (1) dyslipidemia: high-density lipoprotein cholesterol (HDL-C) <40 mg/dl, and/or triglycerides (TG) �150 mg/dl, or medication for dyslipidemia; (2) impaired glucose tolerance (IGT): fasting plasma glucose (FPG) �110 mg/dl or medication for diabetes; and (3) hypertension: blood pressure � 130/85 mmHg or medication for hypertension.
We designated individuals who fulfilled these criteria as the MS group. Individuals who did not fulfill above MS criteria were divided into two groups as follows: The Non-MS group was defined as individuals having no component of MS; The Pre-MS group was defined as
Fig 1. Participant flow of individuals undergoing check-ups. HBsAg, hepatitis B surface antigen; HCVAb, hepatitis C antibody.
individuals having more than 85 cm of WC for males or 90 cm for females and one component of MS.
Physical examination and serum biochemistry
Body weight (BW) and height were obtained from all subjects. BW was measured to the near-est 0.1 kg, and height was measured to the nearnear-est 0.1 cm. The body mass index (BMI) was cal-culated as the weight (in kilograms) divided by the square of the height (in meters) expressed in kg/m2. WC was measured at the umbilical level by a laboratory technician. Venous blood samples were taken from all subjects in the morning after 12 hours of overnight fasting. Clini-cal laboratory tests included aspartate aminotransferase (AST), ALT, gamma-glutamyl trans-peptidase (GGT), total cholesterol (T-CHO), HDL-C, TG, low-density lipoprotein cholesterol (LDL-C), uric acid (UA), FPG, and hemoglobin A1c (HbA1c). Ferritin, insulin, and type IV collagen 7S were measured among 34 subjects with MS during 2018 April, and the homeostasis model assessment of insulin resistance (HOMA-IR) and NAFIC score and the Fibrosis (FIB)-4 indexes were assessed [8–12]. ALT elevation was defined as level more than 30 IU/L.
Assessment of ultrasonography
Standard abdominal ultrasonography was performed by trained technicians in the morning with the subjects fasting. The HI-VISION Avius1and ALOKA ARIETTA 850 (Hitachi Ltd., Tokyo, Japan) platforms with 6-MHz convex-array probes were used for ultrasonography. The diagnostic criteria for fatty liver on ultrasonography were as follows: echo contrast between the liver and the renal cortex, liver brightness, blurring of liver vessels, and/or deep attenuation [13,14]. In our study, fatty liver with alcohol consumption of less than 20 g/day in males or alcohol consumption of less than 10 g/day in females and without chronic liver diseases such as hepatitis B, hepatitis C, and liver disease related with autoimmune was defined as NAFLD.
Metabolomics and sulfur metabolomics
Sera from 34 subjects with MS during 2018 April were obtained by centrifugation of blood samples for 10 min at 1500× g at 4˚C, and was stored at –80˚C until use. Metabolomics follow-ing the primary metabolism method was performed usfollow-ing liquid chromatography coupled to a tandem mass spectrometry (LC-MS/MS) (Nexera UHPLC system with on-line LC-MS 8040, Shimadzu Corporation, Kyoto, Japan). Briefly, 10μL of serum was added to 110 μL methanol containing internal standards at 0˚C to inactivate native enzymes. After centrifugation, the upper aqueous layer of the separated solution was desiccated using a centrifugal evaporator. Thereafter, 60μL of water was added, and the solution was centrifuged. We used 10 μL from the upper aqueous layer as the metabolomics sample. Sulfur metabolomics was performed by the Sulfur Index service in Japan (http://www.euglena.jp/sulfurindex/; Euglena Co. Ltd., Tokyo, Japan). The sulfur index uses a technology where metabolites are detected as S-bimanyl derivatives by LC-MS/MS (Shimadzu (Nexera UHPLC system with on-line LC-MS 8040, Shi-madzu, Corporation, Kyoto, Japan) as described previously [15,16]. Briefly, the sulfur-con-taining compounds in the samples were extracted by adding methanol and converting to fluorescent derivatives with monobromobimane. The levels of the target metabolites were determined from the peak area in the mass chromatography, monitoring each mass-to-charge ratio of the individual target, and represented as relative amounts (relative areas) after normal-ization based on the peak area of the internal standard (D-camphor-10-sulfonic acid). We measured 101 primary metabolites such as amino acids, organic acids, and the like, and a total of 52 metabolites were obtained from subjects with MS. We measured 90 sulfur metabolites and found a total of 17 sulfur metabolites in subjects with MS.
Statistical analysis
Quantitative data, including subject baseline characteristics, were expressed as the
mean± standard deviation (SD). P-values of less than 0.05 were considered statistically signifi-cant. Theχ2-test or Mann–Whitney U-test was used for comparisons between the two groups. The m× n χ2-test or Kruskal–Wallis test was used to analyze differences among three groups. If the Kruskal–Wallis test revealed differences between the groups, then post-hoc pairwise comparisons were performed using the Mann–Whitney U test with Bonferroni correction. Correlations between variables were assessed by calculating Spearman rank correlation coeffi-cients. Factors with significant influence on the prevalence of NAFLD having elevation of ALT were determined using univariate analysis. All parameters that hadP-values of less than 0.05
by univariate analysis were assessed using stepwise multivariate logistic regression analysis adjusted for age and gender. The odds ratio (OR) and 95% confidence interval (CI) were ana-lyzed for each variable. All statistical analyses were performed using MedCalc Statistical Soft-ware for Windows (MedCalc SoftSoft-ware; Ostend, Belgium).
Results
Baseline characteristics among Non-MS, Pre-MS, and MS groups
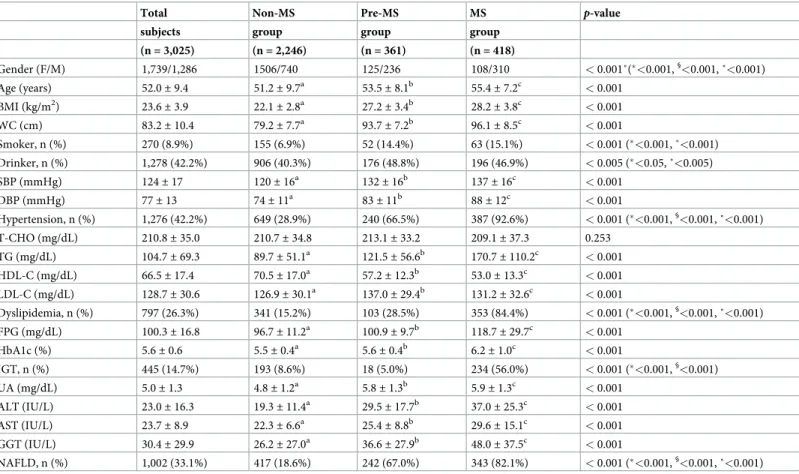
The baseline characteristics of 3,025 subjects are shown inTable 1. The prevalence of Non-MS, Pre-MS, and MS groups was 74.3%, 11.9%, and 13.8%, respectively. The proportion of males, age, BMI, and WC were significantly high in order of MS group, Pre-MS group, Non-MS group (p < 0.001, p <0.05, p <0.05, and p <0.05, respectively). The prevalence of smoker and drinker in MS group
and Pre-MS group were significantly higher than in Non-MS group (p < 0.001 and p <0.05,
respectively). The prevalence of hypertension, SBP, and DBP were significantly high in order of MS group, Pre-MS group, Non-MS group (p < 0.001, p <0.05, and p <0.05, respectively). The
preva-lence of dyslipidemia, TG, and LDL-C were significantly high in order of MS group, Pre-MS group, Non-MS group (p < 0.001, p <0.05, and p <0.05, respectively), and HDL-C was significantly low
in order of MS group, Pre-MS group, Non-MS group (p <0.05). FPG and HbA1c were significantly
high in order of MS group, Pre-MS group, Non-MS group (p <0.05 for both). The prevalence of
IGT was significantly higher in MS group than in Pre-MS group and Non-MS group (p <0.001).
UA was significantly high in order of MS group, Pre-MS group, Non-MS group (p <0.05). ALT,
AST, GGT, and the prevalence of NAFLD were significantly high in order of MS group, Pre-MS group, Non-MS group (p < 0.05, p <0.05, p <0.05, and p <0.001, respectively).
Comparison of the prevalence of NAFLD and NAFLD having elevation of
ALT among Non-MS, Pre-MS, and MS groups
The comparison of the prevalence of NAFLD among the Non-MS, Pre-MS, and MS groups is
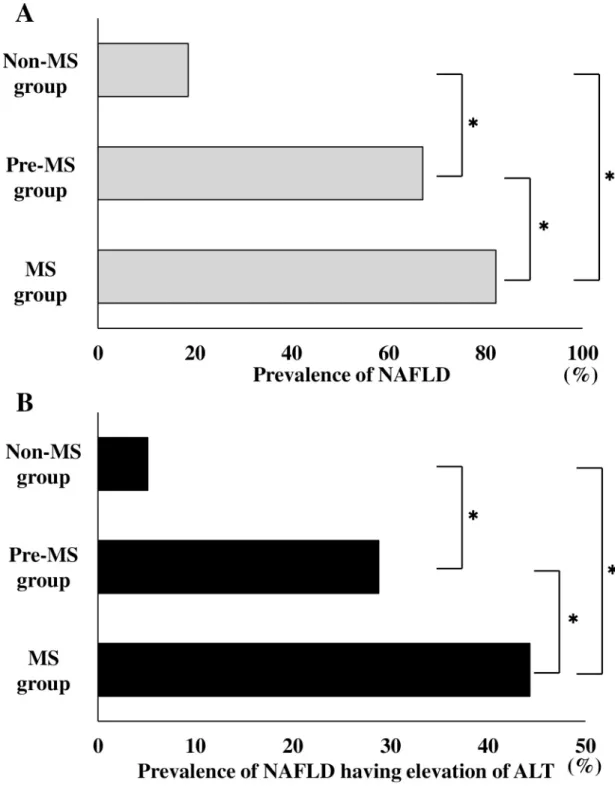
shown inFig 2A. The prevalence of NAFLD in Non-MS group, Pre-MS group, and MS group
were 18.6% (417/2,246), 67.0% (242/361), and 82.1% (343/418), respectively. There was a sig-nificant difference in the prevalence of NAFLD among the three groups (p < 0.001). The
prev-alence of NAFLD was higher in the MS group vs. the Pre-MS group and the Non-MS group
(p < 0.001 and p < 0.001, respectively), and the prevalence of NAFLD was significantly higher
in the Pre-MS group than in the Non-MS group (p <0.001).
A comparison of the prevalence of NAFLD having elevation of ALT among Non-MS, Pre-MS, and MS groups is shown inFig 2B. The prevalence of NAFLD having elevation of ALT in Non-MS, Pre-MS, and MS groups were 5.1% (115/2,246), 28.8% (104/361), and 44.3% (185/ 418), respectively. There were significant differences in the prevalence of NAFLD having eleva-tion of ALT among the three groups (p < 0.001). The prevalence of NAFLD having elevation
of ALT was higher in the MS group than in the Pre-MS group and Non-MS group (p < 0.001
andp < 0.001, respectively), and the prevalence of NAFLD having elevation of ALT was higher
in Pre-MS group than in the Non-MS group (p <0.001).
Factors associated with NAFLD having elevation of ALT among Non-MS,
Pre-MS, and MS groups
Results of univariate analysis for factors associated with NAFLD having elevation of ALT
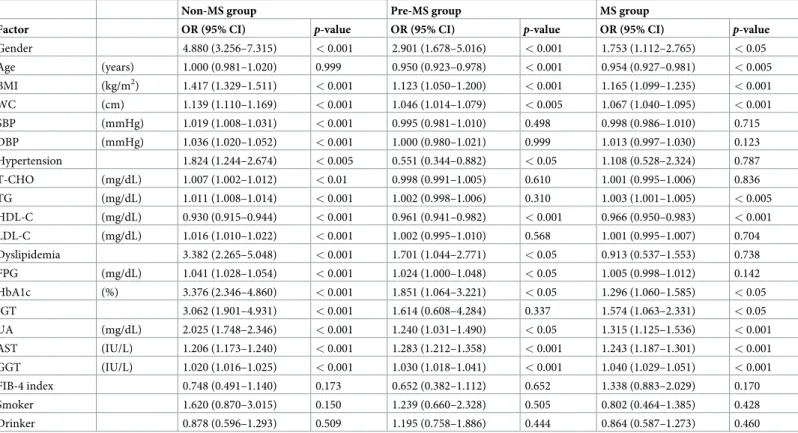
among Non-MS group, Pre-MS group, and MS group are shown inTable 2. In the Non-MS
group, univariate analysis showed that gender, BMI, WC, SBP, DBP, hypertension, T-CHO, TG, HDL-C, LDL-C, dyslipidemia, FPG, HbA1c, IGT, UA, AST, and GGT were significantly associated with NAFLD having elevation of ALT. In the Pre-MS group, univariate analysis showed that gender, age, BMI, WC, hypertension, HDL-C, dyslipidemia, FPG, HbA1c, UA,
Table 1. Baseline characteristics among Non-MS, Pre-MS, and MS groups (n = 3,025).
Total Non-MS Pre-MS MS p-value
subjects group group group
(n = 3,025) (n = 2,246) (n = 361) (n = 418) Gender (F/M) 1,739/1,286 1506/740 125/236 108/310 < 0.001˚(�<0.001,§ <0.001, ˚<0.001) Age (years) 52.0± 9.4 51.2± 9.7a 53.5± 8.1b 55.4± 7.2c < 0.001 BMI (kg/m2) 23.6 ± 3.9 22.1± 2.8a 27.2 ± 3.4b 28.2 ± 3.8c < 0.001 WC (cm) 83.2± 10.4 79.2± 7.7a 93.7 ± 7.2b 96.1 ± 8.5c < 0.001 Smoker, n (%) 270 (8.9%) 155 (6.9%) 52 (14.4%) 63 (15.1%) < 0.001 (�<0.001, ˚<0.001) Drinker, n (%) 1,278 (42.2%) 906 (40.3%) 176 (48.8%) 196 (46.9%) < 0.005 (�<0.05, ˚<0.005) SBP (mmHg) 124± 17 120± 16a 132 ± 16b 137 ± 16c < 0.001 DBP (mmHg) 77± 13 74± 11a 83 ± 11b 88 ± 12c < 0.001 Hypertension, n (%) 1,276 (42.2%) 649 (28.9%) 240 (66.5%) 387 (92.6%) < 0.001 (�<0.001,§ <0.001, ˚<0.001) T-CHO (mg/dL) 210.8± 35.0 210.7± 34.8 213.1± 33.2 209.1± 37.3 0.253 TG (mg/dL) 104.7± 69.3 89.7± 51.1a 121.5 ± 56.6b 170.7 ± 110.2c < 0.001 HDL-C (mg/dL) 66.5± 17.4 70.5± 17.0a 57.2 ± 12.3b 53.0 ± 13.3c < 0.001 LDL-C (mg/dL) 128.7± 30.6 126.9± 30.1a 137.0± 29.4b 131.2± 32.6c < 0.001 Dyslipidemia, n (%) 797 (26.3%) 341 (15.2%) 103 (28.5%) 353 (84.4%) < 0.001 (�<0.001,§<0.001, ˚<0.001) FPG (mg/dL) 100.3± 16.8 96.7± 11.2a 100.9 ± 9.7b 118.7 ± 29.7c < 0.001 HbA1c (%) 5.6± 0.6 5.5± 0.4a 5.6 ± 0.4b 6.2 ± 1.0c < 0.001 IGT, n (%) 445 (14.7%) 193 (8.6%) 18 (5.0%) 234 (56.0%) < 0.001 (�<0.001,§ <0.001) UA (mg/dL) 5.0± 1.3 4.8± 1.2a 5.8± 1.3b 5.9± 1.3c < 0.001 ALT (IU/L) 23.0± 16.3 19.3± 11.4a 29.5 ± 17.7b 37.0 ± 25.3c < 0.001 AST (IU/L) 23.7± 8.9 22.3± 6.6a 25.4 ± 8.8b 29.6 ± 15.1c < 0.001 GGT (IU/L) 30.4± 29.9 26.2± 27.0a 36.6± 27.9b 48.0± 37.5c < 0.001 NAFLD, n (%) 1,002 (33.1%) 417 (18.6%) 242 (67.0%) 343 (82.1%) < 0.001 (�<0.001,§ <0.001, ˚<0.001)
Data represent the mean± standard deviation (SD) and number for categorical variables.
P-values are based on the m × n χ2-test or Kruskal Wallis test. If the Kruskal Wallis test revealed differences between the groups, then post-hoc pairwise comparisons were performed using the Mann-Whitney U test with Bonferroni correction. Different letters (a, b, c) indicate a significant difference at the 0.0166 (0.05/3) level. Theχ2
-test was used for comparisons of number for categorical variables between the two groups (�MS group vs. non-MS group,§
MS group vs. pre-MS group, ˚pre-MS group vs. non-MS group). Significant is at the 5% level.
ALT, alanine aminotransferase; AST, aspartate aminotransferase; BMI, body mass index; DBP, diastolic blood pressure; F, female; FPG, fasting plasma glucose; GGT, gamma-glutamyl transpeptidase; HbA1c, hemoglobin A1c; HDL-C, high-density lipoprotein cholesterol; IGT, impaired glucose tolerance; LDL-C, low-density lipoprotein cholesterol; M, male; MS, metabolic syndrome; NAFLD, nonalcoholic fatty liver disease; SBP, systolic blood pressure; T-CHO, total cholesterol; TG, triglyceride; UA, uric acid; WC, waist circumference. Drinker: < 20 g/day of alcohol in male; < 10 g/day of alcohol in female.
AST, and GGT were significantly associated with NAFLD having elevation of ALT. In the MS group, univariate analysis showed that gender, age, BMI, WC, TG, HDL-C, HbA1c, IGT, UA, AST, and GGT were significantly associated with NAFLD having elevation of ALT.
Fig 2. Comparison of the prevalence of NAFLD and NAFLD having elevation of ALT among the Non-MS, Pre-MS, and MS groups. A Comparison of the prevalence of NAFLD among the Non-MS, Pre-MS, and MS groups. B Comparison of the
prevalence of NAFLD having elevation of ALT among the Non-MS, Pre-MS, and MS groups. The gray bar indicates the prevalence of NAFLD. The black bar indicates the prevalence of NAFLD having elevation of ALT. ALT, alanine aminotransferase; MS, metabolic syndrome; NAFLD, nonalcoholic fatty liver disease;�P < 0.001.
Independent predictors of NAFLD having elevation of ALT among
Non-MS, Pre-Non-MS, and MS groups
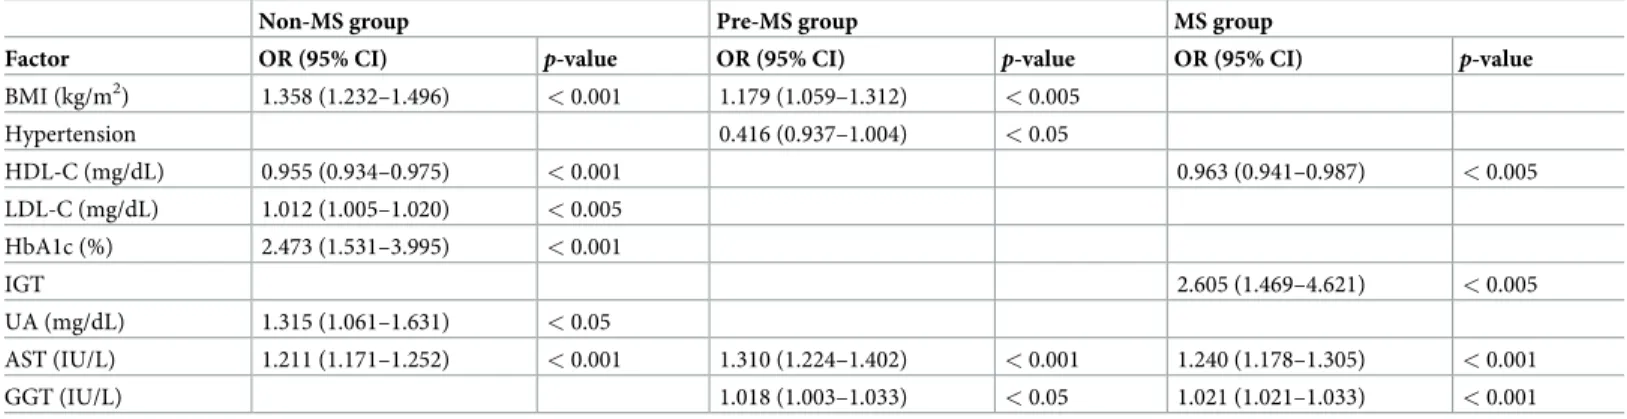
Results of multivariate analysis for independent predictors of NAFLD having elevation of ALT
among Non-MS group, Pre-MS group, and MS group are shown inTable 3. In the Non-MS
group, BMI, LDL-C, HbA1c, UA and AST were significant independent predictors of
increased prevalence of NAFLD having elevation of ALT, whereas HDL-C contributed signifi-cantly and independently to decreased prevalence of NAFLD having elevation of ALT. In the Pre-MS group, BMI, AST, and GGT were significant and independent predictors of increased prevalence of NAFLD having elevation of ALT, whereas hypertension contributed significantly and independently to decreased prevalence of NAFLD having elevation of ALT. In the MS group, IGT, AST, and GGT were significant and independent predictors of increased preva-lence of NAFLD having elevation of ALT, whereas HDL-C contributed significantly and inde-pendently to decreased prevalence of NAFLD having elevation of ALT.
Comparison of baseline characteristics between subjects with and without
NAFLD having elevation of ALT in 32 subjects with MS
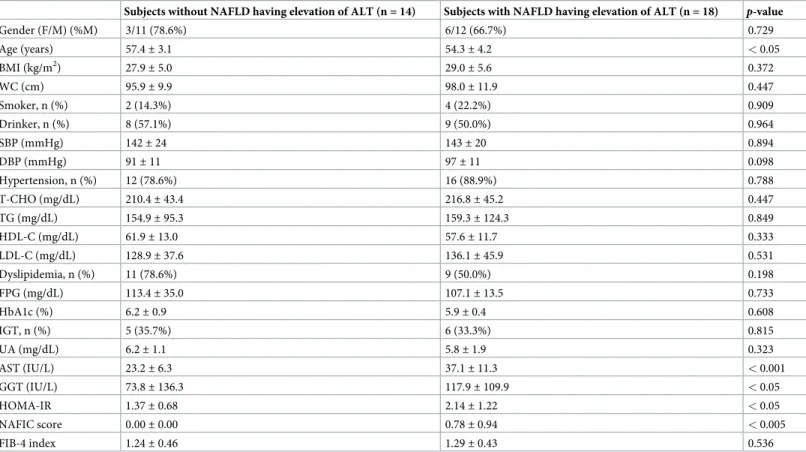
A comparison of the baseline characteristics between subjects with and without NAFLD hav-ing elevation of ALT in 32 subjects with MS are shown inTable 4. The mean age in subjects
Table 2. Results of univariate analysis for factors associated with NAFLD having elevation of ALT among Non-MS, Pre-MS, and MS groups.
Non-MS group Pre-MS group MS group
Factor OR (95% CI) p-value OR (95% CI) p-value OR (95% CI) p-value
Gender 4.880 (3.256–7.315) < 0.001 2.901 (1.678–5.016) < 0.001 1.753 (1.112–2.765) < 0.05 Age (years) 1.000 (0.981–1.020) 0.999 0.950 (0.923–0.978) < 0.001 0.954 (0.927–0.981) < 0.005 BMI (kg/m2) 1.417 (1.329–1.511) < 0.001 1.123 (1.050–1.200) < 0.001 1.165 (1.099–1.235) < 0.001 WC (cm) 1.139 (1.110–1.169) < 0.001 1.046 (1.014–1.079) < 0.005 1.067 (1.040–1.095) < 0.001 SBP (mmHg) 1.019 (1.008–1.031) < 0.001 0.995 (0.981–1.010) 0.498 0.998 (0.986–1.010) 0.715 DBP (mmHg) 1.036 (1.020–1.052) < 0.001 1.000 (0.980–1.021) 0.999 1.013 (0.997–1.030) 0.123 Hypertension 1.824 (1.244–2.674) < 0.005 0.551 (0.344–0.882) < 0.05 1.108 (0.528–2.324) 0.787 T-CHO (mg/dL) 1.007 (1.002–1.012) < 0.01 0.998 (0.991–1.005) 0.610 1.001 (0.995–1.006) 0.836 TG (mg/dL) 1.011 (1.008–1.014) < 0.001 1.002 (0.998–1.006) 0.310 1.003 (1.001–1.005) < 0.005 HDL-C (mg/dL) 0.930 (0.915–0.944) < 0.001 0.961 (0.941–0.982) < 0.001 0.966 (0.950–0.983) < 0.001 LDL-C (mg/dL) 1.016 (1.010–1.022) < 0.001 1.002 (0.995–1.010) 0.568 1.001 (0.995–1.007) 0.704 Dyslipidemia 3.382 (2.265–5.048) < 0.001 1.701 (1.044–2.771) < 0.05 0.913 (0.537–1.553) 0.738 FPG (mg/dL) 1.041 (1.028–1.054) < 0.001 1.024 (1.000–1.048) < 0.05 1.005 (0.998–1.012) 0.142 HbA1c (%) 3.376 (2.346–4.860) < 0.001 1.851 (1.064–3.221) < 0.05 1.296 (1.060–1.585) < 0.05 IGT 3.062 (1.901–4.931) < 0.001 1.614 (0.608–4.284) 0.337 1.574 (1.063–2.331) < 0.05 UA (mg/dL) 2.025 (1.748–2.346) < 0.001 1.240 (1.031–1.490) < 0.05 1.315 (1.125–1.536) < 0.001 AST (IU/L) 1.206 (1.173–1.240) < 0.001 1.283 (1.212–1.358) < 0.001 1.243 (1.187–1.301) < 0.001 GGT (IU/L) 1.020 (1.016–1.025) < 0.001 1.030 (1.018–1.041) < 0.001 1.040 (1.029–1.051) < 0.001 FIB-4 index 0.748 (0.491–1.140) 0.173 0.652 (0.382–1.112) 0.652 1.338 (0.883–2.029) 0.170 Smoker 1.620 (0.870–3.015) 0.150 1.239 (0.660–2.328) 0.505 0.802 (0.464–1.385) 0.428 Drinker 0.878 (0.596–1.293) 0.509 1.195 (0.758–1.886) 0.444 0.864 (0.587–1.273) 0.460
ALT, alanine aminotransferase; AST, aspartate aminotransferase; BMI, body mass index; CI, confidence interval; DBP, diastolic blood pressure; FPG, fasting plasma glucose; GGT, gamma-glutamyl transpeptidase; HbA1c, hemoglobin A1c; HDL-C, high-density lipoprotein cholesterol; IGT, impaired glucose tolerance; LDL-C, low-density lipoprotein cholesterol; MS, metabolic syndrome; NAFLD, nonalcoholic fatty liver disease; OR, odds ratio; SBP, systolic blood pressure; T-CHO, total cholesterol; TG, triglyceride; UA, uric acid; WC, waist circumference. Drinker: < 20 g/day of alcohol in male; < 10 g/day of alcohol in female.
without NAFLD having elevation of ALT was significantly higher than that in subjects with NAFLD having elevation of ALT (p < 0.05). AST, HOMA-IR, and NAFIC scores in subjects
with NAFLD having elevation of ALT were significantly higher than those in subjects without NAFLD having elevation of ALT (p < 0.001, p < 0.05, and p < 0.005, respectively).
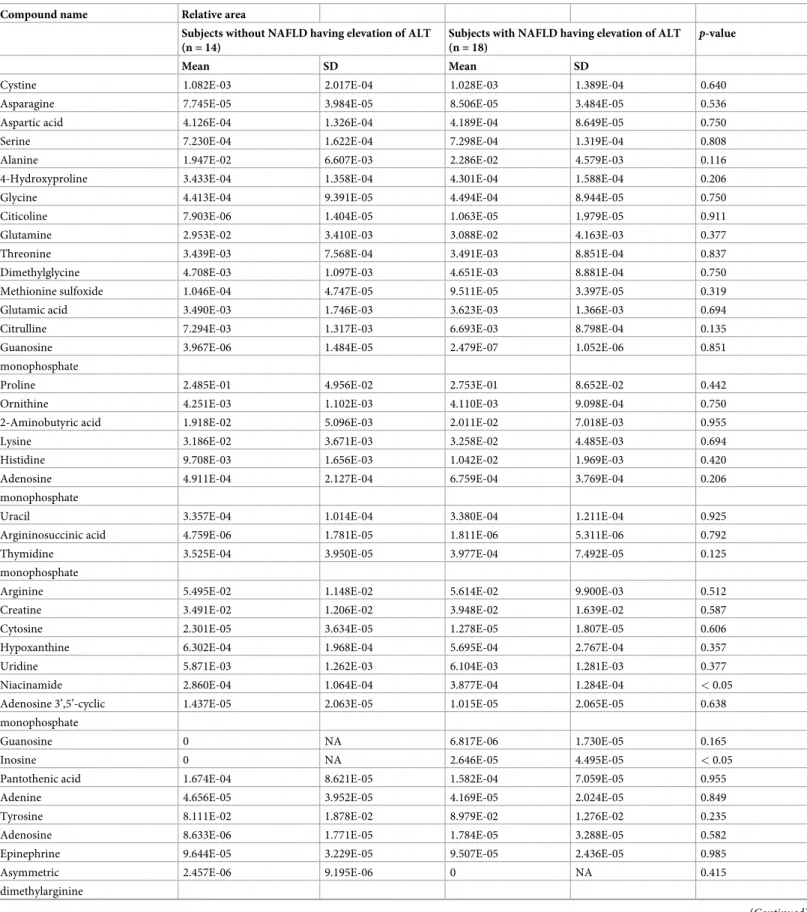
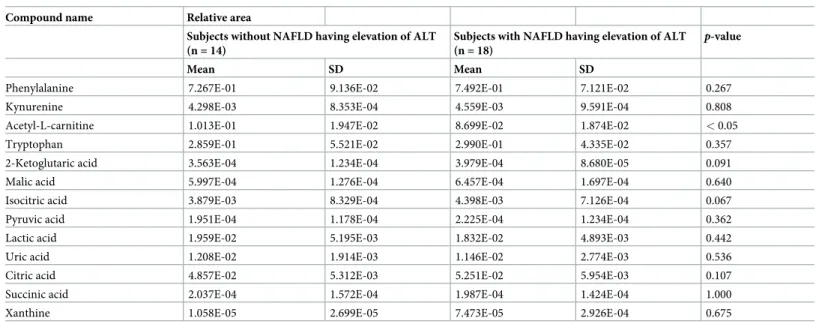
Comparison of primary metabolites between subjects with and without
NAFLD having elevation of ALT in 32 subjects with MS
A comparison of 52 metabolites between subjects with and without NAFLD having elevation of ALT in 32 subjects with MS are shown inTable 5. There were significant differences in three of the 52 metabolites between subjects with and without NAFLD having elevation of ALT. Mean nicotinamide levels in the subjects without NAFLD having elevation of ALT and subjects with NAFLD having elevation of ALT of ALT were 2.860E-04± 1.064E-04 and 3.877E-04± 1.284E-04, respectively, which was a statistically significant difference (p < 0.05). Mean inosine levels in the subjects without NAFLD having elevation of ALT and subjects with NAFLD having elevation of ALT were 0 and 2.646E-05± 4.495E-05, respectively, which was also a statistically significant difference (p < 0.05). Mean acetyl-L-carnitine levels in the
sub-jects without NAFLD having elevation of ALT and subsub-jects with NAFLD having elevation of ALT were 1.013E-01± 1.947E-02 and 8.699E-02 ± 1.874E-02, respectively, which was also a statistically significant difference (p < 0.05).
Correlations between clinical parameters and significant metabolites for
NAFLD having elevation of ALT
Spearman rank coefficients for clinical parameters and metabolites with statistically significant differences between subjects with and without NAFLD having elevation of ALT in MS are shown inTable 6. Niacinamide levels correlated significantly with ALT, NAFIC score, and NAFLD having elevation of ALT (p <0.05 for all). Inosine levels correlated significantly with
ALT, HOMA-IR, and NAFLD having elevation of ALT (p < 0.05, p <0.01, and p <0.05,
respectively). Acetyl-L-carnitine levels correlated significantly with IGT and NAFLD having elevation of ALT (p < 0.05 for both).
Table 3. Results of multivariate analysis for independent predictors of NAFLD having elevation of ALT among Non-MS, Pre-MS, and MS groups.
Non-MS group Pre-MS group MS group
Factor OR (95% CI) p-value OR (95% CI) p-value OR (95% CI) p-value
BMI (kg/m2) 1.358 (1.232–1.496) < 0.001 1.179 (1.059–1.312) < 0.005 Hypertension 0.416 (0.937–1.004) < 0.05 HDL-C (mg/dL) 0.955 (0.934–0.975) < 0.001 0.963 (0.941–0.987) < 0.005 LDL-C (mg/dL) 1.012 (1.005–1.020) < 0.005 HbA1c (%) 2.473 (1.531–3.995) < 0.001 IGT 2.605 (1.469–4.621) < 0.005 UA (mg/dL) 1.315 (1.061–1.631) < 0.05 AST (IU/L) 1.211 (1.171–1.252) < 0.001 1.310 (1.224–1.402) < 0.001 1.240 (1.178–1.305) < 0.001 GGT (IU/L) 1.018 (1.003–1.033) < 0.05 1.021 (1.021–1.033) < 0.001
All the parameters that had aP value of less than 0.05 by univariate analysis were assessed using stepwise multivariate logistic regression analysis adjusted age and
gender.
ALT, alanine aminotransferase; AST, aspartate aminotransferase; BMI, body mass index; CI, confidence interval; GGT, gamma-glutamyl transpeptidase; HbA1c, hemoglobin A1c; HDL-C, high-density lipoprotein cholesterol; IGT, impaired glucose tolerance; LDL-C, low-density lipoprotein cholesterol; MS, metabolic syndrome; NAFLD, nonalcoholic fatty liver disease; OR, odds ratio; UA, uric acid.
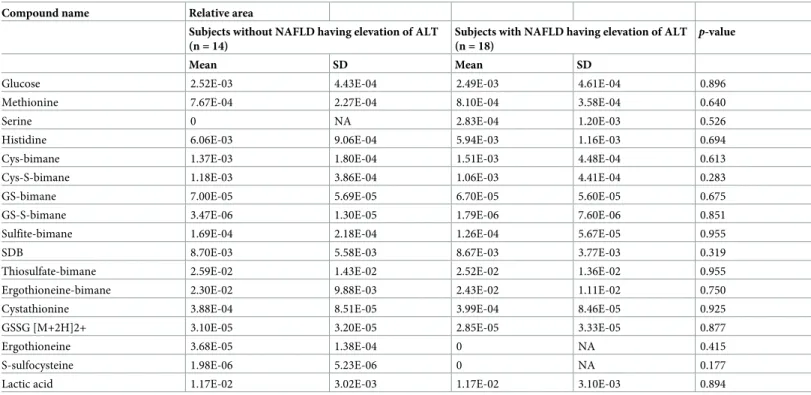
Comparison of sulfur metabolites between subjects with and without
NAFLD having elevation of ALT in 32 subjects with MS
A comparison of 17 sulfur metabolites that was associated sulfur metabolic pathways between subjects with and without NAFLD having elevation of ALT in 32 subjects with MS are shown inTable 7. There were no differences in sulfur metabolites between subjects with and without NAFLD having elevation of ALT.
Discussion
The aim of the present study was to clarify the differences in clinical factors associated with NAFLD having elevation of ALT among subjects with Non-MS, Pre-MS, and MS, and to mea-sure differences in metabolites between MS subjects with and without NAFLD having eleva-tion of ALT. The present study showed that the prevalence of NAFLD having elevaeleva-tion of ALT was progressively greater in subjects with Non-MS, Pre-MS, and MS, however, independent predictors for NAFLD having elevation of ALT differed among subjects with MS, Pre-MS, and
Table 4. Comparison of baseline characteristics between subjects with and without NAFLD having elevation of ALT in 32 subjects with MS.
Subjects without NAFLD having elevation of ALT (n = 14) Subjects with NAFLD having elevation of ALT (n = 18) p-value
Gender (F/M) (%M) 3/11 (78.6%) 6/12 (66.7%) 0.729 Age (years) 57.4± 3.1 54.3± 4.2 < 0.05 BMI (kg/m2) 27.9± 5.0 29.0± 5.6 0.372 WC (cm) 95.9± 9.9 98.0± 11.9 0.447 Smoker, n (%) 2 (14.3%) 4 (22.2%) 0.909 Drinker, n (%) 8 (57.1%) 9 (50.0%) 0.964 SBP (mmHg) 142± 24 143± 20 0.894 DBP (mmHg) 91± 11 97± 11 0.098 Hypertension, n (%) 12 (78.6%) 16 (88.9%) 0.788 T-CHO (mg/dL) 210.4± 43.4 216.8± 45.2 0.447 TG (mg/dL) 154.9± 95.3 159.3± 124.3 0.849 HDL-C (mg/dL) 61.9± 13.0 57.6± 11.7 0.333 LDL-C (mg/dL) 128.9± 37.6 136.1± 45.9 0.531 Dyslipidemia, n (%) 11 (78.6%) 9 (50.0%) 0.198 FPG (mg/dL) 113.4± 35.0 107.1± 13.5 0.733 HbA1c (%) 6.2± 0.9 5.9± 0.4 0.608 IGT, n (%) 5 (35.7%) 6 (33.3%) 0.815 UA (mg/dL) 6.2± 1.1 5.8± 1.9 0.323 AST (IU/L) 23.2± 6.3 37.1± 11.3 < 0.001 GGT (IU/L) 73.8± 136.3 117.9± 109.9 < 0.05 HOMA-IR 1.37± 0.68 2.14± 1.22 < 0.05 NAFIC score 0.00± 0.00 0.78± 0.94 < 0.005 FIB-4 index 1.24± 0.46 1.29± 0.43 0.536
Data represent the mean± standard deviation (SD) and number for categorical variables. All p-values are based on the χ2-test or Mann-Whitney U-test. Significant is at the 5% level.
ALT, alanine aminotransferase; AST, aspartate aminotransferase; BMI, body mass index; DBP, diastolic blood pressure; F, female; FPG, fasting plasma glucose; GGT, gamma-glutamyl transpeptidase; HbA1c, hemoglobin A1c; HDL-C, high-density lipoprotein cholesterol; HOMA-IR, homeostasis model assessment of insulin resistance; IGT, impaired glucose tolerance; LDL-C, low-density lipoprotein cholesterol; M, male; MS, metabolic syndrome; NAFLD, nonalcoholic fatty liver disease; SBP, systolic blood pressure; T-CHO, total cholesterol; TG, triglyceride; UA, uric acid; WC, waist circumference. Drinkers: < 20 g/day of alcohol in male; < 10 g/day of alcohol in female.
Table 5. Comparison of 52 metabolites between subjects with and without NAFLD having elevation of ALT in 32 subjects with MS.
Compound name Relative area
Subjects without NAFLD having elevation of ALT (n = 14)
Subjects with NAFLD having elevation of ALT (n = 18)
p-value
Mean SD Mean SD
Cystine 1.082E-03 2.017E-04 1.028E-03 1.389E-04 0.640
Asparagine 7.745E-05 3.984E-05 8.506E-05 3.484E-05 0.536
Aspartic acid 4.126E-04 1.326E-04 4.189E-04 8.649E-05 0.750
Serine 7.230E-04 1.622E-04 7.298E-04 1.319E-04 0.808
Alanine 1.947E-02 6.607E-03 2.286E-02 4.579E-03 0.116
4-Hydroxyproline 3.433E-04 1.358E-04 4.301E-04 1.588E-04 0.206
Glycine 4.413E-04 9.391E-05 4.494E-04 8.944E-05 0.750
Citicoline 7.903E-06 1.404E-05 1.063E-05 1.979E-05 0.911
Glutamine 2.953E-02 3.410E-03 3.088E-02 4.163E-03 0.377
Threonine 3.439E-03 7.568E-04 3.491E-03 8.851E-04 0.837
Dimethylglycine 4.708E-03 1.097E-03 4.651E-03 8.881E-04 0.750
Methionine sulfoxide 1.046E-04 4.747E-05 9.511E-05 3.397E-05 0.319
Glutamic acid 3.490E-03 1.746E-03 3.623E-03 1.366E-03 0.694
Citrulline 7.294E-03 1.317E-03 6.693E-03 8.798E-04 0.135
Guanosine 3.967E-06 1.484E-05 2.479E-07 1.052E-06 0.851
monophosphate
Proline 2.485E-01 4.956E-02 2.753E-01 8.652E-02 0.442
Ornithine 4.251E-03 1.102E-03 4.110E-03 9.098E-04 0.750
2-Aminobutyric acid 1.918E-02 5.096E-03 2.011E-02 7.018E-03 0.955
Lysine 3.186E-02 3.671E-03 3.258E-02 4.485E-03 0.694
Histidine 9.708E-03 1.656E-03 1.042E-02 1.969E-03 0.420
Adenosine 4.911E-04 2.127E-04 6.759E-04 3.769E-04 0.206
monophosphate
Uracil 3.357E-04 1.014E-04 3.380E-04 1.211E-04 0.925
Argininosuccinic acid 4.759E-06 1.781E-05 1.811E-06 5.311E-06 0.792
Thymidine 3.525E-04 3.950E-05 3.977E-04 7.492E-05 0.125
monophosphate
Arginine 5.495E-02 1.148E-02 5.614E-02 9.900E-03 0.512
Creatine 3.491E-02 1.206E-02 3.948E-02 1.639E-02 0.587
Cytosine 2.301E-05 3.634E-05 1.278E-05 1.807E-05 0.606
Hypoxanthine 6.302E-04 1.968E-04 5.695E-04 2.767E-04 0.357
Uridine 5.871E-03 1.262E-03 6.104E-03 1.281E-03 0.377
Niacinamide 2.860E-04 1.064E-04 3.877E-04 1.284E-04 < 0.05
Adenosine 3’,5’-cyclic 1.437E-05 2.063E-05 1.015E-05 2.065E-05 0.638
monophosphate
Guanosine 0 NA 6.817E-06 1.730E-05 0.165
Inosine 0 NA 2.646E-05 4.495E-05 < 0.05
Pantothenic acid 1.674E-04 8.621E-05 1.582E-04 7.059E-05 0.955
Adenine 4.656E-05 3.952E-05 4.169E-05 2.024E-05 0.849
Tyrosine 8.111E-02 1.878E-02 8.979E-02 1.276E-02 0.235
Adenosine 8.633E-06 1.771E-05 1.784E-05 3.288E-05 0.582
Epinephrine 9.644E-05 3.229E-05 9.507E-05 2.436E-05 0.985
Asymmetric 2.457E-06 9.195E-06 0 NA 0.415
dimethylarginine
Non-MS. Additionally, there were significant differences in levels of several metabolites between subjects with and without NAFLD having elevation of ALT in spite of the subjects who belong to same MS. To our knowledge, ours is the first study to clarify the differences in subjects with
Table 5. (Continued)
Compound name Relative area
Subjects without NAFLD having elevation of ALT (n = 14)
Subjects with NAFLD having elevation of ALT (n = 18)
p-value
Mean SD Mean SD
Phenylalanine 7.267E-01 9.136E-02 7.492E-01 7.121E-02 0.267
Kynurenine 4.298E-03 8.353E-04 4.559E-03 9.591E-04 0.808
Acetyl-L-carnitine 1.013E-01 1.947E-02 8.699E-02 1.874E-02 < 0.05
Tryptophan 2.859E-01 5.521E-02 2.990E-01 4.335E-02 0.357
2-Ketoglutaric acid 3.563E-04 1.234E-04 3.979E-04 8.680E-05 0.091
Malic acid 5.997E-04 1.276E-04 6.457E-04 1.697E-04 0.640
Isocitric acid 3.879E-03 8.329E-04 4.398E-03 7.126E-04 0.067
Pyruvic acid 1.951E-04 1.178E-04 2.225E-04 1.234E-04 0.362
Lactic acid 1.959E-02 5.195E-03 1.832E-02 4.893E-03 0.442
Uric acid 1.208E-02 1.914E-03 1.146E-02 2.774E-03 0.536
Citric acid 4.857E-02 5.312E-03 5.251E-02 5.954E-03 0.107
Succinic acid 2.037E-04 1.572E-04 1.987E-04 1.424E-04 1.000
Xanthine 1.058E-05 2.699E-05 7.473E-05 2.926E-04 0.675
P-value is based on Mann-Whitney U-test. Significant is at the 5% level. Peak areas of individual metabolites were normalized against the peak area of the internal standards, and the resulting values were represented as relative areas.
ALT, alanine aminotransferase; MS, metabolic syndrome; NA, not applicable; NAFLD, nonalcoholic fatty liver disease, NS, not significant; SD, standard deviation.
https://doi.org/10.1371/journal.pone.0238388.t005
Table 6. Spearman rank coefficients for clinical parameters and metabolites those showed a statistically significant difference between subjects with and without NAFLD having elevation of ALT in MS.
Niacinamide Inosine Acetylcarnitine
BMI -0.001 0.181 -0.016 WC -0.082 0.182 -0.027 Hypertension -0.021 0.180 0.113 Dyslipidemia -0.091 -0.227 0.189 IGT -0.132 -0.173 0.445� ALT 0.368� 0.374� -0.252 AST 0.302 0.253 -0.259 GGT 0.151 -0.276 -0.079 UA -0.133 -0.018 0.101 HOMA-IR 0.269 0.472�� -0.222 NAFIC score 0.350� 0.189 -0.207 FIB-4 index 0.120 0.060 -0.310 Fatty liver 0.113 0.229 0.113
NAFLD with elevation of ALT 0.368� 0.421� -0.355�
�p < 0.05 ��p < 0.01.
ALT, alanine aminotransferase; AST, aspartate aminotransferase; BMI, body mass index; GGT, gamma-glutamyl transpeptidase; HOMA-IR: homeostasis model assessment of insulin resistance; IGT, impaired glucose tolerance; MS, metabolic syndrome; NAFLD, nonalcoholic fatty liver disease; UA, uric acid; WC, waist circumference.
NAFLD having elevation of ALT at various stage of MS, as well as measuring differences in metabolites with respect to NAFLD having elevation of ALT in the context of medical check-ups.
We demonstrated that values of physical measurements such as BMI and WC, and almost factors related to hypertension, dyslipidemia, and IGT were progressively greater in the Non-MS, Pre-Non-MS, MS groups, in accordance with previous reports that BMI, WC, blood pressure, HOMA-IR, and others increased with the number of MS components [17–19]. Liver enzymes such as ALT and AST, and the prevalence of NAFLD and NAFLD having elevation of ALT increased with progression from Non-MS to Pre-MS to MS. These results suggest that the onset of NAFLD and elevation of liver enzyme were strongly associated with MS components such as obesity, including visceral fat and lifestyle-related diseases. Furthermore, the prevalence of NAFLD and NAFLD having elevation of ALT among subjects except the MS group were 25.3% and 8.4%, respectively. This prevalence was not low, and we cannot ignore this fact.
We showed that independent predictors of NAFLD having elevation of ALT varied among Non-MS, Pre-MS, and MS groups. The prevalence of dyslipidemia and IGT in the Non-MS group was lower than that of the MS group; however, LDL, HbA1c, and UA were significant factors of NAFLD having elevation of ALT in the Non-MS group. These results suggest that, even in non-obese individuals, paying attention to dyslipidemia and IGT is necessary. Hyper-uricemia is associated with an elevated risk of developing impaired fasting glucose [20]. IGT due to insulin resistance may lead to hyperinsulinemia, which increases uric acid concentra-tions by reducing renal uric acid secretion and accumulating substrates for uric acid produc-tion [21,22]. Hyperuricemia was reported to be associated with histological liver damage in
Table 7. Comparison of 17 sulfur metabolites between subjects with and without NAFLD having elevation of ALT in 32 subjects with MS.
Compound name Relative area
Subjects without NAFLD having elevation of ALT (n = 14)
Subjects with NAFLD having elevation of ALT (n = 18)
p-value
Mean SD Mean SD
Glucose 2.52E-03 4.43E-04 2.49E-03 4.61E-04 0.896
Methionine 7.67E-04 2.27E-04 8.10E-04 3.58E-04 0.640
Serine 0 NA 2.83E-04 1.20E-03 0.526
Histidine 6.06E-03 9.06E-04 5.94E-03 1.16E-03 0.694
Cys-bimane 1.37E-03 1.80E-04 1.51E-03 4.48E-04 0.613
Cys-S-bimane 1.18E-03 3.86E-04 1.06E-03 4.41E-04 0.283
GS-bimane 7.00E-05 5.69E-05 6.70E-05 5.60E-05 0.675
GS-S-bimane 3.47E-06 1.30E-05 1.79E-06 7.60E-06 0.851
Sulfite-bimane 1.69E-04 2.18E-04 1.26E-04 5.67E-05 0.955
SDB 8.70E-03 5.58E-03 8.67E-03 3.77E-03 0.319
Thiosulfate-bimane 2.59E-02 1.43E-02 2.52E-02 1.36E-02 0.955
Ergothioneine-bimane 2.30E-02 9.88E-03 2.43E-02 1.11E-02 0.750
Cystathionine 3.88E-04 8.51E-05 3.99E-04 8.46E-05 0.925
GSSG [M+2H]2+ 3.10E-05 3.20E-05 2.85E-05 3.33E-05 0.877
Ergothioneine 3.68E-05 1.38E-04 0 NA 0.415
S-sulfocysteine 1.98E-06 5.23E-06 0 NA 0.177
Lactic acid 1.17E-02 3.02E-03 1.17E-02 3.10E-03 0.894
P-value is based on Mann-Whitney U-test. Significant is at the 5% level. Peak areas of individual metabolites were normalized against the peak area of the internal
standards, and the resulting values were represented as relative areas.
ALT, alanine aminotransferase; Cys, cysteine; GS, glutathione; GSSG [M+2H]2+, glutathione oxide sulfide; MS, metabolic syndrome; NA, not applicable; NAFLD, nonalcoholic fatty liver disease; NS, not significant; S, sulfide; SD, standard deviation; SDB, sulfide dibimane.
patients with NAFLD [23]. These findings suggest that our study might indicate that not only HbA1c but also UA are significant risk factors for NAFLD having elevation of ALT in the Non-MS group.
In the MS group, IGT was a significant independent predictor of an increase prevalence of NAFLD having elevation of ALT in accordance with previous reports that DM and insulin resistance are associated with NAFLD [24,25]. Obesity and visceral adipose tissue are risk fac-tors for insulin resistance. In particular, excessive visceral fat accumulation releases various bioactive substances known as inflammatory adipokines, include interleukin-6, tumor necrosis factor-α, macrophage chemoattractant protein-1, and resistin [26,27]. Therefore, visceral fat accumulation is thought to play an important role in the development of NAFLD [28–33]. These findings support our result that the prevalence of NAFLD and NAFLD having elevation of ALT in MS group were higher than in other groups.
Conversely, HDL-C was a significant independent predictor of decreased risk for NAFLD having elevation of ALT in the Non-MS and MS groups. Levels of TG, IGT, and HDL-C were significantly different between subjects with and without NAFLD having elevation of ALT in the Non-MS and MS groups. NAFLD is strongly associated with dyslipidemia, including decreased HDL-C levels and increased TG levels [34,35]. TG is synthesized from free fatty acids. Excess energy, decreased lipolysis in adipose tissue, increased lipogenesis in the liver, and insulin resistance that suppresses lipolysis and increases de novo lipogenesis may induce increased free fatty acid levels [36–38]. The main component of very low-density lipoprotein (VLDL) in liver is TG, and increased VLDL and IGT in diabetes causes decreased HDL-C lev-els [39]. Therefore, our study might show that HDL is a significant independent predictor of decreased prevalence of NAFLD having elevation of ALT.
In the Pre-MS group, hypertension was a significant independent predictor of decreased prevalence of NAFLD having elevation of ALT. However, there was no significant difference in the prevalence of NAFLD having elevation of ALT between subjects without hypertension and subjects having hypertension without medication. In recent reports, angiotensin II recep-tor blockers may suppress liver fibrosis with NAFLD including non-alcoholic steatohepatitis [40–42]. Our results might be affected by use of antihypertensive agents. Further studies are needed to elucidate the association between NAFLD and antihypertensive agents because we did not investigate the type of antihypertensive agents.
Metabolomics involves the measurement of large numbers of low-molecular-weight metabolites, including sugars, amino acids, and hormones. Although several studies have provided insight into the pathogenesis of NAFLD [43–46], to date, no specific biomarker that could identify NAFLD has been found using metabolomics. We found that the levels of metabolites such as inosine and nicotinamide were significantly higher in subjects with NAFLD having elevation of ALT than those in subjects without NAFLD having elevation of ALT. Inosine is found in meat and is an organic compound with a nucleoside-like structure. Consuming large amounts of food containing inosine may increase uric acid levels because inosine is metabolized to uric acid. The elevation of uric acid levels is associated with NAFLD in several cohort studies [47,48]. Nicotinamide is a B-complex vitamin that partici-pates in energy production and metabolism of sugar, lipids, and proteins as a coenzyme of dehydrogenase. High dietary intake of nicotinamide is unfavorable because the accumula-tion of nicotinamide may cause liver dysfuncaccumula-tion [49]. This suggests that elevated serum lev-els of inosine and nicotinamide may be associated with NAFLD. Conversely, acetyl-L-carnitine levels were significantly lower in subjects with NAFLD having elevation of ALT than those in subjects without NAFLD having elevation of ALT in our study. Acetyl-L-carni-tine is an acetylated derivative of L-carniAcetyl-L-carni-tine that participates in oxidative metabolism. Decreased L-carnitine levels were associated with insulin resistance and L-carnitine
supplementation in rats and mice improved metabolic function and NAFLD [50,51]. Our findings suggest that lower levels of acetyl-L-carnitine may be associated with NAFLD. Recently, reactive sulfur species (RSS) have been recognized to be endogenously produced in abundance in many species [52,53]. They occur in diverse polysulfide forms with unique redox-active or reactive chemical properties [54–56]. Sulfur metabolomics was developed to investigate the sulfur metabolic pathways associated with RSS [52,53,57]. Although there was no sulfur metabolite that showed statistically significantly different levels between sub-jects with and without NAFLD having elevation of ALT in our study, the additional results showed that there was a tendency of difference in levels of S-sulfocysteine between subjects having NAFLD with normal ALT levels and those having NAFLD with elevation of ALT lev-els (p = 0.072,S1 Table). Although the influence of S-sulfocysteine on the liver is unclear, there is a possibility that sulfites and its derivatives induce oxidative stress [58,59] and dis-turb mitochondrial function in rat experiments [60,61]. Metabolomics in our study identi-fied three metabolites that were significantly correlated with NAFLD having elevation of ALT, and one sulfur metabolite had the possibility of differentiating between subjects having NAFLD with elevation of ALT levels and those having NAFLD with normal ALT levels. These results suggest that metabolomics may become a useful screening test for NAFLD in individuals with MS during medical check-ups in the future.
Although the HOMA-IR and NAFIC scores effectively discriminated between subjects with and without NAFLD having elevation of ALT in our study, they were within the range of nor-mal in almost all subjects. Therefore, not only persons whose HOMA-IR or NAFIC scores are high but also those whose HOMA-IR or NAFIC scores are within standard values should be carefully assessed during medical check-ups.
The present study had several limitations. First, it was a single-center study, and therefore may be subject to selection bias. For this reason, we instituted strict inclusion and exclusion criteria. Multi-center studies are needed to validate our findings. Second, different results may be found in patients who go to the hospital for NAFLD and those who are found to have NAFLD during medical check-ups because most of the participants in the present study were healthy individuals without symptoms. Further investigations of the differences between these groups are required. Third, we did not obtain information regarding treatments for hyperten-sion and DM, diets (e.g., volume and contents including vegetable and fruits), and total caloric intake. Finally, the number of subjects who were investigated regarding metabolomics was small because metabolomics is not usually included in medical check-ups. Further studies are necessary to resolve these limitations.
In conclusion, we demonstrated that the prevalence of NAFLD having elevation of ALT was progressively higher in Non-MS, Pre-MS and MS groups. Significant independent predic-tors for NAFLD having elevation of ALT were different among the three groups. Not only liver scoring systems such as the HOMA-IR and NAFIC score but also several metabolites may help identify the risk of NAFLD in individuals with MS.
Supporting information
S1 Checklist.
(DOC)
S1 Table. Comparison of 17 sulfur metabolites between subjects with NAFLD having eleva-tion of ALT and subjects with NAFLD having standard values of ALT in 26 subjects with MS.
Acknowledgments
The authors would like to thank all subjects in our study.
Author Contributions
Conceptualization: Masahiro Sogabe, Masahiko Nakasono.
Data curation: Masahiro Sogabe, Takeshi Kurihara, Masanori Takehara, Kaizo Kagemoto,
Jun Okazaki.
Formal analysis: Masahiro Sogabe, Yoshifumi Kida, Akihiro Hirao, Hironori Tanaka. Investigation: Masahiro Sogabe, Tetsu Tomonari, Tatsuya Taniguchi.
Methodology: Masahiro Sogabe, Masahiko Nakasono. Project administration: Masahiro Sogabe, Toshiya Okahisa. Supervision: Masahiro Sogabe, Toshiya Okahisa, Tetsuji Takayama. Validation: Masahiro Sogabe.
Visualization: Koichi Okamoto.
Writing – original draft: Masahiro Sogabe.
Writing – review & editing: Masahiro Sogabe, Tetsuji Takayama.
References
1. Caballeria L, Auladell MA, Toran P, Miranda D, Aznar J, Pera G, et al. Prevalence and factors associ-ated with the presence of nonalcoholic fatty liver disease in an apparently healthy adult population in pri-mary care units. BMC Gastroenterol. 2007 Nov; 5(7):41.
2. Amarapurkar DN, Hashimoto E, Lesmana LA, Sollano JD, Chen PJ, Goh KL. How common is non-alco-holic fatty liver disease in the Asia-Pacific region and are there local differences? J Gastroenterol Hepa-tol. 2007 Jun; 22(6):788–93.https://doi.org/10.1111/j.1440-1746.2007.05042.xPMID:17565631
3. Hamaguchi M, Kojima T, Takeda N, Nakagawa T, Taniguchi H, Fujii K, et al. The metabolic syndrome as a predictor of nonalcoholic fatty liver disease. Ann Intern Med. 2005 Nov 15; 143(10):722–8.https:// doi.org/10.7326/0003-4819-143-10-200511150-00009PMID:16287793
4. Nishioji K, Sumida Y, Kamaguchi M, Mochizuki N, Kobayashi M, Nishimura T, et al. Prevalence of and risk factors for non-alcoholic fatty liver disease in a non-obese Japanese population, 2011–2012. J Gas-troenterol. 2015 Jan; 50(1):95–108.https://doi.org/10.1007/s00535-014-0948-9PMID:24619537
5. Eguchi Y, Hyogo H, Ono M, Mizuta T, Ono N, Fujimoto K, et al. Prevalence and associated metabolic factors of nonalcoholic fatty liver disease in the general population from 2009 to 2010 in Japan: a multi-center large retrospective study. J Gastroenterol. 2012 May; 47(5):586–95.https://doi.org/10.1007/ s00535-012-0533-zPMID:22328022
6. Natarajan Y, Kramer JR, Yu X, Li L, Thrift AP, El-Serag HB, et al. Risk of Cirrhosis and Hepatocellular Cancer in Patients with Non-Alcoholic Fatty Liver Disease and Normal Liver Enzymes. Hepatology. 2020 Feb 5.https://doi.org/10.1002/hep.31157PMID:32022277
7. The Examination Committee of Criteria for Metabolic Syndrome. The definition and criteria of metabolic syndrome. J Jpn Soc Intern Med. 2005; 94:794–809.
8. Isokuortti E, Zhou Y, Peltonen M, Bugianesi E, Clement K, Bonnefont-Rousselot D, et al. Use of HOMA-IR to diagnose non-alcoholic fatty liver disease: a population-based and inter-laboratory study. Diabetologia. 2017 Oct; 60(10):1873–82.https://doi.org/10.1007/s00125-017-4340-1PMID:28660493
9. European Association for the Study of the Liver (EASL), European Association for the Study of Diabetes (EASD), European Association for the Study of Obesity (EASO) (2016) EASLEASD-EASO clinical practice guidelines for the management of non-alcoholic fatty liver disease. Diabetologia. 2016 Jun; 59 (6):1121–40.https://doi.org/10.1007/s00125-016-3902-yPMID:27053230
10. Sumida Y, Yoneda M, Hyogo H, Yamaguchi K, Ono M, Fujii H, et al. A simple clinical scoring system using ferritin, fasting insulin, and type IV collagen 7S for predicting steatohepatitis in nonalcoholic fatty
liver disease. J Gastroenterol. 2011 Feb; 46(2):257–68.https://doi.org/10.1007/s00535-010-0305-6 PMID:20842510
11. Sumida Y, Yoneda M, Hyogo H, Itoh Y, Ono M, Fujii H, et al. Validation of the FIB4 index in a Japanese nonalcoholic fatty liver disease population. BMC Gastroenterol. 2012 Jan 5; 12:2.https://doi.org/10. 1186/1471-230X-12-2PMID:22221544
12. Sun W, Cui H, Li N, Wei Y, Lai S, Yang Y, et al. Comparison of FIB-4 index, NAFLD fibrosis score and BARD score for prediction of advanced fibrosis in adult patients with non-alcoholic fatty liver disease: A meta-analysis study. Hepatol Res. 2016 Aug; 46(9):862–70.https://doi.org/10.1111/hepr.12647PMID: 26763834
13. Saadeh S, Younossi ZM, Remer EM, Gramlich T, Ong JP, Hurley M, et al. The utility of radiological imaging in nonalcoholic fatty liver disease. Gastroenterology. 2002 Sep; 123(3):745–50.https://doi.org/ 10.1053/gast.2002.35354PMID:12198701
14. Hamaguchi M, Kojima T, Itoh Y, Harano Y, Fujii K, Nakajima T, et al. The severity of ultrasonographic findings in nonalcoholic fatty liver disease reflects the metabolic syndrome and visceral fat accumula-tion. Am J Gastroenterol. 2007 Dec; 102(12):2708–15.https://doi.org/10.1111/j.1572-0241.2007. 01526.xPMID:17894848
15. Kawano Y, Ohtsu I, Tamakoshi A, Shiroyama M, Tsuruoka A, Saiki K, et al. Involvement of the yciW gene in l-cysteine and l-methionine metabolism in Escherichia coli. J Biosci Bioeng. 2015 Mar; 119 (3):310–3.https://doi.org/10.1016/j.jbiosc.2014.08.012PMID:25277519
16. Kawano Y, Onishi F, Shiroyama M, Miura M, Tanaka N, Oshiro S, et al. Improved fermentative L-cyste-ine overproduction by enhancing a newly identified thiosulfate assimilation pathway in Escherichia coli. Appl Microbiol Biotechnol. 2017 Sep; 101(18):6879–89.https://doi.org/10.1007/s00253-017-8420-4 PMID:28756590
17. Golabi P, Otgonsuren M, de Avila L, Sayiner M, Rafiq N, Younossi ZM. Components of metabolic syn-drome increase the risk of mortality in nonalcoholic fatty liver disease (NAFLD). Medicine (Baltimore). 2018 Mar; 97(13):e0214.https://doi.org/10.1097/MD.0000000000010214PMID:29595666
18. Grundy SM, Brewer HB Jr, Cleeman JI, Smith SC Jr, Lenfant C; American Heart Association; National Heart, Lung, and Blood Institute. Definition of metabolic syndrome: Report of the National Heart, Lung, and Blood Institute/American Heart Association conference on scientific issues related to definition. Cir-culation. 2004 Jan 27; 109(3):433–8.https://doi.org/10.1161/01.CIR.0000111245.75752.C6PMID: 14744958
19. Eckel RH, Alberti KG, Grundy SM, Zimmet PZ. The metabolic syndrome. Lancet. 2010 Jan 16; 375 (9710):181–3.https://doi.org/10.1016/S0140-6736(09)61794-3PMID:20109902
20. Miyake T, Kumagi T, Furukawa S, Hirooka M, Kawasaki K, Koizumi M, et al. Hyperuricemia is a risk fac-tor for the onset of impaired fasting glucose in men with a high plasma glucose level: a community-based study. PLoS One. 2014 Sep 19; 9(9):e107882.https://doi.org/10.1371/journal.pone.0107882 PMID:25237894
21. Quiñones Galvan A, Natali A, Baldi S, Frascerra S, Sanna G, Ciociaro D, et al. Effect of insulin on uric acid excretion in humans. Am J Physiol. 1995 Jan; 268(1 Pt 1):E1–5.https://doi.org/10.1152/ajpendo. 1995.268.1.E1PMID:7840165
22. Johnson RJ, Perez-Pozo SE, Sautin YY, Manitius J, Sanchez-Lozada LG, Feig DI, et al. Hypothesis: could excessive fructose intake and uric acid cause type 2 diabetes? Endocr Rev. 2009 Feb; 30(1):96– 116.https://doi.org/10.1210/er.2008-0033PMID:19151107
23. Petta S, CammàC, Cabibi D, Di Marco V, Craxı` A. Hyperuricemia is associated with histological liver damage in patients with non-alcoholic fatty liver disease. Aliment Pharmacol Ther. 2011 Oct; 34 (7):757–66.https://doi.org/10.1111/j.1365-2036.2011.04788.xPMID:21790685
24. Nakahara T, Hyogo H, Yoneda M, Sumida Y, Eguchi Y, Fujii H, et al; Japan Study Group of Nonalco-holic Fatty Liver Disease. Type 2 diabetes mellitus is associated with the fibrosis severity in patients with nonalcoholic fatty liver disease in a large retrospective cohort of Japanese patients. J Gastroen-terol. 2014 Nov; 49(11):1477–84.https://doi.org/10.1007/s00535-013-0911-1PMID:24277052
25. Aller R, Sigu¨enza R, Pina M, Laserna C, Antolı´n B, Burgueño B, et al. Insulin resistance is related with liver fibrosis in type 2 diabetic patients with non-alcoholic fatty liver disease proven biopsy and Mediter-ranean diet pattern as a protective factor. Endocrine. 2020 Apr 1. https://doi.org/10.1007/s12020-020-02268-7[Epub ahead of print] PMID:32239453
26. Moon HU, Ha KH, Han SJ, Kim HJ, Kim DJ. The Association of Adiponectin and Visceral Fat with Insulin Resistance andβ-Cell Dysfunction. J Korean Med Sci. 2018 Dec 26; 34(1):e7.https://doi.org/10.3346/ jkms.2019.34.e7PMID:30618514
27. Kahn SE, Hull RL, Utzschneider KM. Mechanisms linking obesity to insulin resistance and type 2 diabe-tes. Nature. 2006 Dec 14; 444(7121):840–6.https://doi.org/10.1038/nature05482PMID:17167471
28. Sogabe M, Okahisa T, Hibino S, Yamanoi A. Usefulness of differentiating metabolic syndrome into vis-ceral fat type and subcutaneous fat type using ultrasonography in Japanese males. J Gastroenterol. 2012 Mar; 47(3):293–9https://doi.org/10.1007/s00535-011-0489-4PMID:22065161
29. Eguchi Y, Eguchi T, Mizuta T, Ide Y, Yasutake T, Iwakiri R, et al. Visceral fat accumulation and insulin resistance are important factors in nonalcoholic fatty liver disease. J Gastroenterol. 2006 May; 41 (5):462–9.https://doi.org/10.1007/s00535-006-1790-5PMID:16799888
30. Koda M, Kawakami M, Murawaki Y, Senda M. The impact of visceral fat in nonalcoholic fatty liver dis-ease: cross-sectional and longitudinal studies. J Gastroenterol. 2007 Nov; 42(11):897–903.https://doi. org/10.1007/s00535-007-2107-zPMID:18008034
31. Browning JD, Horton JD. Molecular mediators of hepatic steatosis and liver injury. J Clin Invest. 2004 Jul; 114(2):147–52.https://doi.org/10.1172/JCI22422PMID:15254578
32. Schaffler A, Scholmerich J, Buchler C. Mechanisms of disease: adipocytokines and visceral adipose tis-sue: emerging role in nonalcoholic fatty liver disease. Nat Clin Pract Gastroenterol Hepatol. 2005 Jun; 2 (6):273–80.https://doi.org/10.1038/ncpgasthep0186PMID:16265231
33. Stranges S, Dorn JM, Muti P, Freudenheim JL, Farinaro E, Russell M, et al. Body fat distribution, rela-tive weight, and liver enzyme levels: a population-based study. Hepatology. 2004 Mar; 39(3):754–63. https://doi.org/10.1002/hep.20149PMID:14999694
34. Speliotes EK, Massaro JM, Hoffmann U, Vasan RS, Meigs JB, Sahani DV, et al. Fatty liver is associated with dyslipidemia and dysglycemia independent of visceral fat: the Framingham Heart Study. Hepatol-ogy. 2010 Jun; 51(6):1979–87.https://doi.org/10.1002/hep.23593PMID:20336705
35. Tomizawa M, Kawanabe Y, Shinozaki F, Sato S, Motoyoshi Y, Sugiyama T, et al. Triglyceride is strongly associated with nonalcoholic fatty liver disease among markers of hyperlipidemia and diabetes. Biomed Rep. 2014 Sep; 2(5):633–636.https://doi.org/10.3892/br.2014.309PMID:25054002
36. Donnelly KL, Smith CI, Schwarzenberg SJ, Jessurun J, Boldt MD, Parks EJ. Sources of fatty acids stored in liver and secreted via lipoproteins in patients with nonalcoholic fatty liver disease. J Clin Invest. 2005 May; 115(5):1343–51.https://doi.org/10.1172/JCI23621PMID:15864352
37. Sanyal AJ, Campbell-Sargent C, Mirshahi F, Rizzo WB, Contos MJ, Sterling RK, et al. Nonalcoholic steatohepatitis: association of insulin resistance and mitochondrial abnormalities. Gastroenterology. 2001 Apr; 120(5):1183–92.https://doi.org/10.1053/gast.2001.23256PMID:11266382
38. Lambert JE, Ramos-Roman MA, Browning JD, Parks EJ. Increased de novo lipogenesis is a distinct characteristic of individuals with nonalcoholic fatty liver disease. Gastroenterology. 2014 Mar; 146 (3):726–35.https://doi.org/10.1053/j.gastro.2013.11.049PMID:24316260
39. Fukuda Y, Hashimoto Y, Hamaguchi M, Fukuda T, Nakamura N, Ohbora A, et al. Triglycerides to high-density lipoprotein cholesterol ratio is an independent predictor of incident fatty liver; a population-based cohort study. Liver Int. 2016 May; 36(5):713–20.https://doi.org/10.1111/liv.12977PMID: 26444696
40. Yokohama S, Yoneda M, Haneda M, Okamoto S, Okada M, Aso K, et al. Therapeutic efficacy of an angiotensin II receptor antagonist in patients with nonalcoholic steatohepatitis. Hepatology. 2004 Nov; 40(5):1222–5.https://doi.org/10.1002/hep.20420PMID:15382153
41. Georgescu EF, Ionescu R, Niculescu M, Mogoanta L, Vancica L. Angiotensin-receptor blockers as ther-apy for mild-to-moderate hypertension-associated non-alcoholic steatohepatitis. World J Gastroenterol. 2009 Feb 28; 15(8):942–54.https://doi.org/10.3748/wjg.15.942PMID:19248193
42. Sawada Y, Kawaratani H, Kubo T, Fujinaga Y, Furukawa M, Saikawa S, et al. Combining probiotics and an angiotensin-II type 1 receptor blocker has beneficial effects on hepatic fibrogenesis in a rat model of non-alcoholic steatohepatitis. Hepatol Res. 2019 Mar; 49(3):284–295.https://doi.org/10.1111/hepr. 13281PMID:30365236
43. Khusial RD, Cioffi CE, Caltharp SA, Krasinskas AM, Alazraki A, Knight-Scott J, et al. Development of a Plasma Screening Panel for Pediatric Nonalcoholic Fatty Liver Disease Using Metabolomics. Hepatol Commun. 2019 Aug 13; 3(10):1311–21.https://doi.org/10.1002/hep4.1417PMID:31592078
44. Hartley A, Santos Ferreira DL, Anderson EL, Lawlor DA. Metabolic profiling of adolescent non-alcoholic fatty liver disease. Version 2. Wellcome Open Res. 2019 Sep 19 [revised 2019 Sep 19]; 3:166. 14974.2. eCollection 2018.https://doi.org/10.12688/wellcomeopenres.14974.2PMID:30687796
45. Tokushige K, Hashimoto E, Kodama K, Tobari M, Matsushita N, Kogiso T, et al. Serum metabolomic profile and potential biomarkers for severity of fibrosis in nonalcoholic fatty liver disease. J Gastroen-terol. 2013 Dec; 48(12):1392–400.https://doi.org/10.1007/s00535-013-0766-5PMID:23478936
46. Qi S, Huang S, Chen X, Huo Q, Xie N, Xia J. Liver tissue metabolic profiling and pathways of non-alco-holic steatohepatitis in rats. Hepatol Res. 2017 Dec; 47(13):1484–93.https://doi.org/10.1111/hepr. 12876PMID:28224688
47. Di Bonito P, Valerio G, Licenziati MR, Miraglia Del Giudice E, Baroni MG, Morandi A, et al. J Endocrinol Invest. 2020 Apr; 43(4):461–468.https://doi.org/10.1007/s40618-019-01130-6PMID:31637675
48. Klisic A, Kavaric N, Ninic A. Predictive Values of Serum Uric Acid and Alanine-aminotransferase for Fatty Liver Index in Montenegrin Population. J Med Biochem. 2019 Mar 26; 38(4):407–17.https://doi. org/10.2478/jomb-2019-0001PMID:31496904
49. Knip M, Douek IF, Moore WP, Gillmor HA, McLean AE, Bingley PJ, et al; European Nicotinamide Diabe-tes Intervention Trial Group. Safety of high-dose nicotinamide: a review. Diabetologia. 2000 Nov; 43 (11):1337–45.https://doi.org/10.1007/s001250051536PMID:11126400
50. Mollica G, Senesi P, Codella R, Vacante F, Montesano A, Luzi L, et al. L-carnitine supplementation attenuates NAFLD progression and cardiac dysfunction in a mouse model fed with methionine and cho-line-deficient diet. Dig Liver Dis. 2019 Oct 10. pii: S1590–8658(19)30792-3.
51. Salic K, Gart E, Seidel F, Verschuren L, Caspers M, van Duyvenvoorde W, et al. Combined Treatment with L-Carnitine and Nicotinamide Riboside Improves Hepatic Metabolism and Attenuates Obesity and Liver Steatosis. Int J Mol Sci. 2019 Sep 5; 20(18). pii: E4359.https://doi.org/10.3390/ijms20184359 PMID:31491949
52. Ida T, Sawa T, Ihara H, Tsuchiya Y, Watanabe Y, Kumagai Y, et al. Reactive cysteine persulfides and S-polythiolation regulate oxidative stress and redox signaling. Proc Natl Acad Sci U S A. 2014 May 27; 111(21):7606–11.https://doi.org/10.1073/pnas.1321232111PMID:24733942
53. Akaike T, Ida T, Wei FY, Nishida M, Kumagai Y, Alam MM, et al. Cysteinyl-tRNA synthetase governs cysteine polysulfidation and mitochondrial bioenergetics. Nat Commun. 2017 Oct 27; 8(1):1177.https:// doi.org/10.1038/s41467-017-01311-yPMID:29079736
54. Nishida M, Sawa T, Kitajima N, Ono K, Inoue H, Ihara H, et al. Hydrogen sulfide anion regulates redox signaling via electrophile sulfhydration. Nat Chem Biol. 2012 Aug; 8(8):714–24.https://doi.org/10.1038/ nchembio.1018PMID:22772154
55. Shimizu T, Shen J, Fang M, Zhang Y, Hori K, Trinidad JC, et al. Sulfide-responsive transcriptional repressor SqrR functions as a master regulator of sulfide-dependent photosynthesis. Proc Natl Acad Sci U S A. 2017 Feb 28; 114(9):2355–60.https://doi.org/10.1073/pnas.1614133114PMID:28196888
56. Fukuto JM, Ignarro LJ, Nagy P, Wink DA, Kevil CG, Feelisch M, et al. Biological hydropersulfides and related polysulfides—a new concept and perspective in redox biology. FEBS Lett. 2018 Jun; 592 (12):2140–52.https://doi.org/10.1002/1873-3468.13090PMID:29754415
57. Hamid HA, Tanaka A, Ida T, Nishimura A, Matsunaga T, Fujii S, et al. Polysulfide stabilization by tyro-sine and hydroxyphenyl-containing derivatives that is important for a reactive sulfur metabolomics anal-ysis. Redox Biol. 2019 Feb; 21:101096.https://doi.org/10.1016/j.redox.2019.101096PMID:30634125
58. Chiarani F, Bavaresco CS, Dutra-Filho CS, Netto CA, Wyse AT. Sulfite increases lipoperoxidation and decreases the activity of catalase in brain of rats. Metab Brain Dis. 2008 Mar; 23(1):123–32.https://doi. org/10.1007/s11011-007-9073-2PMID:18034293
59. Abedinzadeh Z. Sulfur-centered reactive intermediates derived from the oxidation of sulfur compounds of biological interest. Can J Physiol Pharmacol. 2001 Feb; 79(2):166–70. PMID:11233565
60. Zhang X, Vincent AS, Halliwell B, Wong KP. A mechanism of sulfite neurotoxicity: direct inhibition of glu-tamate dehydrogenase. J Biol Chem. 2004 Oct 8; 279(41):43035–45.https://doi.org/10.1074/jbc. M402759200PMID:15273247
61. Grings M, Moura AP, Parmeggiani B, Marcowich GF, Amaral AU, de Souza Wyse AT, et al. Disturbance of brain energy and redox homeostasis provoked by sulfite and thiosulfate: potential pathomechanisms involved in the neuropathology of sulfite oxidase deficiency. Gene. 2013 Dec 1; 531(2):191–8.https:// doi.org/10.1016/j.gene.2013.09.018PMID:24035933