Article
Shallow Velocity Structure Beneath the Aira Caldera and Sakurajima Volcano
as Inferred from Refraction Analysis of the Seismic Experiment in 2008
Hiroki M
IYAMACHI1), Chisato T
OMARI1), Hiroshi Y
AKIWARA1), Masato I
GUCHI2), Takeshi T
AMEGURI2),
Keigo Y
AMAMOTO2), Takahiro O
HKURA3), Takashi A
NDO3), Kyosuke O
NISHI4), Hiroshi S
HIMIZU5),
Yusuke Y
AMASHITA5), Haruhisa N
AKAMICHI6), Teruo Y
AMAWAKI7), Jun O
IKAWA8), Sadato U
EKI9),
Tomoki T
SUTSUI10), Hitoshi M
ORI11), Makoto N
ISHIDA12), Hideyuki H
IRAMATSU12),
Tomoyuki K
OEDA12), Yoshirou M
ASUDA12), Kouji K
ATOU12),
Kengo H
ATAKEYAMA12)and Tetsuo K
OBAYASHI1)(Received December 24, 2010; Accepted July 21, 2011)
We performed refraction analysis for the first P-wave arrival time data observed in the seismic experiment in 2008, and estimated a shallow velocity model up to 3 km depth beneath the Aira caldera and Sakurajima volcano. We found that a basement layer with a velocity of 4.6-5.0 km/s, which corresponds to geologically the Shimanto Group, inclines toward the central part of the Aira caldera. A low velocity zone with a velocity of 4.2-4.4 km/s is located in a depth range 1.5-3 km in the central part of the caldera. This low velocity zone suggests high activity of the magma plumbing system from the deep magma reservoir distributed beneath the caldera. It is found that the basement layer steeply falls down from 1 km to 2.5 km in depth along the northwestern boundary of the Kagoshima graben. The velocity structure in Sakurajima volcano is characterized by a zone with a velocity of 3.6-3.7 km/s. Moreover, we present a possibility that the underground structure strongly restricts an expanse of a focal region of each different type of the volcanic earthquakes.
Key words: Sakurajima, Aira caldera, velocity structure
1.Introduction
The Kagoshima bay occupies the southern part of Kagoshima graben (Tsuyuki, 1969). The Aira caldera, ap-proximately 20 km in diameter, is located at the northern end of the Kagoshima bay. As presented in Fig. 1, Sakura-jima volcano, located at the southern rim of the caldera, is well known to be one of the most active volcanoes in Japan .
Many geological investigations have been carried out in and around Sakurajima volcano. Kobayashi (1988a, b) de-scribed detailed geology of Sakurajima volcano, and pub-lished a geological map of the volcano. According to Hayasaka et al. (1978) and Aramaki (1984), the Cretaceous Shimanto Group, a basement composed of alternation of
strata of sandstone and mudstone, steeply inclines along the boundary of the Kagoshima graben and is considered to be located at a depth more than 1 km beneath Sakura-jima.
Yokoyama and Ohkawa (1986) carried out gravity measurements in the Aira caldera and showed the regional gravity anomaly distribution. Their result shows that the gravity basement beneath Sakurajima volcano is located at a depth of about 2.5 km. Miyamachi et al. (2000) pre-sented the detailed gravity anomaly distribution in Sakura-jima island from the high dense gravity measurements and estimated the location of a vent of “Satsuma (P14, Sz-S)”, which is the most voluminous pumice fall deposit from Sakurajima volcano (Kobayashi, 1988a). Komazawa et al.
Earthquake Research Institute, University of Tokyo. Graduate School of Science, Tohoku University. Faculty of Engineering and Resource Science, Akita Uni-versity.
Graduate School of Science, Hokkaido University. Japan Meteorological Agency.
Corresponding author: Hiroki Miyamachi e-mail: miya@sci.kagoshima-u.ac.jp 8) 9) 10) 11) 12) Graduate School of Science and Engineering, Kagoshima University, Korimoto 1, Kagoshima 890-0064, Japan. Disaster Prevention Research Institute, Kyoto University. Graduate School of Science, Kyoto University. Graduate School of Engineering, Kyoto University. Graduate School of Science, Kyushu University. Graduate School of Environmental Studies, Nagoya Uni-versity.
Volcanic Fluid Research Center, Tokyo Institute of Tech-nology. 1) 2) 3) 4) 5) 6) 7)
(2008) carried out gravity measurements in the remote area of Sakurajima and reported that the gravity basement is shallower than 1 km. They also suggested that there is magma chamber beneath the active crater of the Minami-dake in the north or east area of Sakurajima island.
Ishihara (1988) presented from geophysical studies that a magma reservoir was located at a depth range deeper than 3-4 km below sea level beneath the summit of Sakurajima volcano. Recently, Hidayati et al. (2007) studied volcanic and tectonic earthquakes and geodetic data observed in and around Sakurajima volcano, and proposed a hypothetical model on the magma supply system: two magma reservoirs are located at a depth of 5 km beneath Sakurajima volcano and 11 km at the center of the Aira caldera, respectively, and both the reservoirs are connected through a tensile fault.
Velocity structures in and around the active volcanoes in Japan have been investigated by means of artificial explosive sources, mainly by the National Project for the Prediction of Volcanic Eruption: for example, Usu volcano by Onizawa et al. (2007), Suwanosejima volcano by Yakiwara et al. (2009), Hokkaido Komagadake volcano by Onizawa et al. (2009), and Asama volcano by Aoki et al. (2009).
As mentioned above, images of the understructure of the Aira caldera and Sakurajima volcano have been presented by means of geological, gravity and/or geodetic data. However, it is necessary to increase spatial resolution of these models. In 2008, Iguchi et al. (2009) conducted a seismic experiment using artificial sources at Sakurajima volcano and the Aira caldera, in order to achieve three objectives: the first is to reveal the basement structure of the Aira caldera, the second is to detect magma supply system of magma reservoirs beneath the Aira caldera and Sakurajima volcano, and the third is to clarify magma path from the magma reservoir beneath the Aira caldera to that beneath Sakurajima volcano. In this study, we focus to accomplish the first objective, the shallow and basement velocity structure beneath Sakurajima volcano and the Aira caldera, by analyzing the first P-wave travel times observed in the seismic experiment.
2.Seismic experiment and data acquisition
Aseismic experiment, which was designed to obtain the seismic data for the 2-D refraction, 2-D reflection, and 3-D tomography analyses, was performed in and around Sakurajima volcano in 2008 (Iguchi et al., 2009). As shown in Fig. 1, 8 large explosive shots with more than 200 kg charges for the refraction profiles in and around the Aira caldera and 7 small explosive shots with 20 kg charges for the reflection profiles in Sakurajima Island were located. In the refraction profiles, 426 temporary seismic stations with a 2 Hz vertical seismometer in the land area and 32 Ocean Bottom Seismographs with a 4.5 Hz three-component seismometer in the sea area were
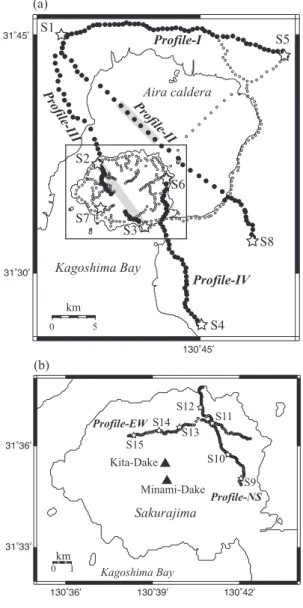
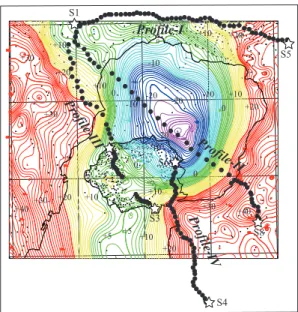
Fig. 1. Amap showing configuration of the shots and temporary seismic stations of the seismic experiment in 2008. (a) Configuration of refraction profiles from Profile-I to Profile-IV in and around the Aira caldera and Sakurajima Island. Stars are the shot locations. Solid and open circles are temporary seismic stations. Stations marked by solid circles are available for our refraction analysis in this study. Shaded rectangular areas on Profile-II and Profile-III indicate low velocity zones with a velocity of 4.2-4.4 km/s and 3.6-3.7 km/s revealed by this study, respectively. The rectangle enclosed by solid lines in the figure describes an area in (b). (b) Configuration of reflection profiles, Profile-NS and Profile-EW in Sakurajima Island.
installed. The station intervals were set to about 200 m in Sakurajima Island, about 450 m outside Sakurajima Island, and about 1 km in the sea area. Details of the experiment are given in Iguchi et al. (2009).
We manually picked the first P-wave arrivals of seismic waves digitally recorded by a 250 Hz sampling. Next, we classified the first arrivals into five ranks termed as A, B, C, L, and X, according to the accuracy of the picking, where A, B, C, and L refer to the ones with picking errors of less than 0. 01, 0. 01-0. 03, 0. 03-0. 1, and 0. 1-0. 2s, respectively, and X refers to the ones which were unable to be picked as first arrivals within 0.2s.
As shown in Fig. 1, we selected four profiles, Profile-I (S1-S5), Profile-II (S1-S8), Profile-III (S1-S2-S3), and Profile-IV (S4-S6), among many combinations of all large shots for our refraction analysis, because these profiles have sufficient amount of P-wave travel time data with good quality and the station distribution on each profile is almost linear. We noted that a profile connected between S5 and S6 was excluded from our refraction analysis, because the travel time data were obscure due to strongly attenuated seismic waves. Fig. 2 shows examples of the record sections of seismograms on the profiles. In addi-tion, we used also the travel time data along two reflection profiles, Profile-NS and Profile-EW, as shown in Fig. 1(b), for our refraction analyses. Adense station distribution with an interval of 50-60 m along the reflection profiles is expected to provide information of the upper-most sub-surface velocity structure.
3.Travel time analysis
In order to construct a simple two-dimensional P-wave velocity model along each profile, we carried out refrac-tion analysis of the travel time data by a forward modeling technique following the three steps;
STEP 1:
We applied the classical travel time analysis “a layer-stripping approach” (Ivandic et al., 2008) to the travel time data in each profile. In Fig. 3(a), we showed examples of the travel time curves along I (S1-S5) and Profile-II (S1-S8). From the travel time curves, we assumed a two-layered model for Profile-I and a three-layered model for Profile-II. An apparent P-wave velocity for the upper layer along each profile was estimated by the travel time data observed at the stations located adjacent to the shots. It is found that the apparent velocities in the upper layers for all profiles take various values. We also distinguished the refracted phases from all data. It is noted that there is no reverse data for the phases refracted through the third layer in Profile-II.
STEP 2:
We estimated the least squares velocity for the refracted layer and the time-terms at each stations along each profile, by applying the time-term method (Berry and West, 1966; Mereu, 1966) to the travel time data of the
refracted phases certified in STEP 1, as shown in Fig. 3(b). We also showed the thickness of the upper layer converted from the time-terms obtained, assuming that the mean velocity for the upper layer near S1 is 2.5 km/s, in Fig. 3 (c). In consideration of these results and the various velocities for the upper layer, we constructed the initial rough model for the ray tracing analysis for STEP 3.
STEP 3:
We calculated the theoretical travel times for the initial model obtained in STEP 2 by the ray tracing computer program `RAYINVRʼ designed by Zelt and Smith (1992). We adjusted the model parameters, i.e. velocity values at the assigned points and the depth distribution of the velocity boundary in the model, by a trial-and-error procedure so as to reduce the difference between the theoretical and observed travel times.
4.P-wave velocity models
Fig. 4 shows a surface geological map in the inland study area describing major rocks and geologic structure modified from Uto et al. (1997). It is obvious that the surface in the inland area is widely covered by Quaternary pyroclastic flows and volcanic rocks. Under the surface pyroclastic flows, Pleistocene sediments, tuff and tuff breccia can be found. In the eastern part of the study area, Late Cretaceous Shimanto Group (Kamae Subgroup) is widely distributed. In geology, the Shimanto Group con-sisting of alternation of strata of sandstone and mudstone is regarded as a basement in south Kyushu. It is also confirmed that the Shimanto Group goes underground in the western and northern parts. There is an outcrop of the Middle Miocene igneous rocks, penetrating the Shimanto Group, in the southeastern part.
We show the final velocity model, ray diagrams for two or three shots, and a reduced travel time graph obtained along each profile in Figs. 5 to 10.
Profile-NS and Profile-EW
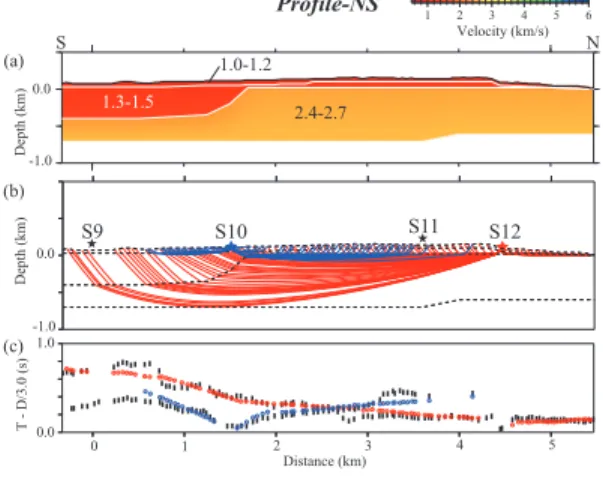
Figs 5 and 6 show the subsurface velocity models along the Profile-NS and Profile-EW, respectively. Asub-surface with a thickness of 100-200 m consists of two layers; an upper layer with a velocity of 0.8-1.0 km/s in Profile-EW and 1.0-1.2 km/s in Profile-NS and a lower layer with a velocity of 1.1-1.3 km/s in Profile-EW and 1. 3-1.5 km/s in Profile-NS (Figs. 5(a) and 6(a)). It is also found that the lower layer between S9 to S10 on Profile-NS significantly thickens to 400 m. Based on the geology around the area, we think that the upper layer is composed mainly of a lava bed and unconsolidated volcaniclastic material, and that the lower layer is composed of indurated tuff and tuff breccia. Abottom layer below the subsurface usually has a velocity of 2.5-2.8 km/s in Profile-EW and 2.4-2.7 km/s in Profile-NS.
Profile-I (S1-S5)
This profile is located outside of the northern edge of the Aira caldera. As shown in Fig. 7, the model simply
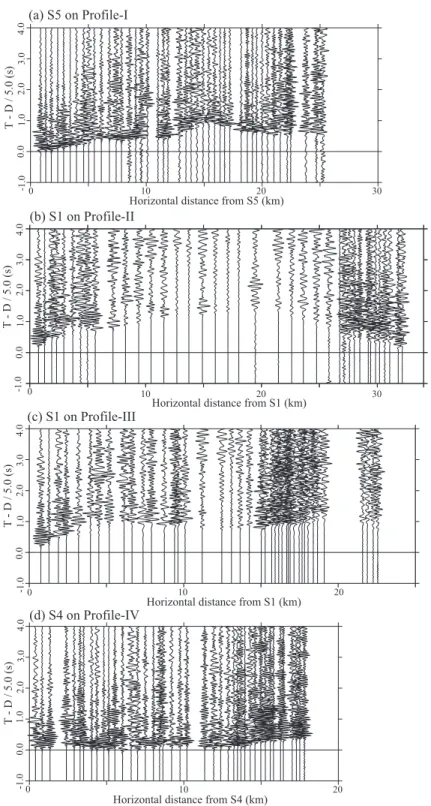
Fig. 2. Record sections for (a) shot S5 along Profile-I, (b) shot S1 along Profile-II, (c) shot S1 along Profile-III, and (d) shot S4 along Profile-IV. Amplitude of each trace is normalized by its maximum and travel times are reduced by 5 km/s.
consists of two layers: the first layer with a velocity of 2.3-2.8 km/s is a sedimentary surface and the second layer with a velocity of 4.9-5.2 km/s is the basement. The bound-ary between these two layers gradually inclines to a depth of 1-1.4 km toward west (Fig. 7(a)). Kobayashi and Yano (2007) compiled the boring core data in south Kyushu, and presented a depth distribution of the geological basement layer. According their result, an upper boundary of the Shimanto Group is inferred to be located at about 1 km depth in the central part of the profile. Threfore, we recognize that the first layer is composed mainly of Middle Pleistocene indurated tuff and tuff breccia, and that the second layer corresponds to the Shimanto Group.
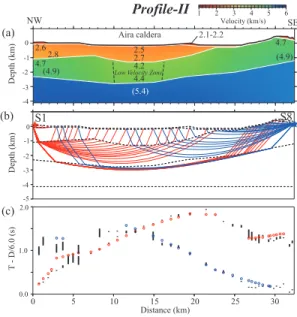
Profile-II (S1-S8)
This profile comes across the central part of the Aira caldera. Fig. 8 indicates that the second layer with a ve-locity of 2.5-2.8 km/s is about 1 km thick in the northwest and central parts of the Aira caldera, however it abruptly gets thin in the southeastern part of the profile. Comparing with the velocity model beneath S1 in Profile-I, we think that the third layer corresponds to the Shimanto Group. As shown in Fig. 4, an outcrop of the Shimanto Group can be seen near S8. The layer is also found to have a strong lateral velocity variation: a velocity of 4.2-4.4 km/s in the central part of the profile is significantly lower than that of 4.7-4.9 km/s in both sides of the profile. It is difficult to
confirm the boundary of the low velocity zone, due to lack of shots in the sea area. However, as shown in Fig. 2(b), it is clear that seismic waves passing through the central area in the caldera are especially attenuated due to an effect of both of the low velocity zone and the thick unconsolidated sedimentary layer in the sea area. Because of a sparse ray distribution, a velocity of the fourth layer and a depth distribution of the upper boundary of the layer can not be explicitly determined.
Profile-III (S1-S2-S3)
At some parts of the profile, a sedimentary layer with a velocity of 1.8-2.1 km/s is the first layer, as shown in Fig. 9. Avelocity of the second layer near S1 is about 2.7-3.0 km/s, whereas it decreases to 2.2-2.8 in Sakurajima vol-cano. The second layer in the Sakurajima area is com-posed mainly of lava flow and pyroclastic deposits, whereas in other areas it is composed mainly of indurated tuff and tuff breccia with some amount of lava flows.
The most important feature is a difference of velocities in the third layer between inside and outside of the volcano. The third layer in a zone between S1 and S2, considered to be composed of the Shimanto Group, is found to have a velocity of more than 4.6-4.7 km/s at about 1 km depth. Moreover, it is certain that this 4.6-4.7 km/s layer abruptly deepens under Sakurajima volcano. On the other hand, in a zone just beneath the volcano Fig. 3. Examples of the results in Profile-I and Profile-II obtained by classical travel time analysis. (a) the travel time curves
(open circles and triangles) and those (solid circles and triangles) modified by “a layer-stripping approach” (Ivandic et
al., 2008). Apparent velocities for the upper layers are also shown in the figures. (b) the obtained distribution of the
time-terms (solid circles). The travel time data in the range indicated by a hatched line are applied to the time-term method (Berry and West, 1966; Mereu, 1966). The estimated least squares velocity (L.S.V.) is also shown in the figures. (c) the depth distribution of the boundary (solid circles) between the upper and lower layers. The velocity of 2.5 km/s for the upper layer is assumed. Open triangles indicate the station heights.
between S2 and S3, the velocity of the third layer is estimated to be 3.6-3.7 km/s at 1 km depth. These facts are consistent with a schematic geological image of the Kagoshima graben showing a step-like depression struc-ture of the Shimanto Group toward the center of the graben presented by Hayasaka (1982). However, the thickness of the 3.6-3.7 km/s layer remains obscure due to sparse ray distribution as shown in the ray diagram in Fig. 9(b). The low velocity layer underneath Sakurajima volcano may be composed of caldera ponded deposits such as Middle Pleistocene brecciated tuff, tuff breccia, and lava. We also suppose that the boundary between the 4.6-4.7 km/s and 3. 6-3.7 km/s layers may correspond to the western margin of the Kagoshima graben in topography.
Profile-IV (S4-S6)
This profile, running across the southern boundary of the Aira caldera, is characterized by an existence of the inclined layer (the fourth layer) of high velocity (5.2-5.4 km/s), as described in Fig. 10. This layer is distributed at about 0.3 km depth near S4. It gradually descends toward the northern part of the profile and reaches to a depth of about 2 km near S6. We also found that the second and third layers, with a velocity of 2.4-2.7 and 4.3-4.5 km/s, thicken from south to north, though the velocity of 4.3 km/s in the third layer is not well constrained due to the insufficient travel time data. The second layer is supposed to be composed of volcaniclastic deposits. Geological out-crop near S4 also suggests that the third and fourth layers may consist of the Shimanto Group and granitic rocks. 5.Discussion and Summary
We compared our velocity models with regional gravity anomalies by Komazawa et al. (2008). As shown in Fig. 11, a positive high gravity anomaly with more than+30 mgal can be seen in the southern part of Profile-IV (S4-S6), and the value of the anomaly decreases toward the center of the Aira caldera, and becomes negative near S6. This gravity anomaly distribution is in accordance with the depth distribution of the high velocity layer with a velocity of more than 5.2 km/s deepening toward S6 from S4 in Fig. 10. In Profile-II, an extent of the negative gravity anomaly in the sea area of the Aira caldera may be caused by the thick sedimentary layer with a velocity of 2.5-2.8 kms/ in Fig. 8. In particular, a location of the strongly negative Fig. 4. Outline of a distribution of major rocks and
geo-logic structure in the study area (modified after Uto et
al., 1997). Stars and solid circles indicate the shot and
station locations along the refraction profiles, respec-tively. Ashaded ellipsoid area is the Wakamiko caldera.
Fig. 5. P-wave velocity model for Profile-NS. (a) The final P-wave velocity model. Numerical values in the figure indicate velocities in km/s. (b) Ray diagrams for S10 (blue) and S12 (red) for the final velocity model. (c) Observed (black bars) and calculated (circles) travel times. Travel times obtained for S9, S10, S11 and S12 are used for the refraction analysis. The ray diagrams for S10 and S12 are only presented in (b).
gravity anomaly with more than −20 mgal in the central part of the Aira caldera is consistent with the distribution of the low velocity zone (4.2-4.4 km/s). It is found in the sea area near S2 in Profile-III that the gradient of the gravity anomaly is steep. This suggests that the under-ground structure in the area is complicated and varies abruptly. The steep inclination of the basement layer with a 4.6 km/s velocity toward Sakurajima volcano in Fig. 9 may reflect the complexity of the structure.
Komazawa et al. (2008) also estimated the depth distri-bution of the gravity basement in Sakurajima. According to their result, the depth of the gravity basement in the strongly negative gravity anomaly area in the northeastern
sea area of Sakurajima is about 2 km below sea level, which agrees with the depth distribution of the upper boundary of the high velocity layer with more than 5 km/s in Profile-II. In the northwestern and western regions in Sakurajima, Komazawa et al. (2008) estimated depth of the gravity basement to be at about 0-1 km below sea level. This depth corresponds to the upper boundary of the Fig. 6. P-wave velocity model for Profile-EW.
Explana-tion is the same as in Fig. 5. Travel times obtained for S11, S13, S14 and S15 are used for the refraction analysis. The ray diagrams for S11 and S15 are only presented in (b).
Fig. 7. P-wave velocity model for Profile-I. Explanation is the same as in Fig. 5.
Fig. 8. P-wave velocity model for Profile-II. Explanation is the same as in Fig. 5.
Fig. 9. P-wave velocity model for Profile-III. Explanation is the same as in Fig. 5. Travel times obtained for S1, S2 and S3 are used for the refraction analysis. Apart of the ray diagrams for S2 is neglected in (b).
layer with a velocity of 3.6-3.7 km/s in Profile-III. On the other hand, Yokoyama and Ohkawa (1986) showed the gravity basement located at about 2. 5 km in depth just beneath Sakurajima volcano, which is consistent with the depth of the Shimanto Group with a velocity of 4.6 km/s estimated in this study.
Fig. 12 illustrates a schematic shallow velocity image in Sakurajima volcano and the Aira caldera presumed by this study. Within Sakurajima volcano, the surface layer with a low velocity (1. 5-1. 8 km/s), composed of lava and volcanic ash of Sakurajima volcano, is distributed and usually has a thickness of less than 100 meters. The
second layer with a velocity of 2.3-2.8 km/s is considered to be composed of Pleistocene sedimentary rocks, Quater-nary pyroclastic flow deposit, and volcanic rocks. The velocity distribution of the third layer, which is considered to be the basement in this study, is more complicated: in the edge of the Aira caldera, a layer with a velocity of 4.6-5.0 km/s, considered to be composed of the Shimanto Group, is widely distributed at 1-3 km depth, and in the
Fig. 12. Aschematic shallow velocity image in the Sakurajima volcano and the Aira caldera. Numbers in the figure indicate the P-wave velocities in km/s. The upper enclosed area describes the focal regions of the shallow volcanic-tectonic (VT1), A-type (A1) and explosion (EX) earthquakes. The circular areas in the enclosed area correspond to the main focal region of BL-type and BH-type earthquakes, respectively. The lower enclosed area is the focal region of the deep volcanic-tectonic (VT2) and A-type (A2) earthquakes. Classification of volcanic earthquakes is referred to Iguchi (1994) and Hidayati et al. (2007).
Fig. 10. P-wave velocity model for Profile-IV. Explana-tion is the same as in Fig. 5.
Fig. 11. Bouguer gravity anomaly distribution revealed by Komazawa et al. (2008). Numbers in the figure indicate the gravity anomaly in mgal. Stars and solid circles indicate the shots and temporary seismic stations used in this study, respectively. The figure is modified after Komazawa et al. (2008).
central part of the Aira caldera the low velocity zone with a velocity of 4.2-4.4 km/s is located. On the other hand, a layer with a velocity of 3.6-3.7 km/s and a thickness of 1-2 km is located just only beneath Sakurajima volcano. As shown in Fig. 8 (Profile-II) and Fig. 10 (Profile-IV), it is noted that the 3.6-3.7 km/s layer is not detected beneath the eastern side of Sakurajima volcano. Therefore, we deduce that the layer is locally distributed in the western part of the volcano. This is consistent with the geological image of the Kagoshima graben by Hayasaka (1982), showing that the Shimanto Group in the western area of Sakurajima is notably deeper than that in the eastern area. The fourth layer, the deepest layer revealed in this study, generally has a high velocity of 5.2-5.4 km/s. This high velocity layer deepens towards the center of the Aira caldera. Previous studies for the velocity structures in the vol-canic regions such as Unzen volcano (Nishi, 2002), Hokkaido Komagadake volcano (Onizawa et al., 2009), and Asama volcano (Aoki et al., 2009) indicate a common feature that the high velocity basements uplift beneath the volcanoes. However, our model shows no uplift of the basement: the Shimanto Group with a velocity of 4.6-5.0 km/s is inclined toward the center of the Aira caldera. We suppose that the inclination of the basement layer is caused by the predominant normal fault-type structure in the Kagoshima graben. Geological studies such as Aramaki (1984) and Hayasaka et al. (1978) showed that the Kagoshima graben was formed 3 million years ago and was accumulated and filled up by the thick marine deposit composed of tuffaceous sandstone and tuff breccia. About 29,000 years ago (Okuno, 2002), a series of large-scale pyroclastic eruptions occurred at the northern end of the Kagoshima bay and formed vast pyroclastic plateau around the Aira caldera. After 3000 years dormant period, Sakurajima started to erupt as a submarine volcano (Okuno, 2002). Therefore, we suppose that the magma of Sakurajima volcano had penetrated through the thick marine deposit in the Kagoshima graben. This may be a cause of an existence of the low velocity zone with a velocity of 3.6-3.7 km/s just beneath Sakurajima volcano, as shown in our model.
Hidayati et al. (2007) and Iguchi et al. (2008) showed the locations of two magma reservoirs: one reservoir is located at a depth of 5 km beneath Sakurajima volcano and the other is at the 11 km depth beneath the Aira caldera. It is found that the low velocity zone revealed in the central part of the Aira caldera is located over the deep magma reservoir. As shown in Fig. 2(b), it is obvious that the seismic waves observed in the sea area are strongly attenuated. In addition, it is also well known that there is a continuing vigorous submarine fumarolic activity at the Wakamiko caldera in the Aira caldera (Kobayashi, 1988a). Though our refraction analysis can clarify the velocity structure only up to 3 km depth, it is suggested that the high activity of the magma plumbing system connected to
deep magma may be related to the low velocity zone revealed in the central part of the Aira caldera.
Iguchi (1994) classified shallow volcanic earthquakes occurred beneath the summit region of Sakurajima volcano into four groups, A-type, BH-type (a high frequency B-type), BL-type (a low frequency B-type) and explosion earthquakes, and revealed a precise distribution of these earthquakes. According to the results in Iguchi (1994), A-type earthquakes seem to occur in two depth ranges: 0-1.5 km for shallow A-type and 2.4-3.4 km for deep A-type earthquakes. BL-type and BH-type earthquakes are mainly located in a depth range of 0-1. 2 km and 1. 3-2. 4 km, respectively. Afocal depth of explosion earthquakes is 0-2 km. Comparing these focal depth distributions with our model, we found that the shallow A-type earthquakes occur in the 2.3-2.8 km/s and 3.6-3.7 km/s layers, and the deep A-type earthquakes in the 5. 2-5. 4 km/s layer, as shown in Fig. 12. BL-type and BH-type earthquakes seem to be mainly distributed in the 2.3-2.8 km/s and the 3.6-3.7 km/s layers, respectively. The explosion earthquakes are located in the 2.3-2.8 km/s and 3.6-3.7 km/s layers. Ishihara (1988) and Hidayati et al. (2007) also showed a precise distribution of volcano-tectonic (VT) earthquakes beneath the summit region of Sakurajima volcano, and pointed out a seismic gap at about 2 km depth between the shallow and deep focal regions of VT earthquakes. They interpreted the seismic gap as a small magma pocket. As shown in Fig. 12, the shallow VT earthquakes are concen-trated inside the low velocity zone with a velocity of 3.6-3.7 km/s. On the other hand, the deep VT earthquakes mainly occur in the area with a velocity of 5.2-5.4 km/s. It is obviously found that the seismic gap is located in the layer with a velocity of 4.6-5.0 km/s directly below the 3.6-3.7 km/s zone. Because our seismic profile does not cross the summit region, it is difficult to directly estimate the velocity in the seismic gap. However, it is expected that a velocity in the small magma pocket may be lower than 4.6-5.0 km/s in the surrounding zone. These facts indicate a possibility that the underground structure strongly restricts an expanse of focal region of each different type of the volcanic earthquakes.
Finally, the first arrival time data of the refracted waves can provide the shallow velocity model beneath the Aira caldera and Sakurajima volcano. In order to describe ex-plicitly the shallow magma reservoir located at a depth of 5 km and the magma plumbing system in the velocity model, it is necessary to analyze the later phases such as reflected waves in the further study.
Acknowledgements
We wish to express our thanks to the participants of the Sakurajima seismic experiment in 2008. We also thank two reviewers for their advice to improve greatly the manuscript. The seismic experiment in 2008 was sup-ported by the National Project for the Prediction of
Vol-canic Eruption in Japan. Some figures are drawn by the Generic Mapping Tools (Wessel and Smith, 1998).
References
Aoki, Y., Takeo, M., Aoyama, H., Fujimatsu, J., Matsumoto, S., Miyamachi, H., Nakamichi, H., Ohkura, T., Ohminato, T., Oikawa, J., Tanada, R., Tsutsui, T., Yamamoto, K., Yamamoto, M., Yamasato, H. and Yamawaki, T. (2009) P-wave velocity structure beneath Asama volcano, Japan, in-ferred from active source seismic experiment. J. Volcanol.
Geotherm. Res., 187, 272-277.
Aramaki, S. (1984) Formation of the Aira caldera, southern Kyushu, -22,000 years ago. J. Geophys. Res., 89, 8485-8501.
Berry, M.J., and West, G.F. (1966) An interpretation of the first-arrival data of the Lake Superior experiment by the time-term method. Bull. Seismol. Soc. Amer., 56, 141-171. Hayasaka, S., Oki, K., Kamada, M. and Henmi, T. (1978) Structual patterns of the northern part of Kagoshima Bay.
Bull. Volcanol. Soc, Japan, 32, 288 (in Japanese with English
abstract).
Hayasaka, S. (1982) Kagoshima Bay as a graben depression. In Basement and subsidence structure in Kyushu, 1 (Y. Matsumoto ed.), 76-78, Yamaguchi Univ., Yamaguchi (in Japanese with English abstract).
Hidayati, S., Ishihara, K. and Iguchi, M. (2007) Volcanic-tectonic earthquakes during the stage of magma accumula-tion at the Aira caldera, southern Kyushu, Japan. Bull.
Volcanol. Soc. Japan, 52, 289-309.
Iguchi, M. (1994) Avertical expansion source model for the mechanisms of earthquakes originated in the magma con-duit of an andesitic volcano: Sakurajima, Japan. Bull.
Vol-canol. Soc. Japan, 39, 49-67.
Iguchi, M., Takayama, T., Yamazaki, T., Tada, M., Suzuki, A., Ueki, S., Ohta, Y. and Nakao, S. (2008) Movement of magma at Sakurajima volcano revealed by GPS observa-tion. Ann. Disast. Prev. Res. Inst., Kyoto Univ., 51-B1, 241-246 (in Japanese with English abstract).
Iguchi M., et al. (2009) The 2008 project of Artificial Explosion Experiment at Sakurajima volcano. Ann. Disast.
Prev. Res. Inst., Kyoto Univ., 52-B1, 293-307 (in Japanese
with English abstract).
Ishihara, K. (1988) Geophysical evidence on the existence of magma reservoir and conduit at Sakurajima volcano, Japan.
Ann. Disast. Prev. Res. Inst., Kyoto Univ., 31B1, 1-15 (in
Japanese with English abstract).
Ivandic, M., Grevemeyer, I., Berhorst, A., Flueh, E.R. and McIntosh K. (2008) Impact of bending related faulting on the seismic properties of the incoming oceanic plate off-shore of Nicaragua. J. Geophys. Res., 113, B05410, doi: 10. 1029/2007JB005291.
Kobayashi, T. (1988a) Geology and petrology. In A guidebook
for Sakurajima volcano (Part 1 Scientific guide), 13-27.
(Aramaki, S., Kamo, K., and Kamada, M. eds) Kagoshima International Conference on Volcanoes.
Kobayashi, T. (1988b) Geological map of Sakurajima vol-cano. In A guidebook for Sakurajima volvol-cano. (Aramaki,
S., Kamo, K., Kamada, M., and Kagoshima Prefectural Government eds) Kagoshima International Conference on Volcanoes, 88p.
Kobayashi, T. and Yano T. (2007) Geology, geologic struc-ture, and hot springs in southern Kyushu, Japan. J. Hot
Spring Sci., 57,11-29 (in Japanese with English abstract).
Komazawa M., Nakamura, K., Yamamoto, K., Iguchi, M., Akamatsu, J., Ichikawa, N., Takayama, T. and Yamazaki, T. (2008) Gravity anomalies at Sakurajima volcano, south-west Kyushu. Ann. Disast. Prev. Res. Inst., Kyoto Univ., 51-B1, 261-266 (in Japanese with English abstract). Mereu, R.F. (1966) An iterative method for solving the
time-term equation. “The Earth beneath the Continent”. AGU
Monograph, 10, 495-497.
Miyamachi H., Higashiura, K., Hirano, S. and Yamamoto, A. (2000) High dense gravity measurement in Sakurajima vol-cano, southern Kyushu, Japan. Rep. Fac. Sci., Kagoshima
Univ., 33, 101-116 (in Japanese with English abstract).
Nishi, K (2002) Three-dimensional seismic velocity structure beneath Unzen volcano, Kyushu, Japan inferred by tomo-graphy from experimental explosion data. Bull. Volcanol.
Soc. Japan, 47, 227-241.
Okuno, M. (2002) Chronology of tephra layers in southern Kyushu, SW Japan, for the last 30, 000 years. The
Quaternary Research, 41, 225-236.
Onizawa, S., Oshima, H., Aoyama, H., Mori, H.Y., Maekawa, T., Suzuki, S., Tsutsui, T., Matsuwo, N., Oikawa, J., Ohminato, T., Yamamoto, K., Mori, T., Taira, T., Miyamachi, H. and Okada, H. (2007) P-wave velocity structure of Usu volcano: Implication of structural controls on magma movements and eruption locations. J. Volcanol.
Geotherm. Res., 160, 175-194.
Onizawa, S., Oshima, H., Aoyama, H., Maekawa, T., Suzuki, A., Miyamachi, H., Tsutsui, T., Matsushima, T., Tanaka, S., Oikawa, J., Matsuwo, N., Yamamoto, K., Shiga, T. and Mori, T. (2009) Basement structure of Hokkaido Komaga-dake volcano, Japan, as revealed by artificial seismic survey. J. Volcanol. Geotherm. Res., 183, 245-253. Tsuyuki, T. (1969) Geological study of hot springs in Kyushu,
Japan (5) - Some hot springs in the Kagoshima graben, with special reference to thermal water reservoir. Rep. Fac . Sc i.
Kagoshima Univ. (Geology and Biology). 2, 85-101.
Uto, K., Sakaguchi, K., Teraoka, Y., Okumura, K. and Komazawa, M. (1997) Geological Map of Japan 1 : 200,000, Kagoshima, Geological Survey of Japan.
Wessel, P., and Smith, W.H.F. (1998) New improved version of the Generic Mapping Tools released. EOS Trans., A mer. Geophys. Union, 79, 579.
Yakiwara, H., Iguchi, M., Tameguri, T., Tsutsui, T., Oikawa, J., Ohkura, T. and Miyamachi, H. (2009) Three-dimen-sional P-wave velocity structure and the explosion field at the shallow part of Suwanosejima volcano. Bull. Volcanol.
Soc. Japan, 55, 75-87.
Yokoyama, I. and Ohkawa, S. (1986) The subsurface structure of the Aira caldera and its vicinity in southern Kyushu, Japan. J. Volcanol. Geotherm. Res., 30, 253-282. Zelt, C.A. and Smith, R.B. (1992) Seismic traveltime
inver-sion for 2-D crustal velocity structure. Geophys. Jour. Int., 108, 16-34.
(Editional handling Takeshi Hashimoto)