Spatial Structure of Aging in Four Regional
Central Cities in Japan : Sapporo, Sendai,
Hiroshima and Fukuoka
著者
FENG Lei
journal or
publication title
The science reports of the Tohoku University.
7th series, Geography
volume
61
number
1
page range
43-62
year
2015-08
URL
http://hdl.handle.net/10097/60654
Spatial Structure of Aging in Four Regional Central Cities
in Japan : Sapporo, Sendai, Hiroshima and Fukuoka
Lei FENG*
Abstract Aging in urban areas will be a main subject in some countries in the 21st century if urbanization is the global theme of the urban space development in the 20th century. Although the phenomenon of aging has been studied thoroughly in demogra-phy, economics, and health science, the spatial structure of aging in urban areas remains little understood. This report describes an intensive investigation conducted of Japan’s four regional central cities : Sapporo, Sendai, Hiroshima, and Fukuoka, and aimed to clarify the pattern and trend of aging in urban areas through grasping the char-acteristics of residential segregation by age group. Results showed that the spatial pattern of segregation roughly appears as a concentric shape that is closely related to the development period of urban area in the time dimension, as well as related closely to the distances from the city center in the spatial dimension. Furthermore, because we confirmed the neighborhood change will obey the rule of “aging in place,” it can be inferred that aging neighborhoods will spread out from the city center to the suburbs, and that renewal of neighborhoods obeys the same order. Through recognition of the spatial structure of aging in urban areas, we hope this study will provide a theoretical basis for the spatial planning and optimal configuration of resources in an aging society. Key words : aging, residential segregation, neighborhood change, Japan
*Doctoral Candidate, Department of Earth Science, Graduate School of Science, Tohoku University, 6-3, Aza Aoba, Aramaki, Aoba-ku, Sendai 980-8579, Japan
E-mail : [email protected] 1. Introduction
Japan has entered the era of a super-aging society in 2005. In 2014, the elderly
popula-tion rate reached 25.9% (MIAC, 2014). It is projected that more than a third of the populapopula-tion will be elderly (65 years or older) in 2035 (NIPSSR, 2014). The declining birthrate and grow-ing proportion of elderly population have become the most important social problems in Japan. The spatial order (mainly including three dimensions : spatial regularity, spatial structure, and spatial process (Ishimizu, 1974)) of aging at different scales is becoming a topic of concern to geographers. At the national scale, the aging regions have been spreading from sparsely popu-lated villages to densely popupopu-lated urban regions (Mori, 1997). At the city or metropolitan scale, local enclaves of extreme aging have been reported, but the spatial order of aging has not been clarified systematically. Aging neighborhoods first appeared in inner cities (Ishimizu, 1981 ; Takayama, 1982) ; then aging in suburban residential estates was reported (Kinjyo,
1983). This study sheds light on how aging neighborhoods are expected to spread throughout urban area, especially its patterns, determinants and trends. This research contributes in local demographic forecasting and provides information to urban physical and social planning policies.
Aging in suburbs is a main characteristic of urban space transition in Japanese cities. Dur-ing the rapid economic growth period in Japanese cities from the 1960s through the 1970s,
Newtowns were constructed on the outskirts of large cities to meet the housing pressure of
inflowing population (Fukuhara, 1998). After several decades, these Newtowns were trans-formed to Old towns because of the rapid increase of elderly population since around 2000, attributable to baby boomers (in Japanese Dankai generation, those born during 1947-1949)
were incorporated into the elderly population after 2000. Multidisciplinary approaches were used to analyze the reasons for aging in the suburbs. Urban geography and other related fields such as urban planning and real estate research give some explanations from different perspec-tives : First, from the perspective of demography, the age structure of inhabitants in newly developed suburbs had always a strong polarized characteristic. Residents aged from their 30s to 40s and their children shared an overwhelming amount of residents compared to other age groups. By the end of the 1990s, the parent generation began to join the elderly population. Moreover, their children became independent and moved out elsewhere. A substantial increase occurred in the proportion of the elderly population (MHLW, 2000 ; Naganuma et al., 2006 ; Ito, 2010). Secondly, from the perspective of urban planning, almost all Newtowns were designed as pure residential areas as a part of the urban context. Although the development of Japanese Newtowns was referred from British experience, the concept is somehow different (Omichi, 1966). In addition to the variety of population size (i.e. from thousands to hundreds of thousands), some fundamental distinctions apply to Japanese Newtowns. Japan’s Newtowns
were invariably located inside of commuter zones in a metropolitan area, recognized as a bed-room community. Apart from nursery schools, primary schools, and basic commercial facili-ties, they have insufficient ability to supply more functions such as recreation and employ-ment. Compared to self-contained and well-balanced British Newtowns, Japanese Newtowns
became places purely for living. Finally, from the perspective of the housing market, probably because of some institutional and common attitude reasons, Japan’s secondhand housing market is underdeveloped compared to those of other advanced countries. The share of secondhand housing in the total housing market in Japan was about 13.5% in 2008. Although that share is becoming larger in recent years, it is about one-sixth that of western countries (MLIT, 2014).
Most younger families with housing needs generally choose more remote and newly developed suburban estates instead of purchasing secondhand housing in aging communities.
From the late 1990s, the so-called “back to the city”, or Toshin-kaiki movement first
began in Tokyo, Osaka, Nagoya, and then in smaller cities ; thereby the city center regained population gradually (Yamagami, 2003). Most scholars explain this phenomenon as attribut-able to the abrupt collapse of the real estate bubble after 1991. The rapid decline of land prices in central urban areas enabled the development of high-rise residential buildings. Therefore
population recovered thereafter (Yabe, 2003 ; Tomita, 2004 ; Miyazawa and Abe, 2005 ; Koi-zumi et al., 2011). Some scholars have tried to give explanations through using the life cycle model of neighborhood change. By observing the original residents living in the city center become aged and gradually decreased, land lots formerly belonging to elderly households were released and redeveloped into apartments. Therefore, the new influx of population became possible in city centers (Sonoda, 2010). Furthermore, some studies have analyzed Japan’s social change, including demographic shifts and diversification of family types, e.g. from large households to small households because of the increasing of single-person households, and
DINK families. As is true also for some changes in employment situation, increasingly numer-ous female workers and Tanshinfuninshya : people who live apart from their own family to work in another city (Yui, 2006 ; Kubo and Yui, 2011a). Furthermore, the change of life modalities, such as people pursuing amenities by living in the city, are increasing in recent years (Sakakibara et al., 2003 ; Kubo and Yui, 2011b). All of these demands have made city centers a new frontier of housing development.
This study assesses features of the coexistence of the two phenomena of current Japanese cities ; i.e. aging in inner suburbs and population recovering in city centers as a process that is explainable by the spatial pattern of residential structures in most Japanese cities. This study attempts to build a model to establish a connection between the two phenomena. Conse-quently, to clarify the spatial order of aging at a city scale, as well as the regularity of neighbor-hood change, we chose four regional central cities : Sapporo, Sendai, Hiroshima, and Fukuoka as the study area. The data we used for the study are based on National Population Censuses 2000 and 2010 and related geospatial data derived from National Land Numerical Information. The analyses are mainly conducted through the application of Geographical Information System platform (GIS, ArcGIS 10.2.1 version ; Esri). First, we examine the existence of residential segregation by age groups in each city. Secondly, we investigate the causes of this differentia-tion and analyze the characteristics of spatial distribudifferentia-tion of each age group. Finally, we try to generalize the pattern and trend of aging, as well as the regularity of neighborhood change. 2. Previous Studies and the Study Areas
2.1 Research on residential differentiation and neighborhood change in cities
Research on residential areas began in the 20th century (Booth, 1902). From the 1920s, the Chicago School of Human Ecology undertook studies to elucidate the spatial patterns of urban land use from an ecological perspective. Research on residential differentiation became a hot issue in the field of urban studies. A study by Shevky and Bell (1955), which laid the foundation of social area analysis, was based on the theory of social change, using a multivariate classification procedure to overcome the shortcomings of the Chicago ecologists. In the 1960s, as the popularization of quantitative analysis in social science, factorial ecology analysis became the main method of urban residential area research. Factorial ecology measures the
social, economic, and demographic characteristics of census tracts.
Difference, diversity, and identity are key concepts in postmodern readings of the city. Differences in cities are constructed across many dimensions including class, ethnicity, lifestyle, gender, sexuality, age, and able-bodiedness. Of particular significance for geographers, social
differences often take on a spatial or territorial identity (Castells, 1997), which contributes to the construction of communities in the city. Consequently, studies of the overall urban struc-ture have been shifted to the formation and development of communities. The concept of community cohesion1) and subculture theory2) support the view that the process underlying
neighborhood change engenders a sorting of the urban population into a mosaic of social domains.
The initial studies of neighborhood dynamics were conducted by identifying stages in the process of neighborhood change (Hoover and Vernon, 1962 ; Temkin and Rohr, 1996). Downs (1981) put forward a five-stage model of neighborhood change, and summarized the factors that
might increase a neighborhood’s susceptibility to decline or revitalization (Pacione, 2009). Neighborhood change in North American cities has been facilitated by the decrepitude of hous-ing conditions, accompanied with the replacement of former inhabitants. Decrepit and low
-rent housing located in the city center became the main residential areas of immigration and low-income families ; along with improvement of income and social status, they left the city
center and moved outward to reach a higher-level community. Then, the city center again
became occupied by new immigrants and minorities. In the case of Asian cities, especially Japanese cities, socioeconomic and ethnic factors are not as marked as in the cities in North America. Moreover, the durability of housing is shorter. Family status and lifestyle factors are recognized as the main reasons for residential differentiation (Watanabe, 1978 ; Nakazawa and Kawaguchi, 2001 ; Tani, 2002).
In the mainstream of urban residential differentiation research, especially the studies of family status as impact factor, household size, and age structure are often considered. The spatial differences of age structure are often regarded as an incident factor (McKenzie, 1933 ; Okui, 1940 ; Newcomb, 1957 ; Hoover and Vernon, 1962) reflected in the physical conditions of housing or social-economic status, but are not regarded as an independent factor to influence
residential differentiation. In recent years, studies of aging in urban areas have attract much attention in Japan3). However, most of those studies were limited only to reports of specific
cases based on statistics or questionnaire surveys, and do not conduct a systematic analy-sis. Furthermore, few studies have examined the spatial differences of age structure and the neighborhood change into a unified context. The analyses of Robson (1973) and Matsumoto (2004) provide the possibility of bridging the gap separating neighborhood change and residen-tial differentiation by age structure. Their studies reach a consensus that the lifecycle of neighborhood is defined by the life course of households.
Irrespec-tive of the socio-economic and ethnic factors, we used the basic attributes of person-age as the
main variable. Age hints at the stage of life, household structures, and even income and other attributes to some degree. This study considered residential differentiation by each age group, not limited to the elderly population, to identify the stage of “evolution” of the neighborhood. This study was conducted to reveal the spatial structure of aging in urban areas, and to ascer-tain the regularity of neighborhood change in Japanese cities.
2.2 Study areas
This study examines four Japanese regional central cities as study areas : Sapporo, Sendai, Hiroshima and Fukuoka. The following reasons explain their selection.
(1) These four regional central cities are distant from the three largest metropolitan areas4). The geographical independence makes it suitable and easier to determine a coherent
urban area.
(2) The populations in all the four cities are over 1 million5). Newtown development
occurred from the 1960s uniformly, compared to that in other designated cities outside of the three largest metropolitan areas6). Moreover, the four cities have more diverse communities
than smaller cities.
(3) The urban spatial structure is roughly approximated as a concentric pattern, with a single city center.
3. Residential segregation by age groups 3.1 Measuring segregation
Considerable controversy has persisted over the measurement of segregation. Massey and Denton (1988) used an extensive literature search and cluster analysis to identify 20 differ-ent indexes of segregation and classify them into five key dimensions of segregation. Funda-mentally, they are evenness, exposure, concentration, centralization, and clustering. A partic-ular issue is the effect of spatial scale of analysis of the results, as indices of segregation increase concomitantly with decreasing population size of the spatial units being used. This could engender invalid comparisons being made between levels of segregation in studies using different area units as a base. Care must therefore be taken to make comparisons at compara-ble scale levels.
Two measures of segregation are currently in general use : The index of dissimilarity (Duncan and Duncan, 1955) and the index of isolation (Lieberson, 1981). The index of dissimi-larity (D) compares the residential locations of pairs of groups (e.g. whites and blacks) and gives a measure of the net percentage of a population group who would have to be relocated to pro-duce an uniform community. The index values range from 0 to 1 (or from 0% to 100%) ; if the two groups were evenly distributed in all areas (e.g. census tracts) of the city, the index would be 0 (or 0%), whereas if the city were segregated completely and census tracts were inhabited
exclusively by one group or the other, the index would be 1 (or 100%). [1] D = aAi - Bbi i=1 n
!
Where,ai = population of subgroup a in statistic area i ;
A = population of subgroup a in all statistic areas ; bi = population of subgroup b in statistic area i ; and
B = population of subgroup b in all statistic areas.
One shortcoming of using D is that it does not take account of the fact that in a city in which two groups reside, one of which is much larger than the other ; there will be a greater probability of a member of the smaller group coming into contact with a member of the larger group than vice versa. The index of isolation (P*) measures both the potential for contact within groups or between groups and enjoys the advantage of using the same data inputs as D. Like the D this index runs from 0 (for a very small group that is quite dispersed) to 1 (meaning that group members are entirely isolated from other groups). It must be stated that this index is affected by the group size : it is almost invariably smaller for smaller groups, and it is likely to rise over time if the group becomes larger.
[2] P*= aAi S X ti
S X
ai i=1 n!
Where,ai = population of subgroup a in statistic area i ;
A = population of subgroup a in all statistic areas ; ti = total population in statistic area i.
We calculated the index of dissimilarity (D) and the index of isolation (P*) of each city for year 2010 based on national Census Small Areas (Chochomoku units). Table 1 shows the average value of D of the four cities. Then we highlight the maximum and minimum values for age groups in rows. Results show the following : (1) D in adjacent age groups is less than D in nonadjacent age groups in the case of people older than their 20s, i.e. the adjacent age groups live less segregated than the nonadjacent age groups after their independence (over 20 years old). (2) D in ages 0s and 30s, and 10s and 40s are smaller because the former age groups are children of the latter age group. (3) The maximum value of D is between 0s and people in their 70s and older, i.e. families with children and families with elderly people are the most seg-regated. Table 2 shows the value of P* in each city. We marked two age groups with the top two maximum values. In all four cities, we found that the 30s and persons in their 70s or older got the highest isolation index than other age groups. It can be inferred that the residential
areas of elderly people and young adults are more isolated from other age groups. The follow-ing sections 3.2 and 3.3 present analyses of the spatial distribution of each age group and the causes of this phenomenon.
3.2 Mapping segregation
We attempt to represent the pattern of residential segregation visually by age groups through GIS. Results showed that the Chochomoku unit (Census Small Areas), used in sec-tion 3.1 are not suitable for this analysis. Since the Chochomoku unit is too small (especially in the city center area) and the pattern was not easily identifiable. Therefore, we aggregated the statistic tracts to Oaza unit7). We calculated the specialization coefficient of six age groups
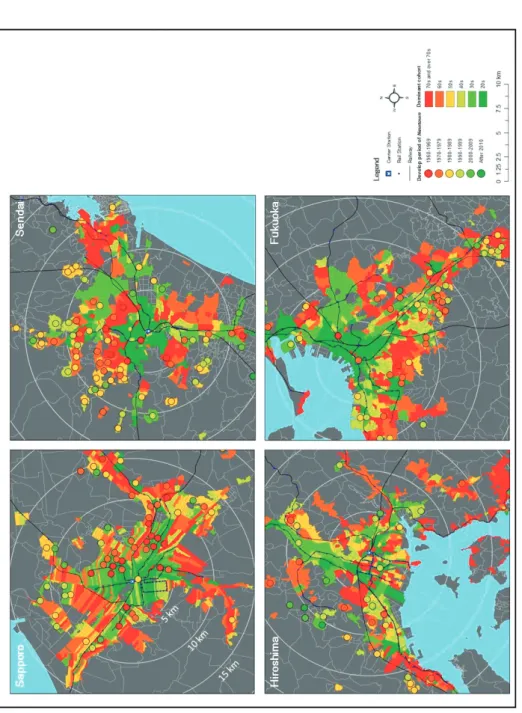
(from 20s to 70s and older) in all Oaza units. Then we assigned the age group that have the maximum specialization coefficient to an Oaza unit. The corresponding age group was recog-nized as the dominant residents in each Oaza unit. Figure 1 portrays the pattern of residential
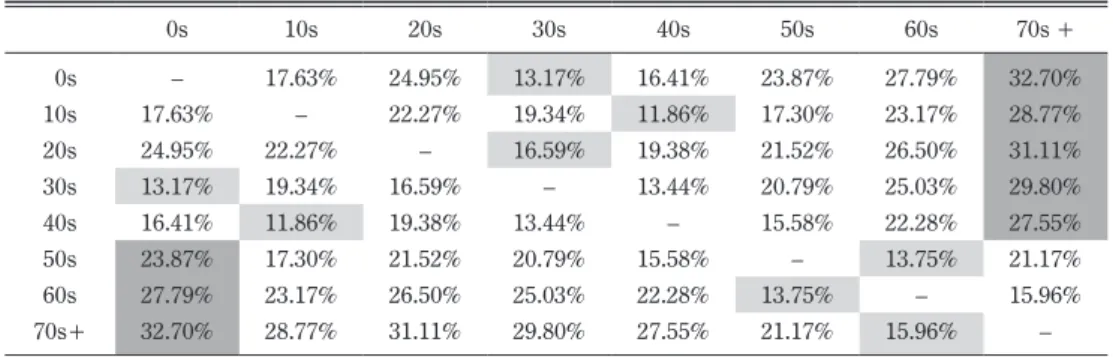
Table 1 Average Index of Dissimilarity of Four Cities in 2010
0s 10s 20s 30s 40s 50s 60s 70s + 0s – 17.63% 24.95% 13.17% 16.41% 23.87% 27.79% 32.70% 10s 17.63% – 22.27% 19.34% 11.86% 17.30% 23.17% 28.77% 20s 24.95% 22.27% – 16.59% 19.38% 21.52% 26.50% 31.11% 30s 13.17% 19.34% 16.59% – 13.44% 20.79% 25.03% 29.80% 40s 16.41% 11.86% 19.38% 13.44% – 15.58% 22.28% 27.55% 50s 23.87% 17.30% 21.52% 20.79% 15.58% – 13.75% 21.17% 60s 27.79% 23.17% 26.50% 25.03% 22.28% 13.75% – 15.96% 70s+ 32.70% 28.77% 31.11% 29.80% 27.55% 21.17% 15.96% –
Note : (1) Values were calculated according to Chochomoku units.
(2) Dark grey and light grey means the maximum and minimum value for each age group, respectively. (3) Scope of statistics was defined as the 30 km buffer area from each city’s center rail station (in this study, we chose Sapporo Station, Sendai Station, Hiroshima Station, and Tenjin Station).
Data source : National Census, 2010.
Table 2 Index of Isolation of Four Cities in 2010
0s 10s 20s 30s 40s 50s 60s 70s+
Sapporo 9.84% 11.31% 15.73% 16.52% 14.90% 14.98% 16.18% 19.99%
Sendai 11.82% 12.12% 16.15% 18.35% 15.11% 15.13% 15.39% 19.54%
Hiroshima 11.78% 11.62% 15.45% 16.97% 14.35% 13.68% 16.97% 20.42%
Fukuoka 11.35% 11.45% 15.17% 16.92% 13.97% 14.11% 14.93% 18.10%
Note : (1) Values were calculated according to Chochomoku units.
(2) Scope of statistics was defined as the 30 km buffer area from each city’s center rail station (in this study, we chose Sapporo Station, Sendai Station, Hiroshima Station, and Tenjin Station).
Figur e 1 R esidential segr egation by age gr oup in 2010. Note : (1) D ivisions of age gr oups ar
e based on data of the year 2010.
(2) The youngest age gr
oup which can be r
ecognized as having the ability to live independently is 20s.
(3) T
o delete the influence of “noise” values, e.g. in r
ural ar
eas with a significantly high pr
opor
tion of elderly population, we only selected the
Oaza units with a population density over 1000 people per squar
e kilometer (consider
ed as an urbanized ar
ea).
(4) The development period of Newtown was deter
mined by the star
t year of constr
uction and the finish year
. Sour ce : National Census, 2010 National L
and Numerical Infor
segregation by age groups in the four urbanized areas. We were able to observe some com-mon features : (1) people in their 20s, 30s, and part of 40s occupied mainly the inner areas ; (2) people in their 60s, and people in their 70s and older are the dominant age groups in the inner suburban areas ; (3) people in their 40s and 50s are more prevalent in outer suburban areas ; (4) some 30s residential areas are located in the urban peripheral areas, where the fron-tier of new residential development is located. We also overlay the layer of the distribution of
Newtowns above each segregation maps. It was readily apparent that the development period
of Newtowns has a certain corresponding relation with the dominant age group. Aside from the city center, the earlier developed Newtown is more likely dominated by elder residents. This regularity is especially clear in the case of Sendai city.
3.3 Cause of Segregation
We next analyze why residential segregation according to age groups happened and what factors determined its spatial pattern. From the perspective of residential differentiation, peo-ple with similar lifestyles and needs more likely make similar decisions when choosing residen-tial areas. Congregations of similar households form neighborhoods with their own identities. In western countries, this agglomeration process is implemented through the intra-city
move-ment of individual family (Rossi, 1955). Because it is hard to obtain unified residential reloca-tion records for each city over a long time span (e.g. several decades), it is impossible to ascer-tain the reason of residential segregation directly by age group through analyzing the character of intra-city population movement. However, we can infer from the age structure of the
indi-vidual urbanized areas (i.e. urbanized areas according to development period) at the current stage. In other words, through analyzing the age structures of the individual urbanized areas we can ascertain the remaining ratio (percentage of population who did not change residential area since the development of the area) of a specified age group to some extent. Although this result is not intuitive, it can provide some material to conduct further analyses.
Densely Inhabited Districts (DID) are urban areas that are designated based on statistical data which meet certain criteria8); DID have been designated in each census since 1960.
According to the individual DID area data of 1960-2010, the current urbanized area in 2010 are
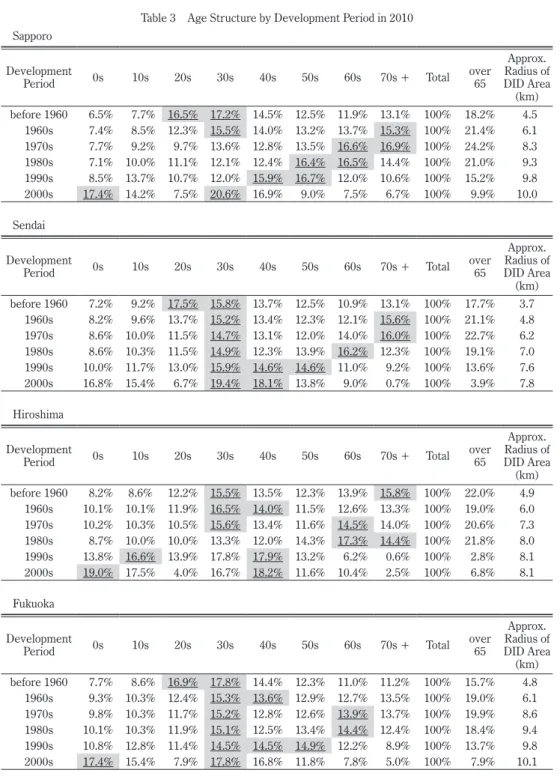
divisible into six parts as the following. The area built up before 1960 (old town where CBD located), and the area built up during the 1960-2000s in every 10 years. Using the national
population census data in 2010, we investigated the age structure of each area in four cities as shown in Table 3. Although the age distribution in areas varies among the four cities, we can confirm the trend through calculating the average percentage of each age group in the four cit-ies. The built up area developed before the 1960s is inhabited mainly by people in their 20s and 30s. The areas developed in the 1960s are inhabited mainly by people in their 30s and those in their 70s and older. The areas developed in the 1970s are inhabited mainly by people in their 60s and in their 70s and older. The areas developed in the 1980s are inhabited mainly by people in their 50s and 60s. The areas developed in the 1990s are inhabited mainly by
peo-Figur e 1 R esidential segr egation by age gr oup in 2010. Note : (1) D ivisions of age gr oups ar
e based on data of the year 2010.
(2) The youngest age gr
oup which can be r
ecognized as having the ability to live independently is 20s.
(3) T
o delete the influence of “noise” values, e.g. in r
ural ar
eas with a significantly high pr
opor
tion of elderly population, we only selected the
Oaza units with a population density over 1000 people per squar
e kilometer (consider
ed as an urbanized ar
ea).
(4) The development period of Newtown was deter
mined by the star
t year of constr
uction and the finish year
. Sour ce : National Census, 2010 National L
and Numerical Infor
Table 3 Age Structure by Development Period in 2010 Sapporo
Development
Period 0s 10s 20s 30s 40s 50s 60s 70s + Total over 65
Approx. Radius of DID Area (km) before 1960 6.5% 7.7% 16.5% 17.2% 14.5% 12.5% 11.9% 13.1% 100% 18.2% 4.5 1960s 7.4% 8.5% 12.3% 15.5% 14.0% 13.2% 13.7% 15.3% 100% 21.4% 6.1 1970s 7.7% 9.2% 9.7% 13.6% 12.8% 13.5% 16.6% 16.9% 100% 24.2% 8.3 1980s 7.1% 10.0% 11.1% 12.1% 12.4% 16.4% 16.5% 14.4% 100% 21.0% 9.3 1990s 8.5% 13.7% 10.7% 12.0% 15.9% 16.7% 12.0% 10.6% 100% 15.2% 9.8 2000s 17.4% 14.2% 7.5% 20.6% 16.9% 9.0% 7.5% 6.7% 100% 9.9% 10.0 Sendai Development
Period 0s 10s 20s 30s 40s 50s 60s 70s + Total over 65
Approx. Radius of DID Area (km) before 1960 7.2% 9.2% 17.5% 15.8% 13.7% 12.5% 10.9% 13.1% 100% 17.7% 3.7 1960s 8.2% 9.6% 13.7% 15.2% 13.4% 12.3% 12.1% 15.6% 100% 21.1% 4.8 1970s 8.6% 10.0% 11.5% 14.7% 13.1% 12.0% 14.0% 16.0% 100% 22.7% 6.2 1980s 8.6% 10.3% 11.5% 14.9% 12.3% 13.9% 16.2% 12.3% 100% 19.1% 7.0 1990s 10.0% 11.7% 13.0% 15.9% 14.6% 14.6% 11.0% 9.2% 100% 13.6% 7.6 2000s 16.8% 15.4% 6.7% 19.4% 18.1% 13.8% 9.0% 0.7% 100% 3.9% 7.8 Hiroshima Development
Period 0s 10s 20s 30s 40s 50s 60s 70s + Total over 65
Approx. Radius of DID Area (km) before 1960 8.2% 8.6% 12.2% 15.5% 13.5% 12.3% 13.9% 15.8% 100% 22.0% 4.9 1960s 10.1% 10.1% 11.9% 16.5% 14.0% 11.5% 12.6% 13.3% 100% 19.0% 6.0 1970s 10.2% 10.3% 10.5% 15.6% 13.4% 11.6% 14.5% 14.0% 100% 20.6% 7.3 1980s 8.7% 10.0% 10.0% 13.3% 12.0% 14.3% 17.3% 14.4% 100% 21.8% 8.0 1990s 13.8% 16.6% 13.9% 17.8% 17.9% 13.2% 6.2% 0.6% 100% 2.8% 8.1 2000s 19.0% 17.5% 4.0% 16.7% 18.2% 11.6% 10.4% 2.5% 100% 6.8% 8.1 Fukuoka Development
Period 0s 10s 20s 30s 40s 50s 60s 70s + Total over 65
Approx. Radius of DID Area (km) before 1960 7.7% 8.6% 16.9% 17.8% 14.4% 12.3% 11.0% 11.2% 100% 15.7% 4.8 1960s 9.3% 10.3% 12.4% 15.3% 13.6% 12.9% 12.7% 13.5% 100% 19.0% 6.1 1970s 9.8% 10.3% 11.7% 15.2% 12.8% 12.6% 13.9% 13.7% 100% 19.9% 8.6 1980s 10.1% 10.3% 11.9% 15.1% 12.5% 13.4% 14.4% 12.4% 100% 18.4% 9.4 1990s 10.8% 12.8% 11.4% 14.5% 14.5% 14.9% 12.2% 8.9% 100% 13.7% 9.8 2000s 17.4% 15.4% 7.9% 17.8% 16.8% 11.8% 7.8% 5.0% 100% 7.9% 10.1
ple in their 40s and 50s. The newly built up areas after 2000 are inhabited mainly by people in their 30s and 40s, and by children in their 10s (Table 4). Furthermore, people in their 30s con-stitute a larger share than other age groups in the four cities because they are the child genera-tion of baby boomers. Elderly populagenera-tions are most likely concentrated in the areas built dur-ing 1970s, except in Hiroshima city.
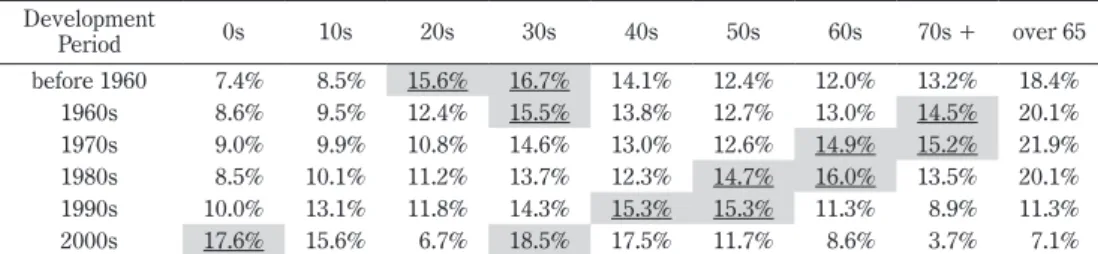
It might be inferred that the main inhabitant’s age group in each urbanized area is corre-lated strongly with the developed period of the area. This regularity determined the spatial pattern of segregation by age. Otherwise, when we consider why it occurred, three hints will be apparent from the data. First, the residents’ remaining rate is high. When we specifically examine the areas developed in the 1970s, more than 30% of people in their 60s and people in their 70s and older population still reside there : over 30% of residents did not move from the area after 40 years, assumed there was no inflow movement happened. Secondly, the age structure shows a lack of balance. It is apparent that newly developed areas after 2000 are inhabited primarily by people in their 30s, people in their 40s, and their children’s genera-tions. This situation might not differ in other areas at the beginning of development period. Thirdly, population exchanges among different areas rarely occur. Excluding the inner city, part of 30s and 40s flow in the redeveloped areas after 1990. Therefore, changes in the age structure occurred once with a high proportion of elderly population in the 1970s and 1980s reported by the previous studies (Kagawa, 1987 ; Kagawa, 1990 ; Tanabe and Hasegawa, 1982). In other areas distant from the city center, it was difficult to find population exchange, except in some neighborhoods near subway stations (Feng and Isoda, 2015). As a result, resi-dential segregation by age groups in Japanese cities is caused mainly by low household mobility. Average Development Period 0s 10s 20s 30s 40s 50s 60s 70s + over 65 before 1960 7.4% 8.5% 15.6% 16.7% 14.1% 12.4% 12.0% 13.2% 18.4% 1960s 8.6% 9.5% 12.4% 15.5% 13.8% 12.7% 13.0% 14.5% 20.1% 1970s 9.0% 9.9% 10.8% 14.6% 13.0% 12.6% 14.9% 15.2% 21.9% 1980s 8.5% 10.1% 11.2% 13.7% 12.3% 14.7% 16.0% 13.5% 20.1% 1990s 10.0% 13.1% 11.8% 14.3% 15.3% 15.3% 11.3% 8.9% 11.3% 2000s 17.6% 15.6% 6.7% 18.5% 17.5% 11.7% 8.6% 3.7% 7.1%
Note : (1) Scope of statistics was defined as the 30 km buffer area from each city’s center rail station (in this study, we chose Sapporo Station, Sendai Station, Hiroshima Station, and Tenjin Station).
(2) The top two age groups in each area are highlighted in yellow.
Data source : National Census, 2010. Table 3 Continued
4. Regularity of neighborhood change 4.1 Transfer rule of neighborhood change
One more research objective in this study is to bridge the gaps between residential segre-gation and neighborhood change. In this study, we examine the alteration of a dominant age group in an Oaza tract as a neighborhood change. We conducted a time-series analysis to
ascertain the character of the neighborhood changes in the four cities. We used the national population census in year 2000, and mapped of the residential segregation in 2000, in the same way as in Figure 1. Therefore, we can monitor the change of dominant age group in 10 years at the same Oaza unit9). Figure 2 shows that neighborhoods dominated by 20s in 2000 were
also dominated by the same age group in 2010, a few of them transfer to 30s-dominated
neighborhoods ; people in their 30s, 40s, 50s, and 60s who dominated neighborhoods in 2000 are almost transferred to domination by people in their 40s, 50s, 60s, and people in their 70s and older, respectively, i.e. these neighborhoods are “aging in place.” It must be emphasized that over 20% of 70s and older dominated neighborhoods were transferred to younger neighbor-hoods from 2000 to 2010, except those which are “aging in place”. We can find most of these transferred neighborhoods are resided in inner city areas with good accessibility.
We conclude that except for most 20s and a part of 30s dominated neighborhoods (mostly rental apartments in the inner city), the neighborhood change in the urbanized area occurred mainly at the same places through the change of dominant cohort.
Figure 2. Neighborhood change during 2000-2010. Note : (1) All figures are total numbers for four cities.
(2) Number in ( ) is the number of neighborhoods, the same as the Oaza units in this study. Source : National Census, 2010
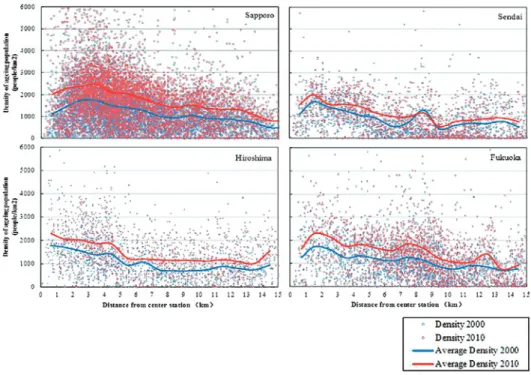
4.2 Spatial structure of aging
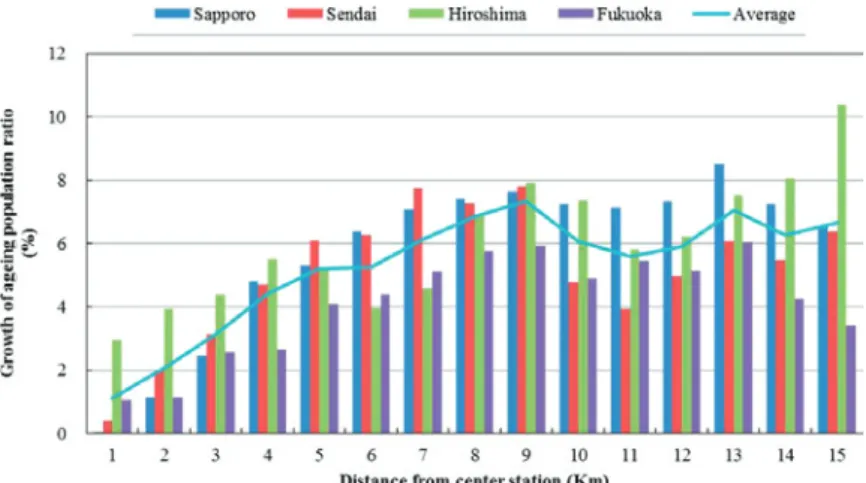
Using national population census data for 2000 and 2010, we sketched the density gradient of elderly population (over 65 years old) in the four cities (Figure 3). Compared with the year 2000, the density of elderly population in the year 2010 saw a general upward trend. However, the location of peak values and the overall trend of the average density curve did not change too much in these 10 years. Therefore, “aging in place” is a major feature of the spatial structure of aging. In addition, according to the distribution of elderly population rate change shown in Figure 4, the peak of growth is mainly distributed in the area of 8-9 km from the city center,
most of these areas are Newtowns in inner suburbs developed in the 1960s and 1970s (Figure 1). Consequently, according to the features of residential segregation by age groups we figured out in the previous sections, we can infer that the spread of aging neighborhoods from inner sub-urbs to outer subsub-urbs in the future, which echoes that of Ishimizu (1981) and Konagaya (2002).
Figure 3. Density of elderly population during 2000-2010. Note : Calculations were based on Chochomoku units. Source : National Census, 2000, 2010
4.3 Spatial pattern of neighborhood change
Section 4.1 only described the transfer rule of neighborhoods dominated by different age groups. This section includes specific examination of their spatial characteristics. Figure 5 depicts the spatial trend of neighborhood change. The following observations were made : (1) in these 10 years, the shares of neighborhoods being dominated by people in their 20s, 30s, 40s, and 50s are becoming increasingly numerous in the core areas (about 0-3 km from center
sta-tion), while people in their 60s and people in their 70s and older are decreasing. (2) The share of neighborhoods being dominated by people in their 60s are growing in outer suburbs, whereas people in their 70s and older are becoming more numerous in the inner suburbs. We can infer that younger neighborhoods are gradually occupying the city core area, whereas aging neighbor-hoods are gradually moved away from the city center and spreading outward. The transfer rule we showed in section 4.1 and the spatial pattern of neighborhood change indicated the reg-ularity of neighborhood change, i.e. the renewal of the neighborhood first occurred in the center areas and then spreads out until the neighborhood is dominated from an elderly to a young pop-ulation, represented as a series of replacement processes between the young population and elderly population.
Figure 4. Changes in elderly population during year 2000-2010. Note : Calculations were based on Chochomoku units. Source : National Census, 2000, 2010.
5. Conclusions
We observed phenomena related to residential segregation by age groups in all the four regional central cities in Japan : Sapporo, Sendai, Hiroshima, and Fukuoka. The spatial pat-tern of segregation is closely related with the development period of urban area in the time dimension, as well as closely related with the distances from city center in the spatial dimen-sion. In general, the spatial pattern of segregation shows a roughly concentric shape at the current stage. The city center and surrounding areas developed before the 1960s are mainly occupied by people in their 20s and 30s, and partly by elderly population, which collectively dominate the neighborhoods. The inner suburbs developed during the 1960s and 1970s are mainly occupied by elderly people, who settled in the neighborhoods when they were at age 30s and 40s. The outer suburbs developed during 1980s and 1990s as neighborhoods mainly
pied by people in their 40s, 50s, and 60s. In the peripheral areas of the cities are newly devel-oped residential areas occupied by people in their 30s and 40s and their child generations.
The residential segregation by age groups can be explained by the of intra-city household
immobility. Through analysis of the national population census of year 2000-2010, we
discov-ered that excluding the neighborhoods dominated by people in their 20s and 30s, over 70% of neighborhoods are “aging in place.” Unlike with western countries, the intra-city household
immobility has determined the regularity of neighborhood change in Japanese cities. There-fore, the identity (or status) of neighborhoods is closely related to the life stage of the dominant age group. Age, as an important indicator of the life stage (such as marriage, birth of child, independence of children, retirement, etc.) will strongly influence the neighborhood identity.
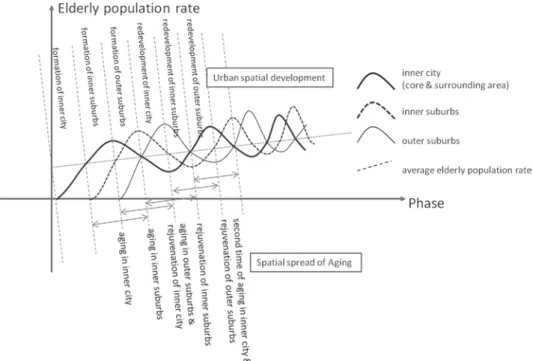
More importantly, occupation of space by individual age groups and the regularity of neigh-borhood change leads to two inferences. The spatial structure of aging will spread out from
Figure 6. Conceptual model of the spatial structure of neighborhood aging and renewal.
Note : We assume that no ennormous immigration will hapen, the population decline will con-tinue, and the average elderly population rate in urban area willgradually growing.
(1) the spatial spread of aging is following the same process of urban spatial development ; (2) aging will happen independently in inner city, inner and outer suburbs ;
(3) aging and rejuvenation appear alternately, but degree of aging will be higher than the previous phase and rejuvenation will be weaker than the previous phase.
city center to suburbs. The other is the renewal of neighborhood (change of dominant age group) also expand from city center to the outskirts. However, the update cycle will vary from area to area, which is beyond the scope of this study. According to the above conclusions, we explore the model of spatial structure of aging and renewal of neighborhood formulated by the phenomenon of residential segregation by age groups (Fig. 6).
Note
1) According to Finsterbusch (1980), the concept of community cohesion refers to the amount and qual-ity of social relations and interactions in a neighborhood and to attraction to or identification with the area.
2) The existence of distinctive socio-spatial urban subcultures is the result of the process of segregation and congregation of groups in the city (Pacione, 2009, pp. 377).
3) Tokyo (Yano et al., 1990), Nagoya (Saino, 1989), Osaka (Takayama, 1983), Kyoto (Kagawa, 1991), Fukuoka (Naganuma et al., 2008 ; Saino, 1992), Sapporo (Saino, 1990), Hiroshima (Yui, 2003), Sendai (Ito, 2010), Okayama (Mori, 1997), and Kanazawa (Kagawa, 1990).
4) Sapporo is located in the Hokkaido Region. Sendai is located in the Tohoku Region. Hiroshima is located in the Chugoku Region. Fukuoka is located in the Kyushu Region.
5) The respective populations in Sapporo, Sendai, Hiroshima, and Fukuoka municipal areas are 1.9, 1.0, 1.1, and 1.5 million in 2010. The respective populations in the metropolitan area (in this study areas covered 30 km from center station) are 2.3, 1.6, 1.8, and 2.9 million in 2010.
6) So-called Cities Designated by Government Ordinance have been established since 1956 : they are cities that have a population greater than 500,000 and which have been designated as such by an order of the cabinet of Japan under Article 252, Section 19 of the Local Autonomy Law. Designated cities are delegated many of the functions normally performed by prefectural governments in fields such as public education, social welfare, sanitation, business licensing, and urban planning. The city govern-ment is generally delegated the various minor administrative functions in each area, whereas the pre-fectural government retains authority over major decisions. Sapporo, Sendai, Hiroshima, and Fukuoka respectively became designated city in 1972, 1989, 1980, and 1972.
7) Oaza consists of Chochomoku units. Each Oaza and Chochomoku has a unique code and the code of Oaza and Chochomoku share the same first nine digits. The Chochomoku units which belong to the same Oaza were merged to Oaza units in GIS platform.
8) Densely Inhabited Districts are the urban areas that are designated based on statistical data and which meet the following criteria, and which have been designated in each survey since the 1960 Population Census of Japan.
1) A district containing basic unit blocks, etc. with a population density of 4,000 and more per square kilometers, such districts are mutually adjacent in a municipality
2) A district consisting of the above adjacent basic unit blocks, etc. with population is 5,000 and more at the time of the Population Census of Japan. (Statistics Bureau, Ministry of Internal Affairs and Communications)
http://www.stat.go.jp/english/data/chiri/did/1-1.htm
9) Our analysis was based on 2010 Oaza units because the coverage area of some census tracts differed in 2000 and 2010. We unified the census tract first through transforming procedures in GIS platform.
Acknowledgements
I would like to express deepest gratitude to my supervisor Associate Professor Isoda Yuzuru for his sup-port, guidance, and encouragement throughout this study. In addition, I express my appreciation to Professor Hino Masateru for precious advises and patience ; also Professor Sakaida Kiyotaka, Sekine Ryohei Sensei, their thoughtful questions and comments were valued greatly.
References (* in Japanese with English abstract, ** in Japanese) Booth, C. (1902) : Life and Labour of the People in London. London : Macmillan. Castells, M. (1997) : The Power of Identity. Oxford : Blackwell.
Downs, A. (1981) : Neighborhoods and Urban Development. Washington DC : Brookings Institution. Duncan, O.D. and Duncan, B. (1955) : A Methodological Analysis of Segregation Indexes. American
Sociological Review, 20(2), 210-217.
Feng, L. and Isoda, Y. (2015) : The Possibility of Building Compact City through Transit Investment- Les-sons from Japanese City. Proceedings of International Conference on Urban Planning, Transport and
Construction Engineering, 342-348.
Finsterbusch, K. (1980) : Understanding Social Impacts. London : Sage.
Fukuhara, M. (1998) : Newtown no ima : 40 nenme no yume to genjitu**. Tokyo shinbun
Shuppan-kyoku.
Hoover, E. and Vernon, R. (1962) : Anatomy of a Metropolis. New York : Doubleday. Ishimizu, T. (1974) : The Theories on urban spatial structure**. Tokyo : Taimeido, Inc.
Ishimizu, T. (1981) : Kourei jinkouka katei ni okeru daitoshi chiiki**. Sakada, A. eds. : Ashita no daitoshi
19 Daitoshi to daitoshiken mondai : 142-159. Chuohoki Publishing Co. Ltd.
Ito, S. (2010) : Population Aging in Residential Estates of Detached Houses in Sendai City*. Geographical Review of Japan Series A, 83(5), 510-523.
Kagawa, T. (1987) : The Areal Distribution of Aging Phenomenon in the City : For Each of the Central
Cities in the Six Prefectures of Tohoku Region*. Japanese Journal of Human Geography, 39(4), 76-90.
Kagawa, T. (1990) : Aging and Population Change in Kanazawa City*. Annals of The Tohoku Geographycal Asocciation, 42(2), 89-104.
Kagawa, T. (1991) : Kyotoshi ni okeru jinkou koureika no shosou : bunpu to shinten no chiikisa**. Geo-graphical Sciences, 46(3), 158-163.
Kinjyo, M. (1983) : Newtown chiiki no nenrei kousei no henka to sono youin : senri to senboku no jirei
kara**. Japanese Journal of Human Geography, 35(2), 171-181.
Koizumi, R., Nishiyama, H., Kubo, T., Kukimoto, M. and Kawaguchi, T. (2011) : New Dimensions of
Housing Acquisition in the Tokyo Bay Area : Skyscraper Condominium Residents in Toyosu*.
Geo-graphical review of Japan Series A, 84(6), 592-609.
Konagaya, K. (2002) : Daitoshiken richi kouzo no saihen to 21 seiki keihanshin toshiken no syouraizou**.
Kodama, T. eds. : New Strategy for Metropolitan Restructuring : 29-48. University of Tokyo Press.
Kubo, T. and Yui, Y. (2011a) : Transformation of the Housing Market in Tokyo since the Late 1990s :
Housing Purchases by Single-person Households. Asian and African Studies, 15(3), 3-21.
Kubo, T. and Yui, Y. (2011b) : Diversification of the Condominium Supply in Central Tokyo : Supply
Strat-egies of “Compact” Condominiums*. Geographical Review of Japan Series A, 84(5), 460-472.
Lieberson, S. (1981) : An Asymmetrical Approach to Segregation. Peach, C., Robinson, V. and Smith, S.
eds. : Ethnic Segregation in Cities : 61-82. London : Croom Helm.
Studies, 84, 65-87.
Massey, D.S. and Denton, N.A. (1988) : The dimensions of residential segregation. Social Forces, 67(2),
281-315.
McKenzie, R.D. (1933) : The metropolitan community. Reissued. 1967, New York : Russell & Russell. MIAC (2014) : Statistics Bureau, Ministry of Internal Affairs and Communications.
MLHW (2000) : Ministry of Labour, Health and Welfare : White Paper, Annual Report on Health and
Wel-fare.
Miyazawa, H. and Abe, T. (2005) : Recovery and Changes in the Socioeconomic Composition of
Popula-tion in the Central Area of Tokyo during the Period from 1995 to 2000 : Analysis of Small-area Cen-sus Data*. Geographical review of Japan Series A, 78(13), 893-912.
MLIT (2014) : Ministry of Land, Infrastructure, Transport and Tourism. http://www.mlit.go.jp/policy/tyu
kozyutaku.html.
Mori, T. (1997) : Toshiiki ni okeru jinkou koureika no kukansoshiki : Okayama shi no jirei**. Ritsumei-kan chirigaku, 9, 1-15.
Naganuma, S., Arai, Y. and Ezaki, Y. (2006) : The Aging Population in the Suburbs of Metropolitan
Tokyo*. Japanese Journal of Human Geography, 58(4), 399-412.
Naganuma, S., Arai, Y. and Esaki, Y. (2008) : Population Aging and Sustainability of Residential Areas in
the Suburbs of a Major Core City : Case Study of Fukuoka*. Annals of The Association of Economic
Geographers, 54(4), 310-326.
Nakazawa, T. and Kawaguchi, T. (2001) : The Residential Careers of People from the Nonmetropolitan
Area within the Tokyo Metropolitan Area—A Survey of Graduates of High Schools in Nagano Pre-fecture*. Geographical Review of Japan Series A, 74(12), 685-708.
Newcomb, C. (1957) : Graphic presentation of age and sex distribution of population in the city. Hatt, P.K.
and Reiss, A.J. Jr. eds. : Cities and society : 382-392. Free Press of Glencoe, Illinois.
NIPSSR (2014) : National Institute of Population and Social Security Research**.
http://www.stat.go.jp/data/topics/topi841.htm.
Okui, F. (1940) : Gendai daitoshiron. Yuhikaku Publishing Co., Ltd.
Omichi, A. (1966) : Gendai daitoshi no syomondai : syowa 39 and 40 nendo kenkyu houkoku**. Eds. :
Japan Center for Area Development Research : 179-184.
Pacione, M. (2009) : Urban geography a global perspective (3rd edition). London and New York : Routledge
Taylor & Francis Group.
Robson, B.T. (1973) : A view on the urban scene. Chisholm, M. and Rodgers, B. eds. : Studies in human
geo graphy : 203-241. London : Heinemann Educational.
Rossi, P. (1955) : Why Families Move. New York : Free Press.
Sakakibara, S., Matsuoka, K. and Miyazawa, H. (2003) : Characteristics of Condominium Residents in
the Center of Sendai and their Residential Preferences for City Center*. Annals of The Tohoku
Geographycal Asocciation, 55(2), 87-106.
Saino, T. (1989) : On the Spatial Pattern of Aging in Nagoya City*. Annals of The Tohoku Geographycal Asocciation, 41(2), 110-119.
Saino, T. (1990) : Some Geographical Consideration of Aging of Population in Sapporo City*. Annals of The Tohoku Geographycal Asocciation, 42(2), 105-110.
Saino, T. (1992) : Some Geographical Consideration of Aging of Population in Fukuoka City*. Quarterly Journal of Geography, 44(2), 29-36.
Shevky, E. and Bell, W. (1955) : Social Area Analysis Stanford. CA : Stanford University Press. Sonoda, M. (2010) : Solutions and Strategies to manage and re-invest real estate owned by elderly people
at suburb**. The Japanese journal of real estate sciences, 23(4), 46-53.
Takayama, M. (1982) : Inner city housing problems in the Osaka Metropolitan Region*. Japanese Journal of Human Geography, 34(1), 53-68.
Associ-ation of Economic Geographers, 29(3), 182-203.
Tanabe, K. and Hasegawa, T. (1982) : Jikken toshi Sendai : toshi tirigaku kenkyu no kadai. Daimeido. Tani, K. (1997) : An Analysis of Residential Careers of Metropolitan Suburbanites : A Case Study of Kozoji
New Town in the Nagoya Metropolitan Suburbs*. Geographical Review of Japan Series A, 70(5),
263-286.
Temkin, K. and Rohr, W. (1996) : Neighborhood change and urban policy. Journal of Planning Education and Research, 15(3), 159-170.
Tomita, K. (2004) : Recent changes of population in the central district of major cities in Japan**. Studies in The Humanities, 55(3), 113-140.
Watanabe, Y. (1978) : Daitoshi kyojyu to toshi naibu jinkou idou**. Comprehensive urban studies, 4,
11-35.
Yabe, N. (2003) : Population recovery in inner Tokyo in the late 1990s : A questionnaire survey in Minato
Ward*. Japanese Journal of Human Geography, 55(3), 277-292.
Yamagami, T. (2003) : Spatiotemporal Structure of Population Growth in Major Metropolitan Areas in
Japan*. Geographical Review of JapanS eries A, 76(4), 187-210.
Yano, K., Akiyama, T. and Mochizuki, T. (1990) : Change in the Spatial Distribution of Elderly
Popula-tion in Tokyo Between 1975 and 1980 : Using Grid Data From Census*. Comprehensive Urban
Studies, 39, 161-183.
Yui, Y. (2003) : Changing Characteristics of Public Housing Dwellers in Hiroshima City. Geographical Review of Japan Series B, 76(5), 333-348.
Yui, Y. (2006) : Purchase of condominiums by single women and their backgrounds in Tokyo : Housing