1 Division of Spatial Information Sciences
Graduate School of Life and Environmental Sciences University of Tsukuba
1-1-1 Tennodai, Tsukuba, Ibaraki 305-8572 Japan Tel: +81(29)853-5694 Fax:+81(29)851-6879 Email: [email protected]
Detecting urban land use/cover change using satellite imageries: a case study of the Kathmandu metropolitan area, Nepal
Rajesh Bahadur THAPA, Yuji MURAYAMA
Abstract: This manuscript explores the temporal and spatial characteristics of urban land use/cover change in the Kathmandu metropolitan area employing remote sensing and GIS techniques. The change detection result shows that the land uses/covers are changed dramatically. The urban structures are built in additional 1629 hectare of land in the past one and half decades. The conversion matrix shows that the cultivated and orchard lands are mostly transformed to urban uses. The land use change in the city is governed by the urban expansion. The trend of urbanization in the metropolitan area is observed around the fringes of the urbanized territory.
Keywords: Land use, change detection, urbanization, Kathmandu, Nepal
1. Introduction
Understanding the dynamics of complex urban systems and solving the real world problems necessitate robust method and technologies for urban resources mangers. Remote sensing provides an efficient tool to monitor land use/cover changes in and around urban areas since the past three and half decades. With time series satellite data we can monitor long-term changes. GIS provides a framework for spatial analysis and modeling based on geographic principles and seeks to integrate the analytical capabilities to broaden the understanding of the real world system.
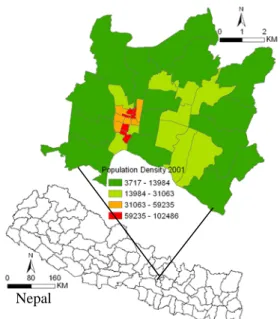
High population influx (Figure 1) and uncontrolled momentum of urban sprawl may cause a serious pressure to the limited resources with adverse impact to the environmental conditions and livelihoods of inhabitants in the Kathmandu valley. The main objective of this paper is to detect the urban land use/cover change in
Kathmandu metropolitan area applying remote sensing and GIS techniques.
Figure 1: Study area – population density per square km.
Kathmandu Metropolitan City
2. Method
In this study, three remote sensing images (Table 1), two from Landsat and one from IRS satellites, were processed for identifying the changes in urban land
Nepal
2 use/cover patterns. In order to avoid the influences of cloud cover and seasonal variances, the images are selected from same season (winter).
Table 1: Database description
Satellites Date Resolution
Landsat TM 31-10-1989 30 meters, 6 channels Landsat ETM 04-11-1999 30 meters, 6 channels IRS LISS III 18-12-2005 24 meters, 4 channels
The images were processed using ERDAS Imagine 9.0 software. A GIS road layer was prepared for the metropolitan area using 1:25000 scale topographic maps obtained from Survey Department, Nepal. This road map was employed for rectifying the geometric distortions in the images. Sixteen evenly distributed control points were trained for the rectification process. In order to compute the change by pixel, the LISS III image was resampled from 24-meter to 30-meter as same resolution of Landsat images. The UTM, WGS84 N45 projection system was applied. The images were further subset to 10x10 km covering the whole Kathmandu metropolitan city.
Different land use categories were prepared based on NDVI index (eq.1) analysis, unsupervised classification (ISODATA algorithm), knowledge-based visual interpretation, and texture and association analysis. The land use/cover classes specified in the study are urban builtup area, cultivated land, orchard, water and natural vegetation. The urban builtup area class covers the commercial and residential houses, road and other urban structures. The land covered by the basic agriculture such as paddy, maize, vegetables, etc are categorized into cultivated land. The orchard indicates the gardening near by the urban houses, horticulture, parks and bare land.
Supervise classification technique with maximum likelihood classifier was implemented while preparing the thematic urban land use/cover map for 1989, 1999 and 2005. The 3x3 majority kernel filter was used in
order to remove salt and pepper noises in the classified maps.
+1
⎥⎦
⎢ ⎤
⎣
⎡ +
= −
R NIR
R
NDVI NIR
λ λ
λ
λ
..…….. (eq. 1)Note:
λ
= wavelength, NIR= near infra red R = redHundred random spatial points were created for each thematic map for accuracy assessment. The geographic random points were further verified with aerial photos, IKONOS image acquired in 2000 and LISS IV image acquired in 2005. The overall accuracy (eq. 2) of classification results are 91% (K=0.87), 92% (K=0.88) and 91% (K= 0.86) for the year 1989, 1999 and 2005, respectively.
q N
q d
−
= −
κ
………. (eq. 2)Where, K= kappa index
d = total along the major diagonal q = sum (row total × column total) N = total number of points
Land use conversion matrix was computed for analyzing detailed land use change patterns in the study area. The matrix is a useful tool which has been widely accepted in land use change analysis.
3. Results and discussion
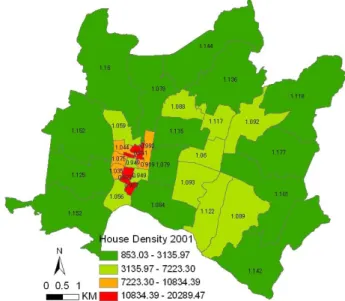
The Figure 2 and Figure 3 present the environmental changes in respect to the vegetation, agriculture and urban activities. The high score of the NDVI represents the majority of the vegetation existence. The coefficient of the index shows rapid decreasing trend of vegetation in the last decade, in turn the housing data shows extreme increasing trend in the corresponding areas. The result reflects that the vegetation and agriculture related land uses are being replaced by the urban built environment.
The Figure 4 presents the land use/cover maps (a, b, c) and changing patterns of the land uses at quantitative
3 level (d) for the year 1989, 1999 and 2005. The figure explains that the coverage of urban built up area was small until 1989 as compared to other land use/covers. In later years, major construction works are being made in the city, therefore, the urban built up area is largely expanded over the cultivated and orchard lands which resulted many environmental problems as we discussed earlier.
For detecting landscape changes quantitatively, a land use/cover conversion matrix (Table 2) is computed between the year 1989-1999 and 1999-2005. In matrix analysis, each pixel for the first year was compared to the same pixel location in the second year. The most obvious changes are the conversion of orchard and cultivated land to urban [1675.3 ha, 1284.6 ha land was commissioned during the period of 1989-1999 and 1999-2005, respectively]. It seems the areas classified as orchard near by the houses are converted to the urban structures significantly.
A mutual land conversion is observed between the orchard and cultivated land, for example, 1011 hectare of orchard land is transformed to cultivated land during the period of 1989 to 1999 then in later years, the cultivated land is used for orchard. About 111 hectare of natural vegetation area is also consumed for the urban construction during 1999. The rate of the natural vegetation acquisition is found lower in later years. The water areas are also become duly dry. It may be due to collapse of many aquatic functions, such as fish ponds in Balaju area. Some hectare of urban lands is transformed to other land uses but the proportion is very low.
However, additional 1629 hectare land has been urbanized during the last 15 years where the cultivated land lost 1374 hectare. Constructing commercial and residential houses in the Kathmandu city are widely observed after restoration of democracy (Figure 2). The rate of urban fringes shaping to urban is escalating faster and faster.
4. Conclusion
The paper is able to identify the urban expansion thematically and accurately. The remote sensing and GIS based methodology have detected the land use/cover changes over the past one and half decades in the Kathmandu metropolitan area. The trend of urban expansion in the capital is found around the fringes of the urbanized periphery. Since 1989, the urban built environment is further stretched by additional 1629 hectare whereas 1374 hectare of cultivated land has been diminished.
Figure 2: NDVI (1989) and house density per square km
Figure 3: NDVI (1999) and house density per square km Note: The numbers in the both maps are NDVI score.
4
a) Land use patterns 1989 b) Land use patterns 1999
Land use change in Kathmandu Metro
0 1000 2000 3000 4000 5000
1989 1999 2005
Year
Hectare
Urban Builtup Area Cultivated Land Orchard
Water Natural Vegetation
d) Land use change between 1989 and 2005 Urban Builtup Cultivated Land
Orchard Water Natural Vegetation
c) Land use patterns 2005 Kathmandu Metropolitan City Boundary
Figure 4: Land use and land cover map of the Kathmandu metropolitan area during 1989-2005 (Area: 10x10km, 100km2)
Table 2: Land use conversion matrix of the Kathmandu metropolitan area between 1989 and 2005 (hectare)
1999 2005 Class 1989
Total 1 2 3 4 5 Total 1 2 3 4 5 Total
1 2639.8 1999.9 354.8 238.1 31.2 15.8 3809.7 2948.6 170.8 614.4 17.9 58.0 4268.9 2 3311.2 497.4 2069.4 713.2 14.4 16.8 3523.8 885.6 1292.1 1330.7 0.9 14.4 1933.3 3 3363.5 1177.9 1010.6 1111.7 24.8 38.4 2350.9 399.0 456.8 1364.2 2.2 128.7 3406.3 4 84.7 23.6 14.7 18.0 27.2 1.3 148.0 28.9 10.7 50.9 10.8 46.6 33.4 5 1116.8 110.9 74.3 270.0 50.3 611.3 683.6 6.8 2.8 46.0 1.6 626.4 874.1 Note: 1) Urban builtup area, 2) Cultivated land, 3) Orchard, 4) Water, and 5) Natural vegetation