IPSS Discussion Paper Series
National Institute of Population and Social Security Research Hibiya-Kokusai-Building 6F 2-2-3 Uchisaiwai-Cho
Chiyoda-ku Tokyo, Japan 100-0011 (No.2005-07)
Empirical Analysis of Relative Deprivation and Poverty in Japan
Aya Abe
(National Institute of Population and Social Security Research)
March, 2006
IPSS Discussion Paper Series do not reflect the views of IPSS nor the Ministry of Health, Labor
and Welfare. All responsibilities for those papers go to the author(s).
Empirical Analysis of Relative Deprivation and Poverty in Japan*
Aya Abe National Institute of Population and Social Security Research
1. Introduction
In Europe and the US, the attempts to scientifically measure poverty have become an established task of researchers. Many countries publish official poverty rates using large scale survey data, and use the statistics to examine the current economic status of the nation. However in Japan, even though the Ministry of Health and Welfare (now the Ministry of Health, Labor and Welfare) have published the low-income rate up until the 1960s, attempts to calculate the poverty and take-up rate of social assistance have been scant and disjoint. This is mainly due to inaccessibility to large scale survey data to researchers and also to a false sense of assurance that poverty, as we know it, has been eradicated in contemporary Japan. However in recent years, the debate on the economic inequality has renewed the interests in poverty studies. Social policy scholars have calculated the poverty rate and the take-up rate of public assistance (Hoshino & Iwata, 1994; Abe, 2005; Komamura, 2005 to name a few). However, these studies share some common limitations. One such limitation is that, even though the researchers are quite aware of the multi-dimensional nature of poverty, most of these studies used only monetary measurement of poverty, namely income or consumption level of a household. As many authors have pointed out, standard of living is determined by more than one dimension; e.g. amount of savings amassed from past incomes as well as properties (home ownership, etc.), labor resources (education, talent, health condition, etc.) and accumulation of human relationships. While the low income is one dimension of poverty, it does not in itself indicate the phenomena of poverty. The phenomena of poverty emerge in all aspects of life, including consumption, housing and social relationships. Therefore, low income, especially the current income, does not always indicate poverty6. Even so, most of the researchers were bound to use income or consumption data due to data limitation and the lack of
* The views and opinions expressed in the article are entirely of the author’s, and do not reflect the views and opinions of the Institute or the Ministry of Health, Labor and Welfare.
6 A typical case is the elderly after retirement. Though their pension income is low, some of the elderly can maintain a high standard of living by using the savings and property they have accumulated.
clear definition on other dimensions of poverty.
The second problem is the adequacy of the poverty standard (i.e. poverty line).
Most of the Japanese studies of poverty rates have made use of statistically calculated standards such as 50 % of the sample’s median value (Hoshino & Iwata, 1994; Wada &
Kimura, 1998; Abe, 2005) or the public assistance standard established by the government (hereafter referred to as “public assistance standard”) (Hoshino, 1995;
Ogawa, 2000; Yamada, 2000; Hamamoto, 2005). The former is the formulation of the relative poverty concept, which states that individuals require a certain level of living relative to the standard of living of the entire society in order to live “without feeling shame” within that society. However, those dubious about the relative concept of the poverty have pointed out that using this method, the poverty line rises in accordance with a rise in the standard of living of the entire society and, in an international comparison, different poverty lines are used for different countries. Their claim is that the concept of the relative poverty is essentially the same as the concept of inequality and it does not indicate the distress7. The public assistance standard adopted in the latter is stipulated by the government as the minimum cost of living, and it is used to determine the eligibility of the public assistance by comparing it against the current income of the applicant. It is the closest to the Japanese official poverty line.
However, it is not the sole determinant of the eligibility of getting the public assistance.
Other requirements such as the amount of savings and the ability of getting a job in the labor market, and the availability of family and relatives who may provide help are all considered before determining the eligibility. The underlying idea is that not all households with incomes less than the standard are in distress. The public assistance standard is calculated to be approximately 70% of the consumption expenditure of an average worker’s household, following the Standard Equilibrium Method8 adopted in
7 For example, see “Overview of the Discussion at the Workshop for Social Security for the Households with Children”, Kosodate Sekai no Shakai Hosho,. p.310. The
countervailing concept of relative poverty is the absolute poverty which uses a fixed poverty line either multilaterally or chronologically (such as “1 dollar per day”). Its determination of the poverty line is based on constant criteria guided by concepts such as the basic human needs (e.g. to obtain the required calories for survival). However, the prices for, and the package of, basic human needs vary from a country to a country, and from one time to another time. Thus, there is an argument that the absolute is also a relative concept. The relative poverty concept is more often used for countries other than developing countries.
8 The public assistance is used in two ways. First, it is used to determine the eligibility.
The household’s income is compared against the standard. Second, the amount of public assistance amount is determined as the difference between the public assistance standard and the household income. calculation of the public assistance standard has
1984, which is based on the idea that “the minimum standard of living that should be guaranteed by the public assistance system should be treated in a relative manner in connection with the standard of living among the general public” (Hogo no Tebiki Heisei 15 (2003) edition, p.41). In other words, the public assistance standard is also based on the concept of relative poverty so that the criticism mentioned above is equally applicable to it. Some critics also have pointed out that the public assistance standard is to high to be used as a poverty line because of the fact that the standard of living of households receiving public assistance are sometimes higher than that of these who are not receiving public assistance (Shibata 2001).
What measurement of poverty and what poverty standard, then, would be acceptable to the majority of people in modern Japanese society? One possible answer to this question is the Relative Deprivation Index developed by Townsend (1979). Hiraoka, one of the leading social policy researcher in Japan, defines Relative deprivation as “the condition in which the expected standard of living cannot be achieved due to the lack of the necessary resources (Hiraoka, 2001, p.155)”. “The expected standard of living”
indicates the custom and the norm of the society in which the individual lives, and in this meaning, this concept is relative, as in the case of the monetary concept of relative poverty9. The characteristic of the relative deprivation, however, is that it explicitly specifies a minimum acceptable list of expected activities in the relevant society.
Relative deprivation cannot simply be explained as another concept of inequality nor low income; it is a concept that under a certain living standard (threshold), it becomes impossible to conduct activities normally expected by the society, and thus minimum acceptable quality of life cannot be achieved. In this regard, it is an absolute concept. . been modified over the years.
Showa 23 (1948) – 35 (1960) Market Basket Method
Calculated by adding items of clothing, food and housing required for the minimum standard of living.
Showa 36 (1961) – 39 (1964) Engel Method
Calculated by price of food that meets the nutritional requirement and multiplying with the Engel’s coefficient.
Showa 40 (1965) – 58 (1973) Disparity Reduction Method
Increasing the standard more than the growth rate of the consumer price index so that the disparity between the assisted household and the general public would decrease.
Showa 59 (1983) –Standard Equilibrium Method
The standard is modified in accordance with the estimated consumer price index of the relevant year.
9 For example, items in the list used for the relative deprivation index may change in response to an increase in the standard of living of the entire society.
Compared to monetary notion of relative poverty, which defines this threshold as a certain level of income (or consumption), the notion of relative deprivation defines this threshold as a list of activities, and directly measures the quality of life. Thus, it instinctively appeals to people’s vague idea of “poverty”. Furthermore, as one’s activities are influenced by factors beyond present income (e.g. savings and home ownership), the relative deprivation index can be said to be an index which is more closely related to the standard of living than one based on present income. Moreover, if the list of the living activities building up a relative deprivation index indicates the
“minimum standard of living,” poverty can be defined as living conditions that exclude any one item of the list, thereby eliminating the need to set a new poverty line (deprivation line)10.
This paper is an attempt to measure poverty in contemporary Japan using the relative deprivation concept. Even though Townsend’s work on relative deprivation is widely known among Japanese social policy scholars, attempts to apply relative deprivation concept to Japanese data has been scant. The only exception has been Hiraoka (2001), which used data on elderly in 23 wards in Tokyo to create Japanese version of relative deprivation index. It constructs the index by summing up the number of lacking items in the 20-item list, selected from five dimensions; social participation and information access; personal network; social support network; housing, and household durables. The survey revealed that 80% of the respondents lacked at least one of these items. Hiraoka (2001) also tentatively suggests the negative relationship of the relative deprivation index and the income, by showing that the index increases significantly at income less than 2,250,000 yen.. However, Hiraoka(2001)’s analysis, unfortunately, has several limitations; first, the analysis is limited to the elderly; and the second, a turning point or a threshold at which the deprivation index disproportionally rises, discovered by Townsend could not be confirmed because the sample size was limited, and third, survey was not designed for the purpose of measuring deprivation, and thus the data used for the creation of the index were not completely appropriate.
This paper will address these limitations. The purpose of the paper is as follows.
First, it constructs a Japanese version of relative deprivation index, using data from two surveys. Then, it will examine the current status and identify the risk groups for relative deprivation in Japan. In order to highlight the difference between Hiraoka (2001)’s analysis and this study, it will compare the relative deprivation for the elderly and the young. Lastly, the paper analyzes the relationship between relative
10 For example, items in the list used for the relative deprivation index may change in response to an increase in the standard of living of the entire society.
deprivations and income, attempting to identify, if any, the threshold below which the relative deprivation index disproportionally rises.
2. Development of a Relative Deprivation Index
The relative deprivation index originally developed by Townsend is fairly simple.
Survey respondents are asked about the presence or absence of 60 items from 12 dimensions (where items are activities rather than goods, respondents are asked whether they perform or do not perform the activities) thought to be necessary for a minimum acceptable living standard. From this, a list of binomial variables is obtained by assigning 1 for “yes” and 0 for “no.” These variables are then arithmetically summed and defined as the relative deprivation index score. Aforementioned Hiraoka’s work on Japanese relative deprivation index also follows this methodology. However, there have been several major criticisms against this simple version of the index. To answer these criticisms, the relative deprivation index has been improved and became more sophisticated in the history of British poverty study. The major differences between the original and improved indexes are summarized below.
1) Elimination of arbitrariness
One criticism of the original relative deprivation index was that items used in the list were chosen arbitrarily by researchers and a lack of a given item did not always indicate the status of deprivation (Gordon 2000). For example, a researcher might choose refrigerator as one of the items. However, there might be a difference of opinion as to refrigerators’ being essential to live a “minimum acceptable“ way of life in society.
The lack of a refrigerator sometimes may not always lower the quality of life, if, say, one lives in a society where convenience stores are ubiquitous or one lives in cold climate. It is also possible in countries or societies that a refrigerator is a luxury item and is enjoyed only by a minority of the society. Thus, the inclusion of the refrigerator could be contentious. The selection of items is also problematic in the international comparison as well. Townsend’s original deprivation index includes items that are thought to be luxuries or not common in the Japanese context. A few examples are one-week holiday away from home and inviting friends to one’s home. Thus, in order to construct a relevant relative deprivation index, it is necessary to select items that are necessary for minimum acceptable living in each society or country. Inclusion of inappropriate items will lead to an index that is irrelevant and that will become a target of criticisms. Thus, arbitrariness in the selection of survey items must be minimized as much as possible, and blindly using the list developed in other countries must be
avoided.
One way to eliminate arbitrariness is developed by Mack & Lansley (1985) and subsequently developed by researchers in Britain (Gordon & Pantazis eds. 1997, Gordon et al. 2000). They sought to avoid this problem by letting the society select items that are considered to be necessary. By conducting a preliminary survey where randomly chosen subjects in general society were asked what items they believed were items that “all adults should be able to afford and which they should not have to do without” (Gordon et al. 2000, p.14). The method is based on the belief that while acknowledging the differences in individual preferences in each society, there exists a
“consensus on what is an unacceptable standard of living” and that “a person is in
‘poverty’ when their standard of living falls below the minimum deemed necessary by current public opinion” (Gordon ad Pantazis 1997). Items judged necessary by majority of the respondents in the preliminary study are then termed “socially perceived necessities”, and they represent a poverty criteria confirmed by the society. By letting the general public choose items freely, a true objectivity is assured. Furthermore, letting the society select the items also has an added advantage. When researchers use a list of items chosen arbitrarily, they are required to determine the number of items whose absence from the list would define the “deprived condition.” In other words, it is required to determine the “deprivation line;” however, the line is also arbitrary and meaningless11. Socially perceived necessities, however, are bare essentials. Therefore, even the lack of one of the items equals “less than minimum”. That is, the list itself becomes a deprivation line. This method was used for the Breadline Britain Survey in 1983 (Mack & Lanskely, 1985), the Breadline Britain Survey in 1990 (Gordon &
Pantazis, 1997) and the Poverty and Social Exclusion Survey in 1999 (Gordon et al., 2000)
2) Distinction of Enforced Absence and Absence by Preference
The second criticism to the original deprivation index was that no distinction was made between enforced absence and absence by individual preference (Piachaud 1981, 1987). For example, absence of meat from one’s diet, included in Townsend’s index, would not indicate deprivation if the individual was a vegetarian. A television, an item
11 Tsakloglou (2003) uses the average of deprivation index as the deprivation line, and defines the condition of deprivation as a deprivation index that is lower than that. It is the most common method to use the average as the deprivation line considering a poverty line which is often set at 50% of median value. Practically, however, in many surveys, most of the samples obtain 0 for the deprivation index, making it impossible to get the median value. Therefore, the average is used instead.
that has achieved a diffusion rate of close to 100%, is sometimes not possessed because of individual preference. As such, it is necessary to distinguish between absence due to individual preference and absence caused by the individual’s inability to obtain the item in spite of their need (enforced absence). To make this distinction, the questionnaire of the Poverty and Social Exclusion Survey (and earlier British surveys as well) use the wording such as “Can you afford….” So that lack of an item because the respondent “does not wish to possess” is not counted as deprivation.
3) Weighting of the Items
Even among those items selected as the socially perceived necessities, there are differences in the seriousness of their deprivation. For example, take a look at the “3 meals per day” and “social activity”. Both of are essential for a life in society, however, it is difficult to think their lack indicates the same seriousness. To correct this deficiency, a deprivation index which weighs the items by the degree of its importance (Proportional Relative Deprivation Scale) was developed (Whelen et al. 2002, Apospori
& Miller 2003). While the original relative deprivation index is simply the sum of dummy variables indicating the presence or absence of each item, this index puts weight on each item of its diffusion rate (rate of those possessing the item among the entire sample). By doing so, items with a higher rate of diffusion are given more weight than items with a lower rate. The index is then standardized by dividing it with the sum of all weights so that the outcome is always between 0 and 1, regardless of the number of items on the list.
3. Data and Methods
The relative deprivation index used in this study was constructed as follows. In 2002, a preliminary study entitled Survey of Public Perception of Welfare12, was conducted. In the survey, the respondents were asked whether each of 28 items chosen by the research team was necessary for a family to live an ordinary life in contemporary Japanese society13. Of the 28 items, 16 items including household goods, housing
12 This survey was conducted by a local company outsourced by the National Institute of Population and Social Security Research as part of the Grants for Health and Labor Science, “Empirical and Theoretical Research on How Public Assistance Should Be”
(Chief researcher: Reiko Goto). This survey targeted 2,000 people above 20 years of age extracted from the public nationwide by the stratified two-stage random sampling method, and the number of the respondents was 1,350 (the response rate = 67.5%).
13 The actual question was as follows: What is necessary at minimum for a family to have an average standard of living in the current Japanese society? Please choose one
amenities and conditions and social activities were marked as “necessary” in more than 50% of respondents14. These are then selected as the “Socially Perceived Necessities”
(Fig.1). The list is rather short because items which were considered obviously necessary (e.g. food necessary to keep bodily functions, basic clothing)15 were not included in the questionnaire to keep the questionnaire reasonably short. Thus, the list, by no means, represents the entire list of things necessary to live in contemporary Japan.
It is rather a subset of all necessities. Alpha Coefficient was calculated and it was shown that the list was statistically valid. Also, by following methodology by Gordon
& Pantazis (1997), it was shown that responses by different segments of the society (age groups, income class, gender, place of residence and education achievement) showed high correlation, and thus, it was concluded that there exists a consensus among the population as to what consists the “socially perceived necessities” (Abe 2004).
Following the preliminary survey, the Survey on Living Conditions16 was conducted in 2003. The survey is an attempt to collect data for constructing an index for and measuring the extent of social exclusion in Japan (Abe 2005), and includes a range of data on the material and social deprivation of individuals (See Annex 1 for details).
Especially relevant to this paper is the data on material deprivation of socially perceived necessities. The survey asked respondents whether they possess (or achieve) the items on the “socially perceived necessities” list, and if not, the reason for the lack. In order to distinguish cases in which respondents do not want to have an item because of their individual preferences from cases of enforced deprivation, the survey provided three answer among the following items, “absolutely necessary”, “better to have but not necessary”, “not necessary at all”.
14 17 of 28 items were chosen to be necessary by more than 50% of effective responses.
However the “Transportation expenses to meet friends, family and relatives” was deleted in the 2003 survey.
15 The reason that the obviously necessary items were not included in the survey was that we expected the rate of those who answer “absolutely necessary” for these items would be 100%, as well as the diffusion rate of these items. No survey can cover all items required for a life in contemporary Japanese society. Therefore, considering the possibility of data deterioration from lengthening the questionnaire, we selectively chose items that lie on the borderline of necessity.
16 The survey was conducted by the National Institute of Population and Social Security Research as part of a research project entitled “Empirical and Theoretical Research on Public Assistance” headed by Reiko Goto, and funded by the Ministry of Health, Labor and Welfare. It randomly sampled 2,000 male and female subjects above 20 years of age nationwide. The interview was conducted face-to-face. The number of effective responses was 1,520, and the rate was 76%. Only one
respondent, either the household head or the person most familiar with the household budget (usually the wife of the head of household), was selected from each household.
choices for the answer for most questions; “have”, “do not have (do not want)” and “do not have (cannot afford)” and only the last choice was counted as the absence of the item. There are, however, some items that do not allow a choice of “do not have (do not want)” since it was clearly preferable for everyone to have such items (examples of such items are “being able to save” and “being able to enrol in the public pension”).
Then, each of 16 items was given a dummy variable, and was assigned 1 if the item was lacking by force (i.e. not by individual’s preference) and 0 otherwise, and weighted with the item’s diffusion rate (the rate of those possessing the item among the entire sample).
A composite index score was then composed by summing the score for each item and dividing it by the sum of all weights. The resulting index score is thereby standardized, i.e. the score becomes 1 if all items were lacking by force, and 0 if none were.
∑
∑
=
= =J
j J
j
Wj Wjdij Di
1 1
Di= Deprivation index score for Person i Wj=Diffusion rate of Item j
dij=Dummy variable for Item i for Person i =1 lacking by force, =0 otherwise
Diffusion rate of Item i was calculated in the following manner:
= -
temj otWantingI spondentsN
Numberof leSize
EntireSamp
avingItemj spondentsh
Numberof Wj
ateofItemj DiffusionR
Re ) Re
(
Income data used for the analysis is the household income. The survey asked the respondents to fill in the sum of the after tax (and social security payments and benefits, including pensions and other social security benefits) incomes of the head of household (respondent) and his/her spouse (if any) in the increments of one million yen. Ideally, it is necessary to ask incomes of all the members of household (not only the household head the spouse) in order to accurately determine the household income. However, considering the limitations of an interview survey and the lack of information on the part of the respondents themselves17, it was believed that the most reliable values would
17 Even if the respondent knows his/her and his/her spouse’s income, he/she does not
be obtained by limiting data to the income of respondents and their spouses.
Equivalent household income, the value of the household income adjusted for the household size, was obtained using the equivalent scale of square root of the household size.
4. Frequency and Depth of Relative Deprivation
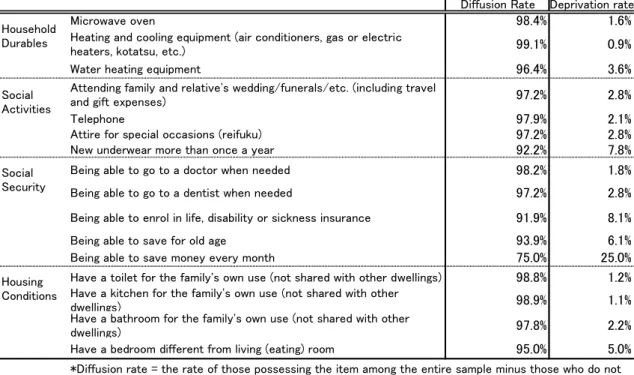
Before going into detailed analysis of deprivation, let us briefly examine the frequency (score) and the depth of deprivation as seen from the survey data. Table 1 shows the 16-item list of socially perceived necessities and their diffusion and deprivation rate. As you can see, most of the 16 items have a diffusion rate close to 100%. However, “Being able to save money every month (25.0%)”, “Being able to enrol in life disability or sickness insurance (8.1%)”, “New underwear more than once year (7.8%)” and “Separate rooms for sleeping and dining (5.0%)” showed a relatively high rate of absence.
The depth of deprivation can be indicated by the deprivation score of each household. Table 2 shows the distribution of respondents for each score. Note for the simplicity, Table 2 shows the number of lacking items, not the weighted and standarized deprivation index as described in Section 3. The higher the deprivation score, the more items the household is deprived. Table 2 shows that 65% of households had a score of 0, indicating that they possess all 16 of the socially perceived necessities. However, 35% of households lacked at least one, 14% lacked at least two and 9% lacked more than three of the necessary items.
always know the income of the members of the household accurately (e.g. children and parents).
Table 1 Socially Perceived Necessities and Their Diffusion Rate Socially Perceived Item
Diffusion Rate Deprivation rate
Microwave oven 98.4% 1.6%
Heating and cooling equipment (air conditioners, gas or electric
heaters, kotatsu, etc.) 99.1% 0.9%
Water heating equipment 96.4% 3.6%
Attending family and relative's wedding/funerals/etc. (including travel
and gift expenses) 97.2% 2.8%
Telephone 97.9% 2.1%
Attire for special occasions (reifuku) 97.2% 2.8%
New underwear more than once a year 92.2% 7.8%
Being able to go to a doctor when needed 98.2% 1.8%
Being able to go to a dentist when needed 97.2% 2.8%
Being able to enrol in life, disability or sickness insurance 91.9% 8.1%
Being able to save for old age 93.9% 6.1%
Being able to save money every month 75.0% 25.0%
Have a toilet for the family's own use (not shared with other dwellings) 98.8% 1.2%
Have a kitchen for the family's own use (not shared with other
dwellings) 98.9% 1.1%
Have a bathroom for the family's own use (not shared with other
dwellings) 97.8% 2.2%
Have a bedroom different from living (eating) room 95.0% 5.0%
* Deprivation rate = 100% - Diffusion rate
*Diffusion rate = the rate of those possessing the item among the entire sample minus those who do not want to possess the item
Household Durables
Social Activities
Social Security
Housing Conditions
Table 2 Distribution of Deprivation Score
Score (X) n % Accumulativ
e %
% lacking more than X
items
0 990 65.1% 65.1%
1 312 20.5% 85.7% 34.9%
2 80 5.3% 90.9% 14.3%
3 61 4.0% 94.9% 9.1%
4 27 1.8% 96.7% 5.1%
5 17 1.1% 97.8% 3.3%
6 13 0.9% 98.7% 2.2%
7 10 0.7% 99.3% 1.3%
8 6 0.4% 99.7% 0.7%
9 2 0.1% 99.9% 0.3%
10 1 0.1% 99.9% 0.1%
11 1 0.1% 100.0% 0.1%
samle size 1520 Average 0.713 Std.Dev. 1.403
5. Identification of At-Risk Groups
Next, this section examines who are at risk of experiencing relative deprivation.
The analysis of the elderly by Hiraoka (2001) showed that the risk of being in the state of deprivation is greater for people without spouses than for people with spouses and for people with fewer years of education than people with more years of education.
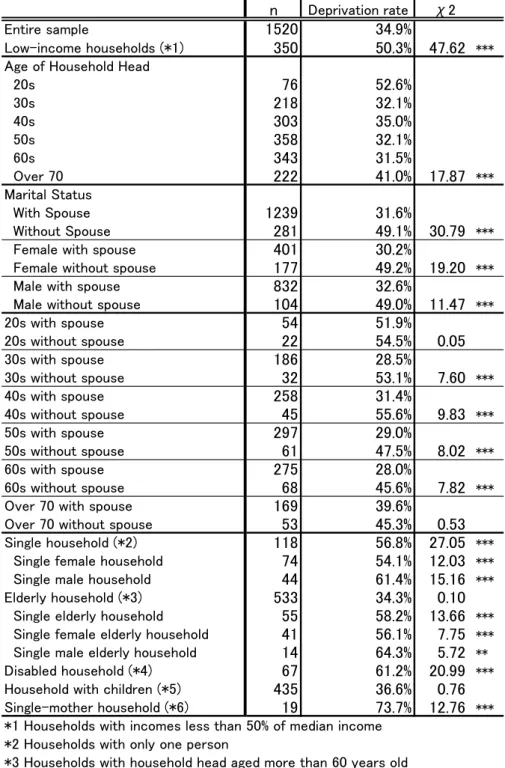
Furthermore, for women, the social class at age 50 (husband’s job category and company size) had a statistically significant influence on relative deprivation in later years. Data used in this study did not include any information on education or occupation, making it impossible to examine the relationship of education and social status to deprivation among people less than 60 years of age. However, using data such as the age of the household head18, their marital status, and household type, certain risk groups for the deprivation can be identified. To do so, Table 3 shows the average relative deprivation index for sub groups of the sample.
First, it was found that the age of household head had a statistically significant relationship with the deprivation. The relative deprivation rate for the household whose head is in their 20’s was especially high (53%), lower for household whose head is aged between 30 to 69 and increases a little for households whose head is greater than 70 years old. Generally speaking, income rises with age until the retirement age, and do does the household income with the age of the household head19. Thus, the relative deprivation follows the same trend as that of the economic viability of the household.
Second, the marital status also seems to indicate that it has an impact on the deprivation.
The relative deprivation rate of households whose household head is not married is higher (49%) than those in which household head is married (32%), paralleling the result of the elderly households by Hiraoka (2001). On further examination, comparing the relative deprivation rate of households with and without spouses by age group, households without spouses showed a higher rate or deprivation between 30’s and 60’s, but the difference for the 20’s and “the 70’s and over” is not significant. The possible explanation for this can be extracted from Hiraoka (2001)’s hypothesis regarding the marital status. He points to a possibility that the absence of a spouse is
“a deviation from the standard (normal) life course (Hiraoka, 2001, p.170)” caused by
“low social class”. For individuals in their 20’s and above 70 years, the lack of a spouse does not represent a “deviation from the standard life course”, but for
18 Accurately, it is the survey respondents’ age. At survey, we asked the head of household or the spouse to respond to the questionnaire.
19 Individuals in their 20’s living with parents are included in the data only as the member of the household because the parent is the head of household. Only when an individual in their 20’s is a household head or the spouse, he/she is included.
individuals between 30 and 69, it could be that the lack of spouse is a deviation from the norm of society. It is possible that the phenomenon of relative deprivation is one dimension of this deviation from the norm, i.e. because one is leading a life that is deviated from the norm, he/she is also deprived. On the contrary, it is also possible that because people are experiencing relative deprivation, they are likely to deviate from the norm. This causality direction cannot be examined from the data, but this hypothesis on the relationship of deprivation and the “standard (normal) life course)” is worth developing. Further, the influence of marriage was expected to be greater for females than for males; however, the data revealed approximately the same values for both, indicating about the same risk of deprivation for male and female singles.
Besides the age and the marital status, several characteristics were suspected to be related to the deprivation. Those suspected of being at risk of deprivation were elderly who consistently show higher poverty rate (as calculated by comparing their income against the 50% median), the single-mother households, households with children who bear the high cost of child rearing, the households with the sick and disabled, and the single-person households. The data confirmed some of these suspicions but not others.
First, single-person households showed higher relative deprivation compared with households of more than two people. In particular, 69% of elderly single households exhibited relative deprivation. The elderly households as a whole is not showing higher risk of deprivation as compared to the general population, thus being in a single-person household regardless of his/her age, not the age itself, increases the risk of deprivation. Households with children (junior high school students or younger) did not show a high rate of relative deprivation.
For households with sick or disabled individuals and single mother households, even though the sample size is small, the ratio of relative deprivation was much greater (61% and 74%) than that in general households.
These results indicate that even during the financially weak periods of one’s life course, such as child rearing age and old age, households which remain within the range of the “standard life course” were not at an increased risk of deprivation. However, households which suffered marital break-up, loss of spouse, or have sick or disabled individual, the risk of deprivation becomes very high.
Table 3 Deprivation rate of Different groups
n Deprivation rate χ2
Entire sample 1520 34.9%
Low-income households (*1) 350 50.3% 47.62 ***
Age of Household Head
20s 76 52.6%
30s 218 32.1%
40s 303 35.0%
50s 358 32.1%
60s 343 31.5%
Over 70 222 41.0% 17.87 ***
Marital Status
With Spouse 1239 31.6%
Without Spouse 281 49.1% 30.79 ***
Female with spouse 401 30.2%
Female without spouse 177 49.2% 19.20 ***
Male with spouse 832 32.6%
Male without spouse 104 49.0% 11.47 ***
20s with spouse 54 51.9%
20s without spouse 22 54.5% 0.05
30s with spouse 186 28.5%
30s without spouse 32 53.1% 7.60 ***
40s with spouse 258 31.4%
40s without spouse 45 55.6% 9.83 ***
50s with spouse 297 29.0%
50s without spouse 61 47.5% 8.02 ***
60s with spouse 275 28.0%
60s without spouse 68 45.6% 7.82 ***
Over 70 with spouse 169 39.6%
Over 70 without spouse 53 45.3% 0.53
Single household (*2) 118 56.8% 27.05 ***
Single female household 74 54.1% 12.03 ***
Single male household 44 61.4% 15.16 ***
Elderly household (*3) 533 34.3% 0.10
Single elderly household 55 58.2% 13.66 ***
Single female elderly household 41 56.1% 7.75 ***
Single male elderly household 14 64.3% 5.72 **
Disabled household (*4) 67 61.2% 20.99 ***
Household with children (*5) 435 36.6% 0.76
Single-mother household (*6) 19 73.7% 12.76 ***
*1 Households with incomes less than 50% of median income
*2 Households with only one person
*3 Households with household head aged more than 60 years old
*4 Households which has one or more disabled person
*5 Households which has one ore more children aged less than 16
*6 Households which has one ore more children aged less than 16, and whose household head is single
6. Relationship between Income and Relative Deprivation
Next, the relationship between relative deprivation and income is explored. The purpose of this analysis was to determine whether there exists a threshold income where the relative deprivation index becomes disproportionally high, identified by Townsend (1979) in British data and found subsequently in many other countries, in Japanese data.
The Graph 1 shows the result. The horizontal axis indicates household income strata (in groups of 1 million yen) and the vertical axis indicates the average deprivation index of households in the income group. The graph shows the average relative deprivation index for each income strata. As expected, the lower the household income, the higher the average deprivation index. However, it is clear that there exists a threshold at around 4 to 5 million yen below which the deprivation index rises rapidly. Above this threshold, the deprivation index slowly declines with the income level. Because of the possibility that a small number of observations with very high index value is raising the average value for lower income strata, the frequency of deprivation (the ratio of the respondents with a more than 0 deprivation index = the deprivation rate for each income strata) for each income strata is also calculated (shown in Table 4). Table 4 indicates that the frequency of deprivation also increases in the lower income strata; and income strata with a less than 4 to 5 million yen in particular show a higher frequency of deprivation. The analysis points to a possibility that the living standard with household income of 4 to 5 million yen is the minimum level of living for having what the majority of people in contemporary Japanese society feel as a normal life, and that the lack of necessary items will increase as the income decreases from this line20.
20 We performed a similar analysis using the equivalent household income (equivalized with the scale of square root of the household size). The analysis using the equivalent household income also showed the existence of the threshold below which the
deprivation scale rises disproportionally. To account for the different size of the household, it is better to use the equivalent household income. However, because the raw data of income is the category value and the data reliability will deteriorate further by including a new variable such as the household size, it was decided to use the data itself rather than the equivalized value.
Graph 1 Ave rag e Re lative D e privatio n I n de x by I n c o m e S trata
0 0.02 0.04 0.06 0.08 0.1 0.12 0.14 0.16 0.18 0.2
0 200 400 600 800 1000 1200 1400 1600 1800 2000
Income(10,000yen)
Deprivation Index
Table 4 Deprivation Rate by Income Strata Income Strata n # (Dep.Index >0) Dep.Rate
1 11 10 90.9%
2 35 27 77.1%
3 110 74 67.3%
4 220 108 49.1%
5 212 90 42.5%
6 168 56 33.3%
7 137 34 24.8%
8 125 26 20.8%
9 96 20 20.8%
10 57 5 8.8%
11 47 8 17.0%
12 59 9 15.3%
13 28 1 3.6%
14 15 2 13.3%
15 7 1 14.3%
16 6 0 0.0%
17 7 0 0.0%
Not known 180 59 32.8%
Total 1520 530 34.9%
Further analysis of the relationship between the relative deprivation index and income, stratified by age groups is shown in Graphs 2 and 3. The relative deprivation
index is expected to be affected not only by present income but also by the accumulation of resources such as past income and possessions. Generally speaking, most elderly have already finished investments in housing and can maintain a certain standard of living even their income is low. If this is the case, the relationship between the deprivation and the income, as seen in the Graph 1, should not necessarily hold for elderly households, whose income might be limited after the retirement, but have accumulated wealth and possessions. In another words, the accumulated income from the younger period is expected to reduce the risk of deprivation at a later stage in life.
To explore if this hypothesis holds, Graphs 2 and 3 show the deprivation frequency (the ratio of respondents with a greater than 0 deprivation index) and depth of deprivation (average deprivation index of respondents with a greater than 0 deprivation index) by income group, separating samples into the working age (head of the household is less than 60 years of age) and the elderly (head of the household is greater than 60 years of age).
According to Graphs 2 and 3, the negative relationship between deprivation frequency (and depth) and the (present) income does not change for the elderly as well as for the working age, indicating that present income is still an important determinant of relative deprivation even for the elderly. However, comparing the working age and the elderly in the same income group, the elderly is lower in both deprivation frequency and the depth. In another words, given the same income, the elderly has a lower risk of deprivation than the working age group. However, this result alone does not verify the hypothesis that the accumulated wealth and possessions in later in life decreases the risk of accumulation, because from this data alone, it is impossible to distinguish the cohort effect from the age effect. The analysis compares the current elderly and the current working age individuals, not working age and the elderly period of the same individuals. Therefore, even if the current elderly have a lesser degree of relative deprivation than current young people, there is a possibly that this is a resulted from the historical background of each group. It is necessary to obtain data from the same group over the long term (panel data) to examine these two effects separately.
Graph 2 Fre qu e n c y o f de privatio n : w o rk in g age vs. e lde rly
0 0.2 0.4 0.6 0.8 1 1.2
0 200 400 600 800 1000 1200 1400 1600
Income (10,000 yen)
Deprivation Rate
Working Age Elderly
Graph 3 D e pth o f D e privatio n : W o rkin g age vs. Elde rly ( Ave rage D e privatio n sc ale f o r th o se w h o se D e p.S c ale > 0 )
0 0.05 0.1 0.15 0.2 0.25
0 100 200 300 400 500 600 700 800 900 1000
Income (10,000 yen)
Average deprivation scale Working age
Elderly
7. Multivariate Analysis of Relative Deprivation
In the preceding chapter, though it was found that the certain groups have a higher risk of relative deprivation, it was difficult to clearly identify the determinants for relative deprivation. To do so, it is necessary to use the multivariate analysis which can control the effect of several determinants such as income. For example, the reason that the young group shows the higher risk of deprivation is possibly because of their lower income, and not because of the fact that they are young.
The analysis makes use of the logistic regression model specified as follows (Model 1).
∑
=+ +
+ +
⎟⎟ =
⎠
⎜⎜ ⎞
⎝
⎛
−
7
2 2 3
1
1ln
j
ji i j
i i i
i
X C M A
p
p α β β β δ
where pi = Probability that household i is deprived
Xi = Equivalized household income for household i
Si = 1 if the household head for household i has a spouse, 0 otherwise Mi =1 if the household i has a sick or disabled household member,
0 otherwise
A(2-7)i = Dummy variable for age groups 2 to 7 (20’s, 30’s,…70’s and above), 1 if the household head’s age is in group (2 – 7), 0 otherwise
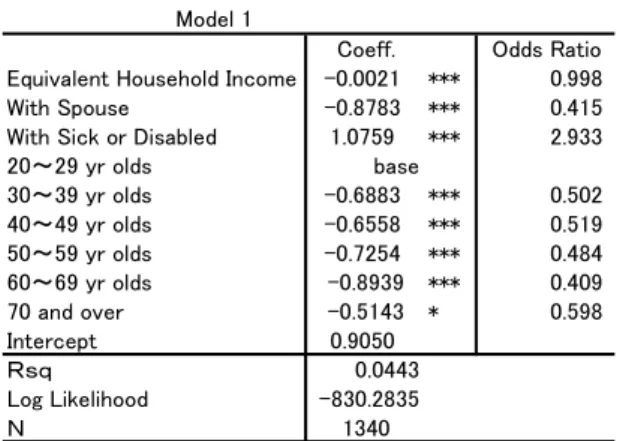
The dependent variable is a dummy variable, whose value equals 1 when the relative deprivation index for the household is larger than 0, and 0 otherwise. For Model 1, independent variables are equivalent household income, the dummy variable for the marital status of the head of household, the dummy variable for the presence of sick or disabled household member and dummy variables for age groups 20’s to 70’s and above of the household head. The result of the logistic regression is presented in Table 5.
The coefficient B1 for the equivalent household income is negative and statistically significant, indicating that the higher the household income is, the lower the probability of being deprived. The coefficients for the age groups of the household head are also significant and negative. This confirms the earlier hypothesis that even after controlling for the present equivalized household income, the young people are at a higher risk of being deprived compared to the older people. The odds ratio of being deprived for those in their 30’s is 0.50 times those in their 20’s, 0.52 times for those in their 40’s, 0.48 times for those in their 50’s and 0.41 times for those in their 60’s. The odds ratio of being deprived for those in their 70’s increases slightly to 0.6 times that of
those in their 20’s, but is till much lower. The odds ratio for households whose head has a spouse is only 0.42 times that of those without a spouse, and the odds ratio for household with sick or disabled household member is nearly 3 times that of household without any sick or disabled.
In Model 2, the sample is divided into elderly above 60 years old and the young between 20 and 59 years old, in order to highlight the difference in the effect of determinants on these two groups. The result shows that there was no difference in the direction of the coefficient between the two groups; however, the influence of equivalent income and the marital status were greater in the young group than in the elderly, and the influence of sick or disabled household member is greater in the elderly than in the young.
As the deprivation index was found to increase in particular in Income Strata 5 and below, Model 3 includes dummy variables for Income Strata 1&2 (= less than a million yen) to Income Strata 10 and up (= greater than eight million yen) as independent variables. The result confirms that there is significant increase in the probability of being deprived for those in Income Strata below 6. Compared to the Income Strata 10 and up, the coefficient in all strata up to Strata 6 (= 4 to 5 million yen) are significant and positive. The odds ratio of being deprived for Income Strata 1&2 (less than one million yen) is 16.6 times those in Income Strata 10 and up, 7.6 times for those in Income Strata 3 (= 1 to 2 million yen), 3.8 times for those in Income Strata 4 (= 2 to 3 million yen), 2.9 times for those in Income Strata 5 (= 3 to 4 million yen), and 1.9 for those in Income Strata 6 (= 4 to 5 million yen).
Table 5 Results of the Logistic Regression
Coeff. Odds Ratio Coeff. Odds Ratio
Equivalent Household Income -0.0021 *** 0.998 With Spouse -0.176 0.838
With Spouse -0.8783 *** 0.415 With Sick or Disabled 1.189 *** 3.284
With Sick or Disabled 1.0759 *** 2.933 20~29 yr olds base base
20~29 yr olds base 30~39 yr olds -0.431 * 0.650
30~39 yr olds -0.6883 *** 0.502 40~49 yr olds -0.220 0.803
40~49 yr olds -0.6558 *** 0.519 50~59 yr olds -0.387 0.679
50~59 yr olds -0.7254 *** 0.484 60~69 yr olds -0.851 *** 0.427
60~69 yr olds -0.8939 *** 0.409 70 and over -0.607 ** 0.545
70 and over -0.5143 * 0.598 Income Class1&2(100>) 2.810 *** 16.613
Intercept 0.9050 Income Class3(100=< x <200) 2.048 *** 7.753
Rsq 0.0443 Income Class4(200=< x <300) 1.346 *** 3.844
Log Likelihood -830.2835 Income Class5(400=< x <500) 1.075 *** 2.929
N 1340 Income Class6(500=< x <600) 0.667 *** 1.948
* 10%、**5%、***1% statistically significant Income Class7(600=< x <700) 0.222 1.249 Income Class8(700=< x <800) 0.044 1.045 Income Class9(800=< x <900) 0.062 1.064 Income Class 10 and up (800< base base
Coeff. Odds Ratio Intercept -0.825 ***
Equivalent Household Income -0.0013 * 0.999 Rsq 0.1115
With Spouse -0.7232 *** 0.485 Log Likelihood -873.3326
With Sick or Disabled 1.1462 *** 3.146 N 1520
Intercept -0.0282 * 10%、**5%、***1% statistically significant
Rsq 0.0355
Log Likelihood -309.5955
N 498
* 10%、**5%、***1% statistically significant
Coeff. Odds Ratio Equivalent Household Income -0.0030 *** 0.997
With Spouse -1.0970 *** 0.334
With Sick or Disabled 0.9916 ** 2.696
Intercept 0.5294 **
Rsq 0.0401
Log Likelihood -525.8176
N 842
* 10%、**5%、***1% statistically significant Model 2 (Elderly above 60 yrs old)
Model 2 (20 to 59 yr olds)
Model 1 Model 3
8. Discussion
One of the objectives of this study was to apply the methodology of the relative deprivation index developed by Townsend (1979) to Japanese data and examine its applicability in poverty research of contemporary Japan. In doing so, several insights were gained in constructing the relative deprivation index for Japan. First of all, it was recognized that the choice of items included in the “necessity list” has a great influence on the level of deprivation in the outcome. Thus, the selection of items must be based on the value and normative judgement of the majority of people. In order for the deprivation index to be accepted as an alternative to the conventional poverty measures, it is essential to seek the general public’s opinion as to what constitutes the minimum necessity and the method devised by Mack and Lansley (1985) of “socially perceived necessities” is one way of doing so. It is a troublesome discovery that 35%
of the respondents lack one or more items in the index established as such. However,
though the number is shocking, it is not finding out the absolute level of deprivation index that is the most significant contribution of such exercise. It is of greater importance to identify the risk groups and possible determinants of deprivation, which can be performed by the establishment the index, and the analysis of the relationship between deprivation and income.
The most significant observation in this study is the confirmation of the existence of the threshold below which the deprivation index increases rapidly. Data of income used in this study is self-reported and thus its reliability is somewhat questionable. But the average deprivation index and the frequency of deprivation rapidly increase for households whose household income is less than 4 to 5 million yen per year. This was confirmed by multivariable analysis even after adjusting for age group, the marital status and the presence sick or disabled household member.
The analysis of the risk groups indicates that the relative deprivation risk increases when the household “deviates from the standard (normal) life course”, indicated by the lack of a marital relationship or having sick or the disabled household member. On the contrary, the elderly household, which was thought to have high potential for falling into poverty, or households with children that seem to be on a tight budget, are not at a higher risk of deprivation as long as they do not deviate from the standard life course.
The lack of a marital relationship in middle age (aged 30’s to 50’s), the presence of sick or disabled household member, or single-mother households have higher risk of the relative deprivation.
It was also a new finding that the young people, especially in their 20s, emerge as the new risk group of deprivation. Even controlling for the lowness of the income, the young people exhibited a greater frequency and depth relative deprivation than the elderly. There is a strong indication that the accumulation of the past income can reduce the deprivation risk for the aged, even though the study could not separate the cohort effect from the age effect using this data.
These observations do not directly assert the need for policy response; however they provide important information for formulating the future reforms of social policy in Japan. The analysis in this study indicates that the current social security system does not provide adequate safe guards for the influences of these “deviations from the standard life course”. Furthermore, there does seems to be a certain income level (albeit the fact the exact level is not certain from this analysis alone) where the people’s quality of life becomes below the minimum acceptable level. Finding out exactly what level this income level is, and devising ways to mitigate the risk of falling into deprivation is the next task of this continuous study.
Acknowledgement
This study was conducted as part of “Research on the social inclusion effect in the Japanese social security system” (chief researcher: Aya Abe) under the science advancement research project of Grants for Health Science. During the writing this paper, we received very beneficial comments from Prof Koichi Hiraoka, Prof. Kenji Shibata and the researchers at the National Institute of Population and Social Security Research. I am grateful for all their useful comments and suggestions.
Bibliography (Materials in Japanese)
Abe, A. K. , “Kodomo no Hinkon – Kokusai Hikaku no Shiten Kara (Child Poverty – from the viewpoint of international comparison),” in National Institute of Population and Social Security Research (ed.) Kosodate Setai no Shakai Hosho (Social Security for Child Rearing Families), Tokyo University Press, 2005
Abe, A.K., “’Saiteigen no Seikatu Suijun’ ni Kansuru Shakaiteki Hyoka (Social Evaluation of
‘Minimum Standard of Living’), The Quarterly of Social Security Research (Kikan Shakai Hosho Kenkyu) Vol. 39, No.4, 2004, p.403-414.
Abe, A.K., et al. “’Shakai Seikatsu Chosa’ no Kekka Hokoku (Report of ‘Shakai Seikatu Chosa’)” in The Heisei 15 (2003) Report of The Grants for Welfare and Labor Science, “Empirical and Theoretical Research on How Public Assistance Should Be” (Chief researcher: Reiko Goto)., 2004, p.212-247.
Abe, A.K. “Hinkon kara Shakaiteki Haijo he: Shihyo no Kaihatsu to genjo (From Poverty to Social Exclusion: Development and Status of the Index)”, The Review of Comparative Social Security Research (Kaigai Shakaia Hosho Kenkyu), No.141, 2002, p. 67-80.
Iwata, M. & Nishizawa, A. Hinkon to Shakaiteki Haijo (Poverty and Social Exclusion) Minerva Shobo, 2005.
Ogawa, H. “Hinkon Setai no Genjo – Nichiei Hikaku (The Status of Poor Families: Comparison ofJapan and the UK,” Keizai Kenkyu , Vol.51, No.3、2000, p.220-231
Goto, R., Abe, A., et al. “Fukushi ni Kansuru Kokumin Ishiki Chosa (National Survey on Perception of Welfare), The Quarterly of Social Security Research (Kikan Shakai Hosho Kenkyu) Vol. 39, No.4, 2004, p.389-402.
Shibata, K. “Teishotoku to Seikatu Fuantei (Low Income and Unstable Living)” in Hiraoka, K. (ed.) Koreiki to Shakaiteki Fubyodo (Elderly Age and Social Inequality, Tokyo Univerity Press, 2001, p.79-92.
Komamura, K. “Seikatu Hogo Kaikaku / Shogaisha no Shotoku Hosho(Publis Assistance Reform and Income Support for the Disabled,” in National Institute of Population and Social Security
Research (ed.) Social Security Reform, Tokyo University Press, 2005, p.173-202.
Seikatu Hogo Seido Kenkyukai (ed.) Heisei 15 (2003) Hogo no Tebiki (Handbook of Public Assitance), Daiichi Hoki, 2003.
Hamamoto, C. “Shunyu kara mita Hinkon no Bunseki to Dinamikkusu (Analysis and Dynamics of Poverty from the perspective of Income), in Iwata & Nishizawa, 2005, p.71-94.
Higuchi, A. “Gendai Shakai ni okeru shakaiteki Haijo no Mekanizumu (Mechanism of Social exclusion in Contemporary Society,” Japanese Sociological Review (Shakaigaku Hyoron) Vol.55, 2004, p.2-18.
Hiraoka, K. (ed.) Koreiki to Shakaiteki Fubyodo (Elderly Age and Social Inequality, Tokyo Univerity Press, 2001.
Hoshino, S. “Fukushi Kokka Churyu Kaisoka ni Torinokosareta Shakai Fukushi (Social Welfare lef behind by welfare state’s middle class’ication,), Jinbun Gakuhou (Tokyo Metropolitan University), No.261, 1995, p.23-86.
Hoshino, S., Iwata, M. et al. “Fukushi Kokka ni okeru shotouk saibunpai Kouka ni kansuru kenkyu (Research on Income Redistribution Effect in the Welfare State, “in Uzuhashi, T. Gendai Fukushi Kokka no Kokusai Hikaku (International Comparison of Contemporary Welfare States) Nihon Hyoronsha, 1997.
Yamada, A. “Shakaihosho Seido no Anzenmo to Koreisha no Keizaiteki Chii (The Safety Net of the Social Security System and the Economic Status of the Elderly,” National Institute of Population and Social Security Research ed. Kazoku/Setai no Henyo to Seikatu Hosho Kino (The Change of Family and Households and Living Maintenance Function, Tokyo University Press, 2000, p.199-226.
Wada, Y. & Kimura, M. “Sengo Nihon no Hinkon – Teishotoku Setai no Keisoku (Poverty in the Post-War Japan)”, The Quarterly of Social Security Research (Kikan Shakai Hosho Kenkyu), Vol.34, No.1, 1998, p.90-102.
Bibliography (Materials in English)
Apospori, Eleni and Millar, Jane (eds.), The Dynamics of Social Exclusion in Europe: Comparing Austria, Germany, Greece, Portugal and the UK, Cheltenham, U.K., Edward Elgar, 2003.
Barnes, M., Heady, C., Middleton, S., Millar, J., Papadopoulos, F. and Tsakloglou, P. (eds.), Poverty and Social Exclusion in Europe, Cheltenham, U.K. and Northampton, MA, USA: Edward Elgar, 2002.
Bradshaw, et al., “The Relationship between Poverty and Social Exclusion in Britain,” Paper prepared for the 26th General Conference of the International Association for Research in Income and Wealth, Cracow, Poland, 27 Aug.-2.Sep. 2000.
Burchardt, Tania, Le Grand, Julian and Piachaud, David, “Social Exclusion in Britain 1991-1995,”
Social Policy & Administration, Vol.33, No.3, Sep. 1999, p.227-244.
Gordon et al., Poverty and Social Exclusion in Britain、Rowntree Foundation. 2000.
Gordon, D. and Pantazis, C. eds., Breadline Britain in the 1990s, Ashgate, 1997.
Gordon, D. and Pantazis, C. ‘The public’s perception of necessities and poverty,” in Gordon &
Pantazis eds. Breadline Britain in the 1990s, Ashgate, 1997.
Mack, J. and Lansley, S., Poor Britain, Allen and Unwin, 1985..
Moisio, Pasi, “The Nature of Social Exclusion – Spiral of Precariousness or Statistical Category?,”
in Muffels, Tsakloglou, and Mayes 2002, p.170-183.
Muffles, Rund J.A., and Fouarge, Didier J.A.G., ‘Do European Welfare States Matter in Explaining Social Exclusion?’, in Muffels, Tsakloglou, and Mayes, 2002, p.202-234.
Muffels, Rund, Tsakloglou, Panos, and David Mayes (eds.), Social Exclusion in European Welfare States, Edward Elgar, 2002.
Tsakloglou, Panos, ‘The risk of multidimentional disadvantage and social exclusion during four life stages in a dynamic perspective’, in Apospori and Millar (2003), p.17-40.
Whelan, Christopher, Layte, Richard, Maitre, Bertrand and Nolan,Brian, ‘‘Income Deprivation Approaches to the Measurement of Poverty in the European Union”, in Muffels, Tsakloglou, and Mayes, p.183-201.