レナードジョーンズ系の気液相平衡
著者 西野 和磨, 片岡 洋右
出版者 法政大学情報メディア教育研究センター
雑誌名 法政大学情報メディア教育研究センター研究報告
巻 26
ページ 39‑44
発行年 2012‑08
URL http://doi.org/10.15002/00007984
http://hdl.handle.net/10114/7190
原稿受付 2012年3月5日 2012年 7 26 日
レナードジョーンズ系の気液相平衡
Vapor-liquid phase equilibrium of the Lennard Jones system
西野 和磨 片岡 洋右 Kazuma Nishino, Yosuke Kataoka
法政大学生命科学部環境応用化学科
Vapor-liquid phase equilibrium is studied by molecular dynamics simulations on Argon with Lennard-Jones potential. The boiling and critical point are examined by molecular system with liquid-vapor interface. The obtained values of vapor pressure are not so good compared with the macroscopic experimental ones. When the simulation results are reduced with Lennard-Jones parameters, better comparison was obtained on Ne, Ar, Kr and Xe.
Keyword: Vapor-Liquid Phase Equilibrium, Molecular Dynamics, Argon, Lennard-Jones Potential
1. 緒言
分子動力学法を用いてレナード・ジョーンズポテ ンシャルに従う分子系の蒸気圧の温度変化を調べる。
液相と気相の相境界が蒸気圧曲線であり,三重点か ら始まり臨界点で終わる。気・液界面を作り NEV アンサンブルでシミュレーションを行い,平衡状態 を作る。平衡状態から蒸気圧を決める。さらにそれ ぞれの分子系の蒸気圧を比較して考察する。
2. 理論
2.1 レナード・ジョーンズポテンシャル
レ ナ ー ド - ジ ョ ー ン ズ ・ ポ テ ン シ ャ ル
(Lennard-Jones potential)とは,2つの原子間の相互 作用ポテンシャルエネルギーを表す経験的なモデル の一つである。ポテンシャル曲線を表す式が簡単で 扱いやすいので,分子動力学計算など様々な分野に おいて使われる。レナード-ジョーンズ・ポテンシャ ル u(r)の一般形は,次の式であらわされる。
( )
p q
u r r r σ σ
(1)
2.2 分子動力学法(Molecular Dynamics)
分子力学法は,物質を構成する原子や分子を古典力 学の運動方程式に従い運動する剛体と見なして数値 的に解き,各時刻における位置と運動量を決定する 方法である。また,分子動力学法の特徴として個々 の分子の運動に関する情報を得ることができる。そ の結果,求まる粒子の軌道を統計処理することによ り物性値や構造情報を与えるシミュレーション技法 である。
2.3 NEV アンサンブル(定エネルギー法)
NEVアンサンブルのN, E, Vは粒子数,エネルギ ー,体積一定であり,分子運動を古典力学で解くだ けである。温度や圧力の制御を行わない場合には,
各原子の受ける力は原子間相互作用に限られるため,
粒子系の全エネルギーおよび体積が一定に保たれた ミクロカノニカルアンサンブルが実現される。
( i i)
i
dr d m
dt dt r
(2) 2.4 ポテンシャル関数
40
Copyright © 2012 Hosei University 法政大学情報メディア教育研究センター研究報告 Vol.26 ポテンシャル関数とは原子・分子間の相互作用を
記述したもので,関数形とそれに含まれるパラメー ター値を与えることで決定する。
3. シミュレーション条件および方法
Table 1にシミュレーション条件をまとめた。NEV
アンサンブルを使用した理由は,この方法が運動 エネルギーの制御など人工的な操作を含まない最 も安全な方法だからである。
Table 1 Simulation conditions.
Software Materials Explorer
Ensemble NEV
The total number of steps 1,000,000
Time step size 1[fs]
The number of molecules 2605
Potential function Argon
*初期温度:ポテンシャルエネルギー変化が激しい ため,臨界温度より高温で行った。アルゴンの巨視 的実験値の沸点が87.3 K,臨界温度が150.72 Kであ るため,初期温度は80~550 Kでシミュレーション を行った。
*液相部分の初期密度:初期状態としては最も安定 な固相1.785 g/cm3を使用した。
4. 結果および考察
*本研究におけるシミュレーション値・実験値 シミュレーション値とはMaterials Explorerで計算し て得られた圧力の値から求めた蒸気圧の値の値,実 験値とは,Antoineの式にまとめられた巨視的蒸気圧 の値である。
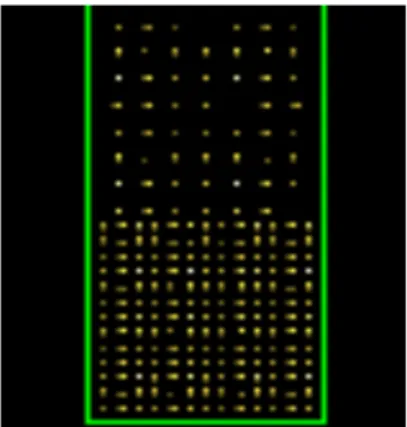
まず,Fig.1のように液相部分の上に気相部分を張 り合わせて気・液界面の計算のための初期配置を作 った。
Fig.1 The initial configuration for vapor-liquidphase equilibrium of argon.
・液相:基本単位系 FCC 7*7*7, 分子数 = 1372
・気相:体積を固相の 9 倍に設定し,分子数は固相 の 1/10程度→分子数を137で行う。セルは立方体 をc軸方向に9個積み重ねる。
シミュレーションで温度を変化させ,得られた圧力 P から次の式で蒸気圧を計算した。系に異方性が あるため生じる系の圧力に対する表面張力の影響 を考慮して次の式を使用した。
P(基本セルの圧力) = P(蒸気圧)-{ Pz-(Px+Py)/2}
(3)
(表面張力/界面の厚み)と蒸気圧のグラフを以下に 示した。この量は次の式から計算した。
(表面張力界面の厚み)= Pz-(Px+Py)/2 (4)
Fig.2 Surface tension is divided by interfacial thickness as a function of temperature for argon model.
-4 -2 0 2 4 6
100 150 200 250 300
(Surface tention/interfacial thickness)/atm
T/K
0 100 200 300 400 500 600 700
100 150 200 250 300
Vapor pressure/atm
T/K
Fig.3 The plot of vapor pressure vs. temperature for argon model.
Fig.2より,臨界温度は146 Kと巨視的実験値より
低く出る傾向にあった。
Fig.3よりシミュレーションでは沸点が102 Kであ
ったが,巨視的実験値は87.3 Kである。
102K 147K 185K Fig.4 The final configuration for argon.
Fig.4を見るとわかるように,臨界温度を越えた温
度では界面がなく,すべて気体になっていることが 見てとれる。
102K 147K
Fig.5 The monitoring windows at boiling point (T = 102K) and critical temperature (T = 147K).
臨界温度のモニター図と沸点の時のモニター図を 見比べると,沸点の時はすべての値の変化が激しい が,臨界温度になると変化があまりなく安定してい るのがわかる。
この結果を踏まえ,Antoine 式[3]を使いアルゴン の巨視的実験で求められた蒸気圧の温度変化のグラ フを作成した。
10
( / )
( / ) Log p mmHg A B
C T C
(4)A = 6.6151 B = 304.227 C = 267.320
0 20 40 60 80 100 120 140 160
80 130 180
Vappor pressure/atm
T/K
Antoine MD
Fig.6 The vapor pressure of argon as obtained from Antoine equation, and MD simulations of this work.
シミュレーションで得られた圧力の値から計算し た蒸気圧の値は巨視的実験値(アントワンの式から 得られた蒸気圧)と比べて,温度が上がるにつれて 蒸気圧が高く出る傾向にあった。これは,Materials
Explorer のポテンシャル関数に用いられたパラメー
ターの値がアルゴンに必ずしも十分にはあっていな いからである。
そこで,レナード・ジョーンズパラメーターの値 を用いてシミュレーションで得られた圧力のデータ
42
Copyright © 2012 Hosei University 法政大学情報メディア教育研究センター研究報告 Vol.26 を換算し,次の式で換算蒸気圧と換算温度を求めた。
3
,
p T
k
(5)シミュレーションで使用された値:
k =125 K, =3.42×10⁻¹⁰ m 巨視的実験値から決定された値:
k =111.84 K, =3.62×10⁻¹⁰ m
0 0.1 0.2 0.3 0.4 0.5 0.6
0.8 1 1.2 1.4 1.6 1.8
Reduced vapor pressure[‐]
Reduced temperature[‐]
Reduced Antoine
Fig.7 The values of vapor pressure presented in Fig.5 were converted into dimensionless values using a couple of different Lennard-Jones parameters.
Fig.7 より換算した圧力から求めた蒸気圧はアン
トワン式から得られた蒸気圧とは完全には一致しな いものの,シミュレーションにより得られた圧力か ら計算した蒸気圧よりは近い蒸気圧曲線が得られた。
今回の実験で得たシミュレーション結果での沸点,
臨界温度は巨視的実験値と誤差が出てしまった。こ れは分子数やステップ数が不十分であったと考えら れる。
今後の課題は,分子数を増やす,気体部分の分子 数を変える,ステップ数を増やす,密度を臨界密度 に設定するなどによりシミュレーションを行い,今 回の結果と比較することである。
また温度を指定したとき平衡構造に早く収束する NTV アンサンブルでも計算を行って比較検討する 必要がある。
次に Ar 以外のヘリウム(He),ネオン(Ne),クリプトン
(Kr),キセノン(Xe)について調べる。
それぞれの分子系の蒸気圧と温度を換算して,蒸気
圧曲線を比較して分子系の性質を知る。
Table 2 Lennard Jones parameters for reduction and the values of constant for Antoine equation. [3]
σ/m (ε/k)/K A B C
He 2.55E-10 10.22 5.32075 14.6515 274.95 Kr 3.66E-10 178.9 6.6307 416.38 264.45 Ne 2.82E-10 32.8 6.08444 78.38 270.55 Xe 4.05E-10 231 6.64289 566.282 258.66
Table 3 The vapor pressure was calculated using Antoine equation and then converted into dimensionless value using a couple of different Lennard-Jones parameters.
He Ne Kr Xe
Reduced temperature
Reduced vapor pressure
Reduced temperature
Reduced vapor pressure
Reduced temperature
Reduced vapor pressure
Reduced temperatu re
Reduced vapor pressure 0.00E+00 9.92E-08 7.32E-01 1.83E-03 6.15E-01 8.78E-04 6.93E-01 1.56E-03 9.78E-02 3.50E-05 8.23E-01 5.08E-03 6.99E-01 2.97E-03 7.58E-01 3.60E-03 1.96E-01 6.32E-04 9.15E-01 1.13E-02 7.83E-01 7.59E-03 8.23E-01 7.20E-03 2.94E-01 3.55E-03 1.01E+00 2.15E-02 8.66E-01 1.60E-02 8.87E-01 1.29E-02 3.91E-01 1.12E-02 1.10E+00 3.65E-02 9.50E-01 2.94E-02 9.52E-01 2.13E-02 4.89E-01 2.52E-02 1.19E+00 5.68E-02 1.03E+00 4.88E-02 1.02E+00 3.27E-02 5.87E-01 4.65E-02 1.28E+00 8.26E-02 1.12E+00 7.47E-02 1.08E+00 4.76E-02 6.85E-01 7.47E-02 1.37E+00 1.14E-01 1.20E+00 1.07E-01 1.15E+00 6.64E-02
換算したヘリウム,ネオン,クリプトン,キセノ ンとシミュレーション値を換算した蒸気圧曲線と比 較する。
0 0.1 0.2 0.3 0.4 0.5 0.6
0 0.5 1 1.5
Reduced vapor pressure[‐]
Reduced temperature[‐]
Reduced Ar He Ne Kr Xe
Fig.8 The plot of reduced vapor pressure. Reduced: the values of vapor pressure obtained from MD simulations were reduced by a couple of different Lennard-Jones parameters; Ar, He, Ne, Kr, Xe: the values of vapor pressure were calculated using Antoine equation and converted into dimensionless values by a couple of different Lennard-Jones parameters.
ヘリウムの蒸気圧曲線だけが他の曲線に比べて飛 び離れていることが見てとれる。この結果はヘリウ
ムだけ他の物質と違うことがわかる。これは,ヘリ ウムはとても軽い分子なため量子液体で,温度を下 げただけでは固体にならない物質であるからと考え られる。
次に Fig.9 においてレナード・ジョーンズパラメー
ターを用いて換算した蒸気圧曲線の縦軸を対数で表 す。
1.E‐08 1.E‐07 1.E‐06 1.E‐05 1.E‐04 1.E‐03 1.E‐02 1.E‐01 1.E+00
0 0.5 1 1.5
Reduced vapor pressure[‐]
Reduced temperature[‐]
Reduced Ar He Ne Kr Xe
Fig.9 The logarithmic plot of reduced vapor pressure.
0.0001 0.001 0.01 0.1 1
0.5 0.7 0.9 1.1 1.3 1.5
Reduced vapor pressure[‐]
Reduced temperature[‐]
Reduced Ar Ne Kr Xe
Fig.10 Magnified view of the logarithmic plot of reduced vapor pressure, except for He.
ヘリウムを除いたら,どの分子も大体同じところ に蒸気圧曲線がきていることが見てとれる。
5.結言
シミュレーションの沸点,臨界温度は巨視的実験 値と誤差が出たが,対数表示すると大体同じ場所に 曲線がある。この結果はシミュレーション自体成功 していると考えられる。
資料として,分子動力学計算のinput ファイル[4], 最終分子配置ファイル[5],グラフに使用したエクセ ルファイル[6]を添付する。
6. 参考文献
[1] 片岡洋右,三井崇志,竹内宗孝,“分子動力学法に よる物理化学実験”,三井出版,2000年
[2] P.W.ATKINS 訳 千原秀昭,中村亘男,アトキン
物理化学(上)第6版,東京化学同人,2001年 [3] 日本化学会,改正4版 化学便覧 基礎編Ⅱ [4] 1372Es+GT100K.inp
[5] 137GAS.bdl
[6] Arの気液平衡②
44
Copyright © 2012 Hosei University 法政大学情報メディア教育研究センター研究報告 Vol.26