the Creative Economy in Major Chinese Cities
著者 Mitsunami Kohei, Sakakibara Yuichiro 雑誌名 Kansai University review of economics
巻 20
ページ 1‑18
発行年 2018‑03
URL http://hdl.handle.net/10112/13435
1
A Study of Qualitative Urban Development and the Creative Economy in Major Chinese Cities
Kohei Mitsunami†, Yuichiro Sakakibara††
1 Introduction 1.1 Backgrounds
Focusing on the creative economy, this study examines the progress of “qualita- tive” development in major Chinese cities that have shown remarkable “quantita- tive” development and clarifies the relationship between the creative economy and urban development.
China has been pushing ahead with its transition from a socialist economy to a capitalist economy and has seen remarkable economic growth in recent years. Per capita GDP in China increased about fivefold between 2001 and 2013, from 8,622 yuan to 41,908 yuan,1) with the average annual growth rate during that period remaining above 7%, and the Chinese economy has experienced a great deal of growth in both nominal and real terms. Parallel to this economic growth, China has dramatically increased investments in research and development.2) For China to maintain sustainable economic growth, it must acquire the capacity to indepen- dently promote technological development and technological innovation.
This rapid growth in the Chinese economy has received a great deal of atten- tion in the literature on regional economics and related fields. However, the research on the Chinese economy in the field of regional economics is almost entirely focused on quantitative regional economic development against the back- drop of this rapid growth in the Chinese economy, and few studies examine the qualitative development of Chinese regional economies. Thus, we intend to inves- tigate whether qualitative regional economic development is progressing in Chinese cities that have seen remarkable quantitative economic development. The framework used in this report to analyze qualitative economic development in major Chinese cities is Richard Florida’s creative capital theory, which has † Faculty of Economics, Teikyo University.
†† Faculty of Economics, Kansai University.
1) From the China Statistical Yearbook 2014 (China Statistics Press, National Bureau of Statistics of China).
2) For example, R&D spending in China doubled in the five-year period from 2009 to 2013 from 580.21 billion yuan to 1.18466 trillion yuan.
attracted attention as a new theory of urban development. Using this theory, we intend to clarify several aspects of the qualitative development of major Chinese cities.
1.2 Development of major Chinese cities and creative capital theory
In recent years, several studies on creative capital theory in China have appeared.
For example, Florida (Florida et al., 2008b), using the same method used in Florida et al. (2008a), analyzed the relationship between regional development and levels of human capital (the creative class) and technology in China. Based on the estimations in that study, Florida makes two points. First, whereas tolerance and universities have a large impact on the distribution of the creative class in China, the service industry has little impact. Second, the creative economy as described in Florida et al. (2008a)—a mechanism whereby a concentration of the creative class leads to innovation and supports city and regional development—
does not yet exist in China. However, the analysis of Florida et al. (2008b) was not done at the city level but at the province level.3) The province-level data used include data for extensive rural areas outside the urban areas. Discussion regarding the creative economy has tended to focus on cities. Thus, analyses using province-level data can lead to a estimation bias. More detailed analysis is there- fore required.
Li (2013) has initiated research into creative industries in China. Creative industries are those based on individual creativity, skill, and talent that have the potential to generate wealth and employment via the development and use of intellectual property rights. This definition covers industries such as the fashion, advertising, publishing, film, music, and entertainment sectors. Li’s definition is close to Florida’s definition, while placing more emphasis on cultural aspects. Li emphasizes that, for the future development of China, creativity in science and technology as well as in culture must mutually improve and combine, enabling a transition from an age where products are “made in China” to one where they are
“created in China.” Building on Florida’s arguments, Li (2013) claims that Chinese cities where tolerance is high are attractive places with a free and easy social environment and a creative atmosphere, which provide an ideal environment for
“laboring, learning and living.” As an example of such a city that attracts the creative class, Li (2013) mentions Shanghai, which has a freely flowing environ- ment, a liberal attitude to different cultures and new things, and cultural and creative industry zones such as Tianzifang.
3) For example, some Chinese provinces, such as Guangdong, have populations greater than 100 million. The area of some Chinese provinces is larger than the whole of Shikoku in Japan.
1.3 Issues and the hypothesis
As described in the previous section, most creative capital theory research in China goes no further than introducing Florida’s arguments and making statis- tical observations. Only a few, such as Hong et al. (2011), include empirical anal- ysis, and Hong et al. (2011) carried out only a regression analysis of the distribu- tion of the creative class in China. Florida et al. (2008b) is the only empirical study that explains economic development in a multi-faceted and integrated way, exploring all three T’s (technology, talent, and tolerance), as in Florida et al.
(2008a). However, their analysis is at the province level, and more detailed economic development analysis at the city or region level is required.
Florida et al. (2008b) concluded that, for China as a whole, the creative economy does not exist. However, China has seen remarkable economic develop- ment in recent years, especially along its seaboard, and, from an industrial view- point, new firms have appeared, notably IT firms such as Xiaomi, which has a dominant share of the smartphone market in China. At the city level, China is also seeing the gradual formation of a creative economy in forward-thinking major cities.
Though Florida et al. (2008b) rejected the existence of a creative economy in China, we hypothesize that a creative economy has formed in some of China’s cities. This report also investigates the relationship between the creative economy and urban development in major Chinese cities.
Chinese economic research has focused on the “extensive” economic develop- ment due to expansion in capital and labor inputs, including migrant workers from rural areas, known as nóng mín gōng; in other words, there has been a focus on quantitative economic development. In this study, we focus on the creative economy from the viewpoint of sustainable economic development and investigate urban and regional qualitative development. Specifically, we empirically investi- gate the economic growth factors in major Chinese cities from the viewpoint of Florida’s creative capital theory using econometric analysis based on Florida et al.
(2008a).
2 Empirical analysis
In this section, we empirically confirm the qualitative development in Chinese cities and regions discussed in the previous section and the “germination” of the creative economy in China. We empirically investigate how each of the three T’s discussed by Florida has impacted urban economic development and construct panel data at the city level based on Formula (1):
Regional Developmentit = Technologyit + Talentit + Toleranceit + X + ai + εit (1) Using the economic level (per capita GDP) of each city as a dependent (explained) variable to control for the impact of factors such as change in
economic activity in the country as a whole, we added a dummy for each financial year to the model. In addition, given that China’s economic development has been extensive, as mentioned in the first section, we added corporate fixed asset value to the model. The annual dummy and the value of corporate fixed assets for each year in each city were combined as a control variable and shown as “X.”
Definitions of the independent (explanatory) variables, excluding X, are given below along with a discussion of the three T’s.
2.1 Technology
Florida et al. (2008a) defined the technological level of each city via a tech-pool indicator derived using the value of production in high-tech industries. Boschma et al. (2009) defined it using the number of patents per 10,000 residents. Various other definitions have been used depending on the researcher or the region being researched. We define the level of a city’s technology from the viewpoint of “public sector” rather than that of the “private sector,” for two reasons. First, it is hard to obtain data (such as R&D spending as input data or the number of patents as output data) on the level of technology in the private sector at the city level.
Second, until around the 1980s, the key role in Chinese science and technology development was played, not by ordinary companies, but by universities and government research institutes; even today, universities and government research institutes play a very important role, particularly in the development of high tech- nology (Seki, 2007). Therefore, this report defines the level of a city’s technology as its science and technology investment as a percentage of its fiscal spending.
2.2 Talent
Florida defines the creative class as scientists and engineers, university profes- sors, software programmers, and those working in fields such as the high-tech, financial, legal, healthcare, education, art, music, and entertainment sectors (Florida, 2002a, 2014). Because this definition is very broad and lacks rigor, we combined the industry classifications in official data with Florida’s definition, so that our definition of creative class comprises people involved in the computer, software, financial, scientific research, technical service, education, healthcare, culture, sport, and entertainment industries. Accordingly, our definition of the
“talent” variable is the creative class as a percentage of all the city’s workers.
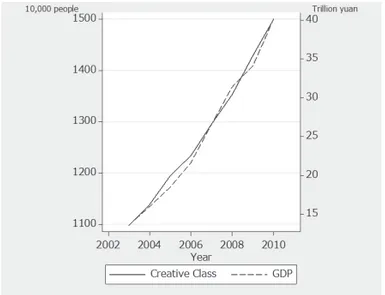
Figure 1 shows that the creative class has grown substantially in China in line with economic development.
2.3 Tolerance
In this report, “tolerance” is defined based on both i) the discussion in Florida (2002b, 2002c) and Boschma et al. (2009) regarding the factors that attract the creative class (i.e., a city’s cultural level, its diversity and openness, and its amenities) and ii) the discussion in Glaeser et al. (2001) on the Consumer City. In other words, a city’s tolerance is understood to be the degree to which the city provides an environment that can attract the creative class, foster innovation, and underpin the economic development of the city and the region. The insertion of all the variables below into the econometric models allows the level of tolerance in a city to be understood from a number of viewpoints. Specifically, we use 1) the number of universities per 10,000 residents (the name assigned to this variable is
“Universities”); 2) the number of public library books per 10,000 residents (“Library books”); 3) the area of green space per resident (“Green space”); 4) road area per resident (“Roads”); and 5) a Bohemian index (“Bohemian Index”). The formula for calculating the Bohemian Index is shown below:
Bohemianit = ( Bohemiansi t
Populationi t)/( Bohemiansall t
Populationall t)
Bohemianit denotes the Bohemian Index in year t for City i; Bohemiansi t, the number of Bohemians in year t in city i; Populationi t, the population of city i in year t; Bohemiansall t, the number of Bohemians in year t for all the cities in the analysis; and Populationall t, the population of all the cities in the analysis in year t. The research indicates that cities where many Bohemians feel able to work are rich in terms of culture such as music and art and are open, in that they accept people from a variety of cultures and holding a variety of values. The Bohemia Index is therefore a proxy index for diversity and openness.
Figure 1 Trends in urban creative class and GDP (2003–2010)
Source: Compiled by the authors based on data from the China Statistical Yearbook and China City Statistical Yearbook for each year.
However, because of data limitations, it is not possible to extract only those who comprise the group dubbed “Bohemian” (those who work, for example, as artists—including painters and sculptors—musicians, writers, designers, or dancers) in research targeting Europe and the US. Thus, in line with the occupa- tion classifications used in the official data, Bohemians are defined in this report as those involved in the cultural, sport, or entertainment industries. The occupa- tion classifications are broad and imprecise and include many people who fall outside the Bohemian class as envisaged by Florida. Therefore, we use the Bohemian Index as a trial proxy index that allows us to grasp the cultural aspects and trends in each city (even if it includes factors other than those that are purely cultural). This point is dealt with again in our Conclusion, as one of the issues that require further investigation. The “tolerance” factor in each city is defined in a multifaceted way from the viewpoint of the city’s amenities such as provision of education, public services, scenery, environment, and transport network and from the viewpoint of diversity and openness using the Bohemian Index.
Table 1 Correlation coefficients for each tolerance variable and level of economic development (2010)
Universities Library books Green space Roads Bohemian Index
Per capita GDP 0.49 0.57 0.21 0.52 0.45
Source: Compiled by the authors based on data from the China City Statistical Yearbook for 2011.
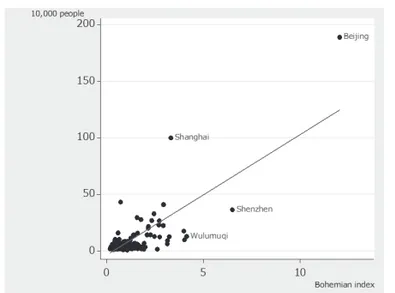
Table 1 shows that there are correlations of varying strengths between each variable and the city’s economic development level. The Bohemian Index, with specific characteristics in Florida’s research, as shown in Figure 2, also has a posi- tive correlation with the number of creative class residents. Figure 2 suggests the possibility of a high number of creative class residents in cities with a high number of Bohemian residents compared to other cities (those with a high Bohemian Index). This shows that the Chinese creative class may be attracted to a city by its cultural level and by its openness and diversity.
The Bohemian-related data and criteria used in this report differ from those used in Florida (2002b), which examined Bohemian distribution in Europe and the US; a simple comparison is thus impossible. However, whereas the highest value of the Bohemian Index in Florida (2002b) was 1.93, the highest value in this report was 19.37, for Beijing in 2005. Therefore, the fact that some Chinese cites attract more Bohemians than US cities do can be described as a Bohemian-related characteristic of China.
There was not enough space in Figure 2 to enter the names of all the cities, but those of four characteristic cities are included. As well as Beijing and Shanghai (which, as mentioned by Li [2013], have cultural and creative industry zones such as the 798 Art District and Tianzifang, which attract a large number of artists), a relatively large number of Bohemians are also attracted to Shenzhen (which
contains Dafen Oil Painting Village, with a substantial share of the global market in reproductions) and Wulumuqi (the largest city in western China, where many people from minority ethnic groups live, with a variety of cultures differing from that of the majority Han Chinese ethnic group). This result is consistent with the current situation in China. Therefore, the Bohemian Index may accurately reflect actual diversity and openness.
2.4 Models and variables
Based on the above explanations, in this section, we describe the specific empirical models used in our analysis. Moretti (2012) stresses the importance of the concen- tration of innovative high-tech industries and their skilled workers in a city and of the knock-on effect of that concentration on the local economy. Commenting on some of Florida’s research, Moretti (2012) highlights the importance of the accu- mulation of human capital and the innovation it generates. At the same time, he expresses skepticism about the attractiveness of cities. Moretti suggests that rich cultural provision occurs in a city once a firm economic base has been built, rather than the other way around. He argues that, while a high quality of life can attract desirable workers and help a city become economically successful, quality of life alone cannot drive the change of an economically stagnant city into an innovation hub.
However, Florida’s theory, based on the current situation whereby the creative class values quality of life as much as they value wages when deciding where to live, is that urban development requires all three elements (an attractive city with a high quality of life, many members of the creative class, and technological devel- opment). Thus, Moretti’s ideas differ somewhat from those of Florida. In addition, Edward Glaeser’s critique (Glaeser, 2013) of Moretti (2012) suggests that Florida’s
Figure 2 Bohemian Index and the creative class (2010)
Source: Compiled by the authors based on data from the China City Statistical Yearbook for 2011.
discussion is more wide-ranging that Moretti suggests, that attracting the creative class is central to the argument, and that the environment and the attractiveness of the city to the creative class are also important factors. Of course, Florida (2004) had already questioned the cause-and-effect relationship (“what came first, the chicken or the egg?”) suggested by Moretti, and he proposes a counter-argu- ment, citing examples where over-gentrification has, conversely, reduced the attractiveness of a region.
However, the suggestion that a region that has enjoyed economic development is likely to attract the creative class is comparatively persuasive, as is the sugges- tion that it is likely to be easier to invest in science and technology after a region has seen some development. Thus, in this report, having rewritten Formula (1) in the style of Formula (2) to produce our empirical model, we control for the afore- mentioned problem relating to the cause-and-effect (backward causation) relation- ship (“what came first, the chicken or the egg?”) by performing estimations using models in which the independent (explanatory) variables in the Formula (2) model are all changed to respective variables with a one- and two-term lag:
Per capita GDPit
= Technologyit + Creative classit + Universitiesit + Librariesit (2) + Green spaveit + Roadsit + Bohemian Indexit
+ Fixed assetsit + d2004 + … + d2010 + ai + εit
Here “fixed assets” is the log of the value of the fixed assets of all “industrial companies above a certain size.”4) The value for fixed assets is their cost less amor- tization. In addition, d2004 to d2010 are annual dummies. To provide respective benchmarks, d2004 is not included among the models where the explanatory vari- able lags by one term, and d2005 is not included among the models where the explanatory variable lags by two terms. As mentioned, “fixed assets” are included to control for the impact of capital inputs such as factories based on the assump- tion that Chinese economic development has been extensive. The annual dummies control for the impact of changes in economic activity.
Data were obtained from the China City Statistical Yearbook (National Bureau of Statistics of China, China Statistics Press), and panel data were constructed for those prefectural-level cities that had no missing or extraordinary values and so were suitable for analysis. However, given that many members of the creative class are concentrated in the core Chinese economic areas of Guangzhou and the directly controlled municipalities of Beijing, Tianjin, Chongqing, and Shanghai, including those cities in the estimations could bias the results. Thus, the above five cities are excluded from the sample. Because of limitations in the continuity
4) Industrial companies above a certain size are state-owned companies and large and medium- sized enterprises with annual sales of 5 million yuan or more that are not state-owned.
From 2011, the criterion was raised to 20 million yuan.
of the available data, the years subject to analysis (the financial years in the explained variable data) cover the eight-year period from 2003 to 2010 (analysis in which the explanatory variable lags by one term covers the seven-year period from 2004 to 2010; analysis in which the explanatory variable lags by two terms covers the six-year period from 2005 to 2010). Because the analysis is at the city level, we use a fixed effect model5) able to exclude individual effects that do not change over time, such as regional characteristics. Descriptive statistical values are listed at the end of the report (Table 2).
3 Estimation results
The results of estimations using the Formula (2) empirical model are presented at the end of the report (Table 3). The discussion below is based of those results.
First, we will discuss the results of estimations using model ① , which used data for the same year for the dependent (explained) variables and the indepen- dent (explanatory) variables. Among explanatory variables showing a city’s toler- ance, the number of public library books and the Bohemian Index were significant but Universities, Green space, and Roads did not produce a significant effect. As the variable showing the accumulation of the creative class in the city was signifi- cant at the 5% level, the accumulation of the creative class was shown to be an important element in urban development. The variable showing the city’s techno- logical level showed a significant effect at the 1% level, indicating that the higher the proportion of a city’s expenditure on science and technology (i.e., the more actively it invested in science and technology), the more developed its economy.
Furthermore, all the control variables showed significant results.
Next, we will discuss the results obtained with Models ② and ③ , in which all the independent (explanatory) variables in Formula (2) are changed to variables that lag by one term or two terms. With model ② , it was possible to obtain esti- mation results broadly similar to the results with model ① , though the signifi- cance levels differed for some variables. With model ③ , however, although the 5) In our estimations, we used the Hausman test, the Breusch-Pagan test, and an F-test.
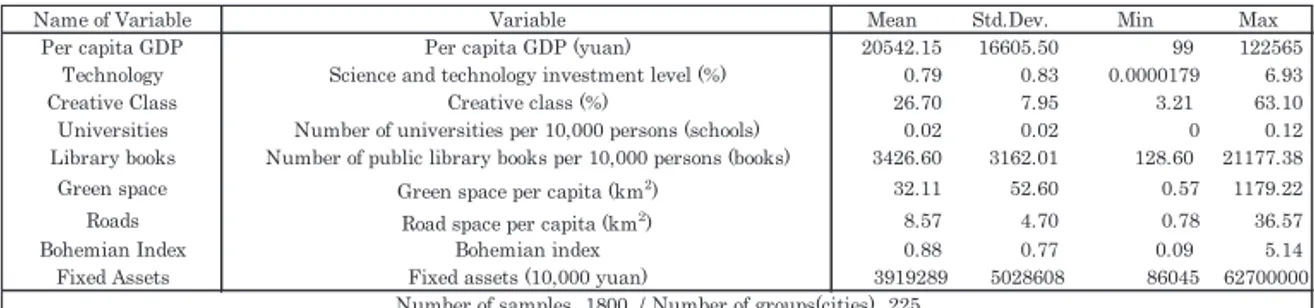
Table 2 Descriptive statistics
Source: Compiled by the authors based on the China City Statistical Yearbook
Name of Variable Variable Mean Std.Dev. Min Max
Per capita GDP Per capita GDP (yuan) 20542.15 16605.50 99 122565
Technology Science and technology investment level (%) 0.79 0.83 0.0000179 6.93
Creative Class Creative class (%) 26.70 7.95 3.21 63.10
Universities Number of universities per 10,000 persons (schools) 0.02 0.02 0 0.12
Library books Number of public library books per 10,000 persons (books) 3426.60 3162.01 128.60 21177.38
Green space Green space per capita (km2) 32.11 52.60 0.57 1179.22
Roads Road space per capita (km2) 8.57 4.70 0.78 36.57
Bohemian Index Bohemian index 0.88 0.77 0.09 5.14
Fixed Assets Fixed assets (10,000 yuan) 3919289 5028608 86045 62700000
Number of samples 1800 / Number of groups(cities) 225
overall trend did not differ greatly from that in model ① , the variable showing the accumulation of the creative class showed an insignificant effect, while the number of universities had a significant result. The fact that the number of universities variable showed a significant result only in the model ③ estimations suggests that the effect of a provision of state-funded education such as universi- ties may emerge gradually over time.
Because the variables used are different from those used by Florida et al.
(2008b), whose analysis covered the whole of China, direct comparison is not possible. However, given the results of estimations with models ① , ② , and ③ as well as Moretti’s suggestions, the empirical results in this section show that a creative economy is at work in some of China’s major cities, despite the fact that Florida et al. (2008b) rejected the existence of a creative economy in China as a whole. This result supports the hypothesis of this report.
However, looking at individual results, significant results were not obtained for the variable reflecting the accumulation of the creative class when all independent (explanatory) variables were transposed by two terms. Therefore, we cannot completely rule out the possibility of backward causation, as suggested by Moretti.
We discuss this point further in section 5 as an issue that requires further inves- tigation.
The sample used for the above analysis excluded Beijing and Shanghai, cities Table 3 Estimation results
Note: * 10% significance ** 5% significance *** 1% significance Source: Compiled by the authors from estimation results.
Coefficient t-value Coefficient t-value Coefficient t-value
Universities 20938.13 0.75 41134.50 1.43 64480.33** 2.08
Library books 0.66*** 6.23 0.38*** 3.43 0.49*** 4.08
Green space -1.06 -0.41 -1.65 -0.64 -3.06 -1.11
Roads 66.68 1.21 32.28 0.56 15.97 0.26
Bohemian Index 1249.15*** 3.11 1539.74*** 3.81 1600.44*** 3.79
Fixed assets (logarithmic value) 1540.73*** 3.17 3073.48*** 5.69 3146.03*** 5.84
2004 dummy 2054.18*** 4.93
2005 dummy 3636.07*** 8.27 1592.73*** 4.05
2006 dummy 5703.70*** 11.92 3639.12*** 8.65 2184.14*** 5.84
2007 dummy 4730.81*** 8.51 6315.32*** 13.48 5040.65*** 12.35
2008 dummy 8045.21*** 12.87 6205.21*** 11.05 8258.97*** 17.75
2009 dummy 9832.42*** 13.07 7711.41*** 11.99 7664.46*** 13.21
2010 dummy 14304.65*** 17.28 11589.53*** 14.64 11831.01*** 17.56
Constant -18724.56*** -2.62 -36910.42*** -4.65 -34081.34*** -3.95 Number of samples
Number of groups (cities)
Coefficient of determination 0.77 0.76 0.75
1800 1575 1350
225 225 225
8.65
Creative class 119.11** 2.44 103.03** 2.02 22.43* 0.39
Technology 4112.20*** 17.59 3624.53*** 14.35 2496.62***
Dependent variable: Per capita GDP (current fiscal year)
Independent variables Current fiscal year (Model ①) 1-year lag (Model ②) 2-year lag (Model③)
with a very high concentration of the creative class. We omit the relevant descrip- tive statistics and estimation results to save space, but no great difference from the above estimation results was observed when an analysis including these cities was conducted. We also repeated the analysis with a model that excluded the number of universities per 10,000 residents, a variable that is not expected to change significantly over time. The result of that analysis also differed little from the above estimation results, confirming a certain degree of robustness for the above models.
4 Creative economy and classification of major Chinese cities
In this section, we investigate the relationship between development in Chinese cities and the creative economy by standardizing all the indicators appearing in the data (see Tables 5 to 7 at the end of this report) used in the analysis in the previous section and attributing each a score. The indicators concerned are per capita GDP, the Creative Index6), the Three T’s (technology, talent, and toler- ance7)), the ratio of production attributable to foreign-owned companies8) within the total value for industrial production in each city, and the number of universi- ties.9) Because foreign-owned companies are considered to have driven the quanti- tative development of the Chinese economy, this element is not included in the analysis in the previous section. In this section, however, data for the ratio of companies with foreign ownership are added, and their impact is investigated. All data are for 2010. Classifications and definitions are based on Florida (2002a, 2014), as in the previous section, and numerical values were calculated indepen- dently in this report, as detailed below.
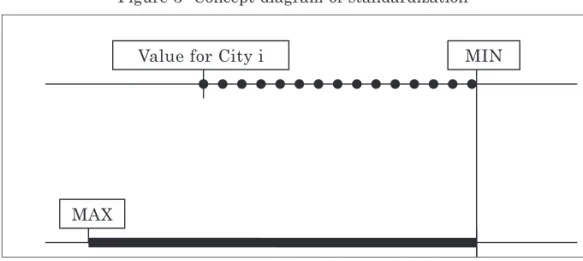
The various data items are hard to compare because they have various forms, such as per capita values and ratios. Thus, they have been standardized, as shown below:
Vij = Xij−MINj
(MAXj−MINj) × 100
where Vij is the value of standardized indicator j for city i,, and Xij is the value for the actual calculation of indicator j for city i. In addition, MINj represents the smallest value for indicator j among all the cities, and MAXj represents the 6) Average value of each of the three T elements (technology, talent, tolerance), standardized.
7) Average value of the elements of Tolerance (Library books, the Bohemian Index, and Universities with a two-year lag) that were significant in the empirical analysis in the previous section.
8) Foreign-owned companies in this report, following the description of Jo (2014), comprise companies from Japan, Europe, and the US and include companies with ownership from Hong Kong, Macau, and Taiwan.
9) Standardized based on the value with a two-year lag.
greatest value for indicator j among all cities. In other words, it is possible to iden- tify each city’s percentage from the bottom by subtracting the minimum value from the value for the city and dividing the result by the maximum value minus the minimum value (see Figure 3). The standardized values are between 0 and 100 and are expressed as a “score” in this section.
In the previous section, 225 cities were subject to analysis, with major cities Beijing, Tianjin, Shanghai, Chongqing, and Guangzhou excluded to avoid bias due to the inclusion of outlying values. The major cities excluded in the previous section were included in the data in this section, and, after excluding cities with values missing from the newly added data for foreign-owned companies, we constructed a 2010 database (222 cities) relating to China’s creative economy.
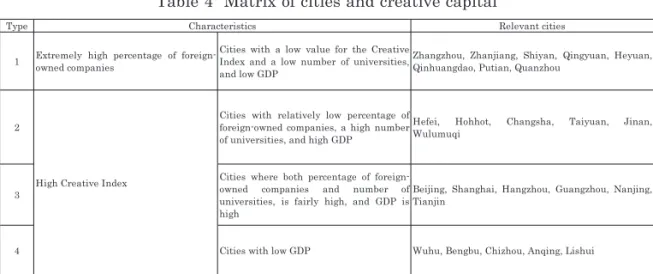
Space constraints make it difficult to discuss everything. Thus, we investigate the relationship between Chinese urban development and the creative economy, focusing on the top and bottom 20 cities in terms of the Creative Index and the top 20 cities in terms of percentage of foreign-owned companies covered in Tables 5 to 7. Table 4 categorizes the major cities of China into types based on their percentage of foreign-owned companies and the Creative Index. Table 4 is presented at the end of this report.
We conducted the following investigation regarding the characteristics of each type of city shown in Table 4. First, cities with a remarkably high percentage of foreign-owned companies compared to other cities tended to have few creative class residents, relatively few universities, and low GDP (Type 1). This result could occur because the activities of foreign-owned companies consist of no more than, for example, straightforward assembly, with no technology spillover and no contribution to the development of the city’s technology level. In some cities, the proportion of residents classified as Talent (the creative class) is high, but this may be because they are employed by foreign-owned companies. However, because these cities have a generally low level of technology and tolerance, it seems likely
MIN
MAX
Value for City i
Figure 3 Concept diagram of standardization
Source: Compiled by the authors
that no spillover of technology occurs from the foreign-owned companies and that the attractiveness of these cities is low. Therefore, if the foreign-owned companies leave these cities, perhaps because of wage increases, the creative class has no reason to stay and could end up leaving too. Jacobs (1984) suggested the likeli- hood that cities that have become production bases for outside companies develop while those companies remain in place but decline after they move away. This is a problem that could apply to Type 1 cities.
Second, some cities (Type 2) have few foreign-owned companies but a relatively high number of universities and a high percentage of creative-class residents.
These cities are balanced in terms of their Talent score and have relatively high GDP. This implies, as suggested by Florida et al. (2008b), that a close relationship obtains between the existence of universities and the distribution of the Chinese creative class. Type 2 cities do not rely on the location of foreign-owned compa- nies, and their universities attract high-quality personnel. All Type 2 cities apart from Hefei have a low level of technology, but these cities may become creative hubs that independently generate innovation as their attractiveness and concen- tration of creative class residents grow. At the same time, most of these cities are located outside the seaboard area, in central or western China, where growth is expected. Thus, these cities may become pivotal to the development of these regions.
Third, cities where the number of universities, proportion of foreign-owned companies, and 3T score are all fairly high have a high Creative Index and high GDP (Type 3). It is likely that these cities enjoy technological spillover from the foreign-owned companies and that their universities are engaged not only in education but also in tie-ups with foreign-owned and Chinese companies, through which technology also spreads out into the city. In addition, the creative class could play a significant role in deepening the innovation process, making these cities creative hubs for China.
Table 4 Matrix of cities and creative capital
Source: Compiled by the authors.
Type Relevant cities
1 Extremely high percentage of foreign- owned companies
Cities with a low value for the Creative Index and a low number of universities, and low GDP
Zhangzhou, Zhanjiang, Shiyan, Qingyuan, Heyuan, Qinhuangdao, Putian, Quanzhou
2 Cities with relatively low percentage of
foreign-owned companies, a high number of universities, and high GDP
Hefei, Hohhot, Changsha, Taiyuan, Jinan, Wulumuqi
3
Cities where both percentage of foreign- owned companies and number of universities, is fairly high, and GDP is high
Beijing, Shanghai, Hangzhou, Guangzhou, Nanjing, Tianjin
Characteristics
High Creative Index
4 Cities with low GDP Wuhu, Bengbu, Chizhou, Anqing, Lishui
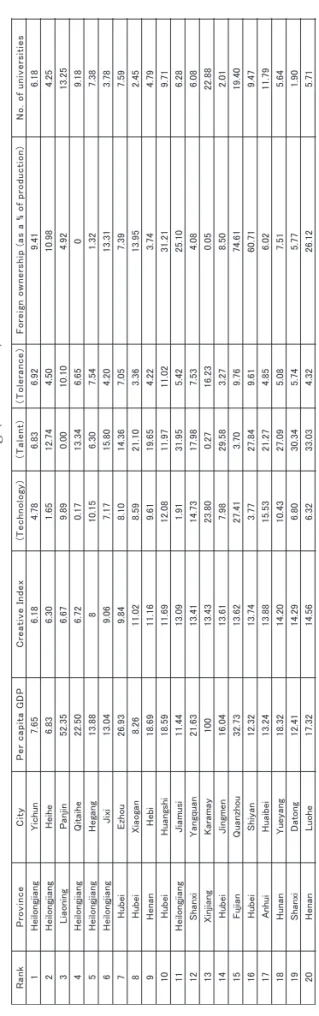
Table 5 Creative Index ranking (top 20) Source: Compiled by the authors.
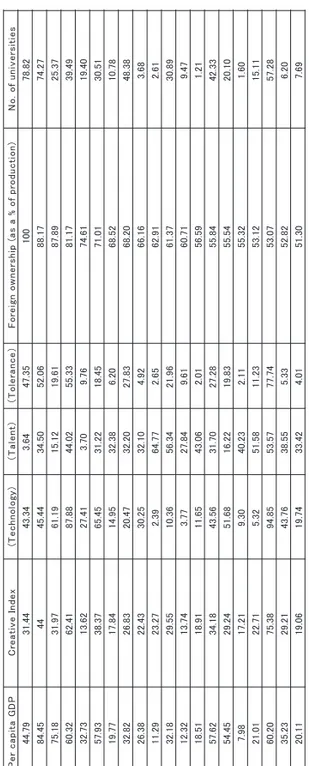
RankProvinceCityPer capita GDPCreative Index(Technology)(Talent)(Tolerance)Foreign ownership (as a % of production)No. of universities 1BeijingBeijing60.2075.3894.8553.5777.7453.0757.28 2ShanghaiShanghai60.3262.4187.8844.0255.3381.1739.49 3AnhuiHefei41.6953.1580.9942.6635.8133.0378.74 4AnhuiWuhu3649.0710030.5716.6531.1043.01 5ZhejiangHangzhou54.8544.1866.4829.8536.2340.1448.07 6GuandongGuangzhou84.454445.4434.5052.0688.1774.27 7Inner MongoliaHohhot52.3143.7712.9470.8547.5334.2885.53 8HunanChangsha51.8943.1845.9946.2037.3512.0169.18 9Anhui Bengbu9.1340.2845.0570.525.2621.2611.84 10JiangsuNanjing49.7839.6242.1335.1641.5850.2659.66 11ShanxiTaiyuan37.6838.8333.6935.0947.7210.5588.80 12GuandongZhongshan57.9338.3765.4531.2218.4571.0130.51 13AnhuiChizhou12.4736.5119.1081.429.016.5610.57 14ShandongJinan44.4635.8024.2432.0751.0711.50100 15AnhuiAnhui9.9935.0319.6082.383.115.883.45 16XinjiangWulumuqi31.3934.9916.8247.9740.192.0869.46 17JiangsuChangzhou52.6634.4642.8646.6713.8644.6222.14 18TianjinTianjin57.6234.1843.5631.7027.2855.8442.33 19GuandongFoshan7634.0843.2450.238.7842.476.55 20ZhejiangLishui21.1133.6723.7368.448.834.979.79 Table 6 Creative Index ranking (bottom 20) Source: Compiled by the authors.
RankProvinceCityPer capita GDPCreative Index(Technology)(Talent)(Tolerance)Foreign ownership (as a % of production)No. of universities 1HeilongjiangYichun7.656.184.786.836.929.416.18 2HeilongjiangHeihe6.836.301.6512.744.5010.984.25 3LiaoningPanjin52.356.679.890.0010.104.9213.25 4HeilongjiangQitaihe22.506.720.1713.346.6509.18 5HeilongjiangHegang13.88810.156.307.541.327.38 6HeilongjiangJixi13.049.067.1715.804.2013.313.78 7HubeiEzhou26.939.848.1014.367.057.397.59 8HubeiXiaogan8.2611.028.5921.103.3613.952.45 9HenanHebi18.6911.169.6119.654.223.744.79 10HubeiHuangshi18.5911.6912.0811.9711.0231.219.71 11HeilongjiangJiamusi11.4413.091.9131.955.4225.106.28 12ShanxiYangquan21.6313.4114.7317.987.534.086.08 13XinjiangKaramay10013.4323.800.2716.230.0522.88 14HubeiJingmen16.0413.617.9829.583.278.502.01 15FujianQuanzhou32.7313.6227.413.709.7674.6119.40 16HubeiShiyan12.3213.743.7727.849.6160.719.47 17AnhuiHuaibei13.2413.8815.5321.274.856.0211.79 18HunanYueyang18.3214.2010.4327.095.087.515.64 19ShanxiDatong12.4114.296.8030.345.745.771.90 20HenanLuohe17.3214.566.3233.034.3226.125.71