WASEDA BUSINESS & ECONOMIC STUDIES 2013 NO.49
“Effects of changes in provincial governance on the economic performance of the business
sector: an empirical study using Vietnam’s Provincial Competitiveness Index”
Huu Viet
1Phan
Abstract
This study explores how changes in provincial governance affect the economic performance of the business sector by utilizing a unique unbalance panel dataset that includes the 2006-2010 Vietnamese Provincial Competitiveness Index (PCI) merged with two different datasets on firm economic performance. We find evidence that there is a significant positive relationship between provincial governance reforms and the business- sector economic performance. Out of nine sets of provincial governance reforms defined in the PCI, we find that the following reforms positively associate with the economic performance of the business sector: (1) improvement in private support services, (2) more pro-activity of provincial leadership in solving problems for enterprises, (3) easier land access and more security of tenure (a proxy for better property rights-of-uses), and (4) reduction of informal charges (a proxy for less corruption). However, the effects of easier land access - more security of tenure and reduction of informal charges are less robust with some estimation techniques and model identifications. This study contributes evidence to current literature on subjects of institutional changes (or governance reforms) and their effects on economic performance at the province-firm level.
Keywords: provincial governance, institutions, economic performance and provincial competitiveness index (PCI), Vietnam.
JEL classification: H70, L25, L53.
1 Corresponding author, Graduate School of Commerce, Waseda University Email: [email protected] or [email protected]
1. Introduction
Motivated by the effects of institutional changes on economic development, our research objective is to examine the relationship between institutional changes, or provincial governance reforms, and development of the business sector at a provincial level. Economic literatures on institutions, institutional changes and their effects on economic growth have been widely documented in previous studies (North, 1981, 1991;
Glaeser, La Porta & Shleifer, 2004; Aoki, 2005; Chang, 2006 among others). There is strong evidence indicating the positive effects of institutional changes on economic development at macro level. However, there still exists a need for further research to explore how institutional changes affect economic development at the micro level. For any country, the success of the business sector links with employment creation, improvement in investment and trade, accelerated tax collection, and enhancement of national competitiveness. These factors eventually and importantly contribute to socio- economic development and growth at either the national or provincial level of the country. Many countries, therefore, try to work out appropriate policies facilitating more favorable conditions for the startup and operations of the business sector. However, the national policies triggering these institutional changes are implemented differently across the country, associated with different efforts and specific initiatives of each province. The question of how provincial institutional changes (or governance reforms) affect the development and success of the business sector becomes important to regulators, policy makers, entrepreneurs, industrialists, and academia.
In this research, we employ the Provincial Competitiveness Index (PCI 2) which has been jointly developed by the Vietnam Chamber of Commerce and Industry (VCCI) and USAID since 2005. The PCI is an aggregate indicator that measures and assesses the conditions of economic governance toward business-sector development for 64 provinces in Vietnam 3. The PCI is good tool for examining how each province initiates policies to
2 Based on the rigorous survey of collective perceptions of 8053 private entrepreneurs in Vietnam regarding economic governance in their province and the country, the PCI is constructed in a three-step procedure: (1) collect business survey data and published data sources, 2) calculate nine sub-indices and standardize to a 10-point scale, and 3) calibrate the composite PCI as the weighted mean of nine sub-indices with a maximum score of 100 points. See Malesky (2008, 2010) for more details on PCI’s construction methodology and calculation.
3 64 Vietnam Provinces included in the PCI: An Giang, Bac Giang, Bac Kan, Bac Lieu,
facilitate institutional changes or governance reforms, how the changes affect development of the business sector, and which of governance reform package is the most effective toward business-sector success. The PCI consists of nine sub-indices, including:
Entry costs, Land access and security of tenure, Transparency and access to information, Time costs, Pro-activity, Informal charges, Business support services, Labor training, Legal institutions (See Table 2 for definitions). Higher values for the PCI and its sub- indices reflect better institutional changes, more regulatory and governance reforms at the provincial level. The better market-supporting mechanism derived from the governance changes is likely to be the determinant of business-sector success. The PCI has become an important indicator and has actually entered the official discussion agenda of most of provinces across the country.
Due to its policy implications, the PCI has been used in several policy studies (McCulloch, Malesky & Duc, 2013; Malesky & Taussig, 2009; Nguyen N & Nguyen T, 2007 and Anh, Thai & Thang, 2007). However, these previous studies generally show an insignificant relationship between the institutional changes and economic development at the micro level. In this study, our research objective is to shed more lights on this relationship by extending the use of the PCI and its sub-indices in the form of panel data and by constructing new datasets of firm-level performance. In particular, we use weighted PCI ratio (also provided by the VCCI) to control differences in the impact levels of an individual sub-index on the economic performance of the business sector.
Our new firm databases which include audited firm-level economic performance indicators are expected to mitigate the limitations recognized in the previous studies. We expect to (1) find a significant relationship between the provincial governance changes and business-sector performance, and (2) analyze the business policy implications from the research results.
We find evidence that there is a significantly positive relationship between provincial
Bac Ninh, Ben Tre, Binh Dinh, Binh Duong, Binh Phuoc, Binh Thuan, BRVT, Ca Mau, Can Tho, Cao Bang, Da Nang, Dak Lak, Dak Nong, Dien Bien, Dong Nai, Dong Thap, Gia Lai, Ha Giang, Ha Nam, Ha Noi, Ha Tay, Ha Tinh, Hai Duong, Hai Phong, Hau Giang, Hoa Binh, Hung Yen, Khanh Hoa, Kien Giang, Kon Tum, Lai Chau, Lam Dong, Lang Son, Lao Cai, Long An, Nam Dinh, Nghe An, Ninh Binh, Ninh Thuan, Phu Tho, Phu Yen, Quang Binh, Quang Nam, Quang Ngai, Quang Ninh, Quang Tri, Soc Trang, Son La, Tay Ninh, Thai Binh, Thai Nguyen, Thanh Hoa, Tien Giang, Tp.HCMC, Tra Vinh, TT.Hue, Tuyen Quang, Vinh Long, Vinh Phuc, and Yen Bai.
efforts in improving local institutional conditions (or governance reforms) and the business-sector economic performance. Among nine packages of provincial governance changes, we find that the followings exhibit a positive association with the economic performance of the business sector, using different estimation methods: (1) improvement in private support services, (2) more pro-activity of provincial leadership in solving problems for enterprises, (3) easier land access and more security of tenure, and (4) reduction of informal charges. Firstly, the result suggests that improvements in provincial private support services (for instance, trade and investment promotion events, partner matching, or legal document assistance) will bring benefits to the local firms. Secondly, the result highlights the important role of top provincial leadership on development of the local business sector. When provincial leaders pay attention to and addressing the difficulties and obstacles of the local business sector, the profitability of local firms tends to be enhanced. Thirdly, this result also implies that more favorable land policies associate with better firm performance, because they encourage firms to confidently undertake new investments and expand their businesses. Lastly, the result supports the argument that the mitigation of unofficial extra fees (informal charges) in doing business will help firms save financial resources and enjoy fairer business competition. Even though, land access and security of tenure (a proxy for property rights-of-uses) and reduction of informal charges (a proxy for corruption) are less robust in some model specifications, their positive relationship with provincial business-sector performance is worthy of attention. All together, the results of this study provide insights on policy implications and directions for local governments to explore when targeting the most sufficient governance packages for better market-supporting mechanism and institutions that contribute to business- sector development.
The study is organized as follows. Section 2 contains the literature review. Section 3 discusses our study’s research objectives and hypotheses. Section 4 describes the study’s data and basic statistics. Section 5 and 6 present the results of empirical estimations and those of additional tests, respectively. Section 7 concludes the study.
2. Literature Review
The effects of institutions and institutional changes on economic growth have been widely documented in previous studies (North, 1981, 1991; Glaeser et al., 2004; Aoki, 2005; Chang, 2006 among others). In his well-known study, North (1981) provided a definition of an institution as “a set of rules, compliance procedures and moral and ethical behavioral norms designed to constrain the behavior of individuals in the interests of
maximizing the wealth or utility of principles”. More recently, Chang (2006) argued that institutional change or ‘governance reform’ promotes economic development in three key aspects: (a) coordination and administration, (b) learning and innovation, and (c) income redistribution and social cohesion. Although there is still argument on definition of the term “institutions” (Chang, 2006), the previous studies show consistent arguments supporting the importance of institutional changes on economic development. Most of the previous studies on institutions and economic development were conducted at a macro level and focus on cross-country data (McCulloch, Malesky & Duc, 2013).
North (1991) further discusses that institutions contain either formal rules (constitutions, law and property rights) or informal constraints (sanctions, customs, traditions and code of conducts). However, constitutions and legal frameworks are applied similarly across a country, especially in developed countries where institutional reforms have taken place long ago. In an emerging country, it is argued that the quality of market institutions and regulatory frameworks may vary across each provincial government of the country. In addition, perceptions on the importance of reforms for local economic development also differ among provinces. The implementation of institutional changes or governance reforms is thus dependent on provincial efforts and perceptions. Indeed, there is research exploring how institutional changes affect firm-level development and growth. However, more empirical studies are needed to aim at testing effects at the provincial level.
Since the introduction of the Vietnam’s PCI in 2005, some studies have utilized the PCI and its sub-indices to investigate the effects of institutional reforms and economic development. Malesky (2013) summarized the index’s scope: “The PCI comprises nine sub-indices, reflecting economic governance areas that affect private sector development.
A province that is considered to perform well on all nine PCI sub-indices is the one that has: 1) low entry costs for business start-up; 2) easy access to land and security of business premises; 3) a transparent business environment and equitable business information; 4) minimal informal charges; 5) has limited time requirements for bureaucratic procedures and inspections; 6) proactive and creative provincial leadership in solving problems for enterprises; 7) developed and high-quality business support services; 8) sound labor training policies; and 9) fair and effective legal procedures for dispute resolution”.
To start with, Malesky and Taussig (2009) examined the impacts of provincial institutions on business formalization in Vietnam using the PCI and its sub-indices.
These authors argue that there were two sub-indices representing corruption level and property rights in the provinces. They found that improvement in provincial institutions,
especially in leaner and more predicable government policies make entrepreneurs more likely to select the higher growth-oriented path of formality. Furthermore, higher protection of property rights relatively exhibits the relationship with enterprise formalization because the entrepreneurs become more confident when there is less likelihood of land problems that might threaten the security of their investment in the foreseeable future.
In other research, McCulloch, Malesky & Duc (2013) also used the PCI to examine the relationship between provincial governance and investment in the domestic private sector. Even though, these authors did not find significant relationship between improvements in provincial governances and domestic private investment, they did find evidence that only the Transparency and Access Information index shows a significant and strong relationship with higher investment. They argue that if entrepreneurs cannot access information about business opportunities and necessary legal documents, they are unlikely to invest or expand their business.
Apart from the two studies mentioned above, which examined the impacts of the provincial governance on formalization and investment of domestic private sector, there are several studies that investigated the effects of provincial governance reforms on the Foreign Direct Investment (FDI) in Vietnam. For instance, Nguyen N & Nguyen T (2007) analyzed determinants of FDI inflows. Among the determinants, they use a variable representing government policy measured by the PCI. However, their study does not find significant correlation between provincial governance factor (the PCI) and FDI inflows. In contrast, Anh, Thai & Thang (2007), when exploring how the evolution of the effectiveness of extralegal local incentives is important in attracting FDI, found a significant positive relationship between investment environment (measured by four sub- indices of the PCI) and FDI inflows.
It can be summarized that most of the previous studies on the institutions and economic development have been conducted at a macro level and focus on cross-country data. Moreover, there are consistent evidences supporting the importance of institutional changes on economic development. However, the effects of institutional changes are likely to vary across different contexts and are influenced by many unobservable factors such as culture and level of development (McCulloch, Malesky & Duc, 2013).
Additionally, Aoki (2005) pointed out the existence of endogenous institutions (enforced) and exogenous institutions (self-forcing), which also can influence the effectiveness of institutional changes. At a micro-firm level, some studies find insignificant results of the effects of institutional changes on economic development of the business sector.
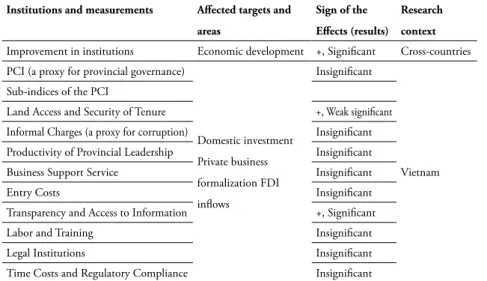
McCulloch, Malesky & Duc (2013) suggested that the insignificant result may partly be due to a huge amount of noise in the unaudited firm-level data from surveys. Table 1 summarizes the literature review of the topic under the country’s context.
3. Research Objective and Hypotheses
Based on previous literature, we find some limitations that open research gaps on the topic under the Vietnamese context. First, prior studies focus on the impacts of institutional changes on foreign and domestic investment or business formalization (McCulloch, Malesky & Duc, 2013; Nguyen N & Nguyen T, 2007; Anh, Thai & Thang, 2007 among others). The exceptions are Malesky (2008, 2010), which examined the impacts on the economic performance of the business sector but employ simple OLS regression with limited observations. Second, the above studies generally use cross- sectional PCI data for their analysis. Indeed, cross-sectional data provides only a snapshot at a given time point, which causes difficulties in analyzing variables that changes over time (Beck & Katz, 1995). Third, the prior studies use firm data collected from surveys that may contain serious problems of sample collection bias, as well as subjective and less reliable information such as unaudited financial indicators. Last but not least, we argue that each of the nine sub-indices leads to different impacts on firm-level economic performance. For instance, Land Security, Informal Charges, Active Leadership and
Table 1: Summary of the effects of institutional changes, or ‘governance reforms’
Institutions and measurements Affected targets and areas
Sign of the Effects (results)
Research context Improvement in institutions Economic development +, Significant Cross-countries PCI (a proxy for provincial governance)
Domestic investment Private business formalization FDI inflows
Insignificant
Vietnam Sub-indices of the PCI
Land Access and Security of Tenure +, Weak significant
Informal Charges (a proxy for corruption) Insignificant
Productivity of Provincial Leadership Insignificant
Business Support Service Insignificant
Entry Costs Insignificant
Transparency and Access to Information +, Significant
Labor and Training Insignificant
Legal Institutions Insignificant
Time Costs and Regulatory Compliance Insignificant
Private Support Service will directly and strongly influence economic performance and expansion of current firms. On the other hand, the sub-indices, Labor and Training and Entry Cost significantly and directly affect development and formalization of the new entrant firms. Therefore, each sub-index should be treated differently based on different firm groups.
The Figure 1 illustrates the direction of impacts of each sub-index (the proxy for the institutional change) on differently affected firm groups. We thus argue that the insignificant relationship between nearly all sub-indices and economic development (measured by FDI inflows or domestic private investment) of the previous studies resulted from three main reasons: (a) limitation of cross-sectional data, (b) unreliable and unaudited firm-level data obtained from surveys, (c) inappropriate treatment of each sub- index toward different firm groups (current firms and new entrant firms).
In this study, our research objective is to shed more lights on the effects of provincial institutional changes on business-sector performance by extending the use of the PCI and
Figure 1: Relationship model between the PCI and firm economic performance
Source: author
its sub-indices in panel form and constructing new panel firm-level performance datasets.
The new firm databases, which include audited firm-level economic performance indicators are expected to mitigate limitations recognized in the previous studies.
Additionally, we focus on the four sub-indices (Land Security, Informal Charges, Active Leadership and Private Support Service). Based on the research findings of previous studies, we hypothesize that other sub-indices may have indirect or weak relationships with the current economic performance of the business sector. We create five main research hypotheses:
H1: Improvement in the PCI leads to better economic performance of the business sector.
H2: Improvement in Land Security correlates with better business-sector economic performance.
H3: Reduction of Informal Charges correlates with better business-sector economic performance.
H4: Better Active Leadership correlates with better business-sector economic performance.
H5: Better Private Support Service correlates with better business-sector economic performance.
4. Data and variables 4.1 Sample collection
This section describes the sampling collection procedure. First, we constructed dataset #1, which includes variables presenting the institutional changes (provincial governance reforms). The PCI and its nine sub-indices are compiled. The time period for this PCI dataset is from 2006 to 2010. Second, we created dataset #2, which contains information on listed firms in Vietnam from 2006-2010. We rely on OSIRIS to obtain important year-end financial ratios such as net income after taxes, leverage, sales, assets and types of industry. We used year-end versions (31/12) of Daily Securities Exchange Bulletins issued by the two Vietnamese stock exchanges (HOSE and HNX) to collect foreign ownership and government ownership data. Other data on firms’ characteristic, such as years of listing and firm age are derived from websites of the Golden Bridge Investment Consultant Joint Stock Company (GBIC) and the BIDV Securities Company (BSC). Third, from the National Enterprise Survey 2000-2009 by the General Statistics Office (GSO) 4, we built dataset #3, which consists of data on the aggregate economic performance of surveyed firms in each province across the country. The performance data (measured by ROA and ROCE) of this dataset is the average aggregate financial ratios of associated provincial enterprises in the survey. Other provincial characteristics such as population, labor forces and number of fixed phone lines are also collected. Finally, we
4 Vietnamese General Statistic Office website: www.gso.gov.vn.
merged dataset #1 with #2, and dataset #1 with #3. The merged sample of dataset #1 and
#2 is used to examine the effects of institutional changes on economic performance of the listed firms. The merged sample of dataset #1 and #3 is used to explore the effects of the institutional changes on average economic performance of surveyed firms in the provinces. The definitions of all variables are shown in Table 2.
4.2 Measurement of economic performance of the business sector
As mentioned in Section 3, McCulloch, Malesky & Duc (2013), Malesky and Taussig (2009), Nguyen N and Nguyen T (2007) and Anh, Thai & Thang (2007) used FDI inflows, private domestic investment or the number of new registration enterprises as a proxy measurement of economic development at the micro level. In this study, we use Sale to Asset as a proxy for economic performance of the listed firms in the country. The Sale to Asset ratio is applied for the merged sample of datasets #1 and #2. Furthermore, we use ROA and ROCE as proxies for the average aggregate economic performance of the surveyed firms in each province. The ROA and ROCE ratios are used in the merged sample of datasets #1 and #3.
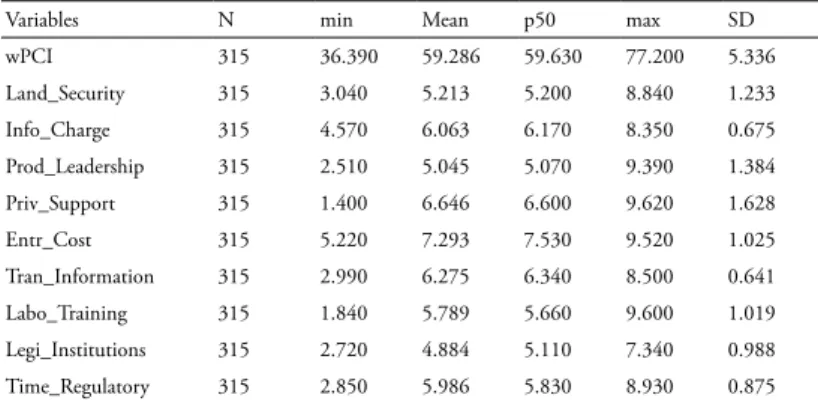
4.3 Basic statistics
This section discusses the basic statistics used for the three datasets (shown in Table 3). Dataset #1 shows descriptive statistics of the weighted PCI and its sub-indices. Due to the integration of Hatay Province into Hanoi Capital in the late 2008, there is no data on Hatay Province in 2009 and 2010. We thus exclude data on this province from our sample. As the result, Dataset #1 consists of 315 province-year observations from 2006 to 2010. Focusing on the details of each sub-index, the biggest variation in value is in the Private Support Service index (standard deviation of 1.62), followed by Active Leadership and Land Security indices, respectively. This means that there are considerable differences in provincial efforts of (a) improving quality and effectiveness of private business support, (b) initiating and implementing action plans to support local business sector, and (c) enhancing the confidence of business entrepreneurs in property rights problems. This supports our selection of the most influential sub-indices to create the research hypotheses.
Dataset #2 shows the financial performance indicator and some characteristics of the 785 listed firms. We identified the provinces of each listed firm based on where the firm applied for its certificate of business registration. There may be a concern over the unequal distribution of the listed firms in provinces across the country. We checked the
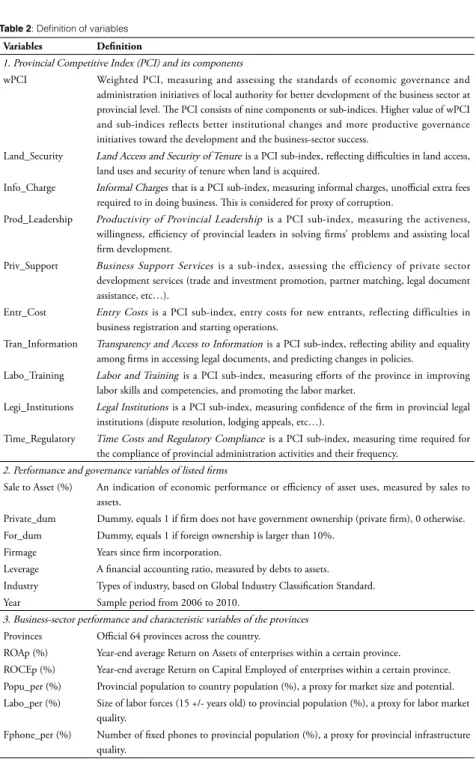
Table 2: Definition of variables
Variables Definition
1. Provincial Competitive Index (PCI) and its components
wPCI Weighted PCI, measuring and assessing the standards of economic governance and administration initiatives of local authority for better development of the business sector at provincial level. The PCI consists of nine components or sub-indices. Higher value of wPCI and sub-indices reflects better institutional changes and more productive governance initiatives toward the development and the business-sector success.
Land_Security Land Access and Security of Tenure is a PCI sub-index, reflecting difficulties in land access, land uses and security of tenure when land is acquired.
Info_Charge Informal Charges that is a PCI sub-index, measuring informal charges, unofficial extra fees required to in doing business. This is considered for proxy of corruption.
Prod_Leadership Productivity of Provincial Leadership is a PCI sub-index, measuring the activeness, willingness, efficiency of provincial leaders in solving firms’ problems and assisting local firm development.
Priv_Support Business Support Services is a sub-index, assessing the efficiency of private sector development services (trade and investment promotion, partner matching, legal document assistance, etc…).
Entr_Cost Entry Costs is a PCI sub-index, entry costs for new entrants, reflecting difficulties in business registration and starting operations.
Tran_Information Transparency and Access to Information is a PCI sub-index, reflecting ability and equality among firms in accessing legal documents, and predicting changes in policies.
Labo_Training Labor and Training is a PCI sub-index, measuring efforts of the province in improving labor skills and competencies, and promoting the labor market.
Legi_Institutions Legal Institutions is a PCI sub-index, measuring confidence of the firm in provincial legal institutions (dispute resolution, lodging appeals, etc…).
Time_Regulatory Time Costs and Regulatory Compliance is a PCI sub-index, measuring time required for the compliance of provincial administration activities and their frequency.
2. Performance and governance variables of listed firms
Sale to Asset (%) An indication of economic performance or efficiency of asset uses, measured by sales to assets.
Private_dum Dummy, equals 1 if firm does not have government ownership (private firm), 0 otherwise.
For_dum Dummy, equals 1 if foreign ownership is larger than 10%.
Firmage Years since firm incorporation.
Leverage A financial accounting ratio, measured by debts to assets.
Industry Types of industry, based on Global Industry Classification Standard.
Year Sample period from 2006 to 2010.
3. Business-sector performance and characteristic variables of the provinces Provinces Official 64 provinces across the country.
ROAp (%) Year-end average Return on Assets of enterprises within a certain province.
ROCEp (%) Year-end average Return on Capital Employed of enterprises within a certain province.
Popu_per (%) Provincial population to country population (%), a proxy for market size and potential.
Labo_per (%) Size of labor forces (15 +/- years old) to provincial population (%), a proxy for labor market quality.
Fphone_per (%) Number of fixed phones to provincial population (%), a proxy for provincial infrastructure quality.
Table 3: Basic statistics of variables Dataset #1: The PCI and its components
Variables N min Mean p50 max SD
wPCI 315 36.390 59.286 59.630 77.200 5.336
Land_Security 315 3.040 5.213 5.200 8.840 1.233
Info_Charge 315 4.570 6.063 6.170 8.350 0.675
Prod_Leadership 315 2.510 5.045 5.070 9.390 1.384
Priv_Support 315 1.400 6.646 6.600 9.620 1.628
Entr_Cost 315 5.220 7.293 7.530 9.520 1.025
Tran_Information 315 2.990 6.275 6.340 8.500 0.641
Labo_Training 315 1.840 5.789 5.660 9.600 1.019
Legi_Institutions 315 2.720 4.884 5.110 7.340 0.988
Time_Regulatory 315 2.850 5.986 5.830 8.930 0.875
Note: Detailed definitions of variables are shown in Table 2 Dataset #2: Performance and governance variables of the listed firms
Variables N min Mean p50 Max SD
Code 1,379 1 400 405 785 223
Provinces 1,379 1 36 27 64 19
Sale to Asset (%) 1379 0.680 119.582 96.360 891.569 103.179
Private_dum 1379 0.000 0.268 0.000 1.000 0.443
For_dum 1372 0.000 0.267 0.000 1.000 0.443
Firmage 1,372 0.000 19.000 16.000 56.000 13.000
Leverage (%) 1379 0.260 52.185 55.320 96.670 21.904
Asset (Billion VND) 1379 7.496 996.379 353.067 31686.890 2373.239
Industry 1,379 0.000 0.284 0.000 1.000 0.451
Year 1,379 0.000 0.361 0.000 1.000 0.481
Note: Detailed definitions of variables are shown in Table 2 Dataset #3: Business-sector performance and characteristic variables of the provinces
Variables N Min Mean p50 Max SD
ROAp (%) 189 -2.570 3.160 2.370 40.900 4.815
ROCEp (%) 189 -5.810 4.117 2.810 48.630 5.873
Provincial population (thousands) 315 290.000 1333.618 1126.200 7378.000 1058.906 Fixed phone (thousands) 315 14.200 250.445 173.600 2496.700 362.741 Labor forces (15+/- years old)
(thousands)
315 168.400 751.881 625.500 3909.100 569.599
Popu_per (%) 315 0.341 1.587 1.340 8.487 1.253
Labo_per (%) 315 45.427 56.788 57.003 65.640 3.850
Fphone_per (%) 315 3.937 16.760 15.387 59.207 7.567
Note: Detailed definitions of variables are shown in Table 2
distribution and found that the firm distribution by provinces in our sample is relatively comparable with the distribution of firm by province in study of Nguyen and Dijk (2012) 5. Dataset #3 presents basic data on the average economic performance of surveyed firms within a province. Average ROA and ROCE of firms in provinces are 3.16% and 4.11%, respectively, which is smaller than the average performance ratio of the listed firms.
5. Empirical Findings
5. 1 Institutional changes and economic performance of the listed firms In this section, we examine the relationship between the institutional changes (provincial governance reform) and the economic performance of the business sector. In this context, we use financial accounting performance measured by Sale to Asset of listed firms in the country’s market as a proxy for micro-level economic performance. The model specification (1) of a robust regression clustered at the firm level is as follows:
Performancesjt =α+β1Institutional and governance conditionjt
+β2Popu_perjt+β3Labo_perjt+β4Fphone_perjt
+β5For_dumjt+β6Log(firmage)jt+β7Leveragejt+β8Log(asset)jt
+β9Industry and Year dummies +γj+εjt (1) where the dependent variable is Sale to Asset of firm j in year t (2006 - 2010);γjis the unobservable time-invariant firm effect;εjt is the error term;αis the intercept. The most important independent variable is Institutional and governance condition which could be the weighted PCI or one of its four main sub-indices in the province where firm j locates in year t. Other independent variables represent (i) proxy measurements of some
5 There may be another concern in that the headquarters of a firm are often located in big cities because of numerous business opportunities, which may lead to location bias of the firm’s headquarters in our sample. We checked the headquarter locations of several firms (Vinamilk, Hau Giang Pharmaceutical Co., Tien Phong Plastic Co., and Vneco Corp among other) in our sample and found that the headquarters of firms are not necessarily located in big cities. Many firms maintain representative offices in big cities or developed provinces alongside the headquarters in smaller provinces where firms are offered more favorable treatments by local provinces (Ruland, 2013). Therefore, location bias is not likely a big concern in our sample. However, we still provide additional tests (in Section 5.1) dealing with this issue to check the sensitivity of the research results.
specific provincial features (market size, labor size and quality of infrastructure), (ii) characteristics of the listed firms (firm age, firm size, level of debt), and (iii) industry and time (year) effects. Detailed definitions of all variables are shown in Table 2.
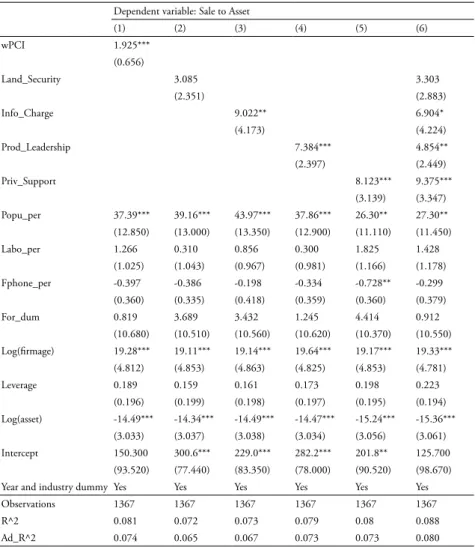
Table 4 shows the results of the OLS regression, examining the relationship between firm performance and wPCI as well as its sub-indices. Firstly, the results of Table 4 (Model 1) reveal that there is a positive and significant correlation between Sale to Asset and wPCI. In other word, higher value of wPCI associates with better firm performance measured by Sale to Asset. This result supports the first hypothesis suggesting that improvement in overall provincial governance conditions leads to higher economic performance of the business sector. When a province implements local governance reforms that causes higher market-supporting mechanisms and a better business climate, provincial business sector will benefit from the reforms. Given previous studies suggesting the positive impacts of institutional reforms on economic development at macro country level (North, 1981, 1991; Glaeser et al., 2004; Aoki, 2005; Chang, 2006 among others), the results provide more evidence on the beneficial effects of institutional changes on economic development at the provincial- firm level.
Secondly, the results of the Table 4 (Models 3, 4, 5 and 6) show positive and significant relationship between three specific provincial governance changes (Informal Charges, Active Leadership and Private Support Service) with Sale to Asset. These results support our hypotheses 3, 4 and 5 which argue that the following all associate with higher economic performance in the business sector: (a) reduction of informal or extra charges in doing business (a proxy for corruption mitigation), (b) more proactive provincial leadership in supporting the private sector, and (c) more efficient private support services. The magnitudes of the coefficients of the three governance reform indicators may suggest that among the four most important provincial governance changes, the improvement in private support services is likely to demonstrate the greatest effects on the economic performance of provincial firms, followed by the reduction of informal charges and the activeness of provincial leaders, respectively. These results provide more evidence to highlight the importance of institutional changes on economic development at the micro level, compared with the relatively insignificant findings of previous studies (McCulloch, Malesky & Duc, 2013; Nguyen N and Nguyen T, 2007 among others).
Additionally, there is a minor concern (as mentioned in footnote 5) that the firms may likely locate in big cities or more developed provinces, which could results in a sample collection bias. In the previous regression model, we controlled for differences in
the size of each province by adding a population variable as a proxy for market size. In fact, a large proportion of listed firms in our sample are located in Hanoi Capital and the South East region where the business environment seems to more attractive under view point of foreign direct investors. According to Ishizuka (2010), Vietnam has three main business hubs (Hanoi, Haiphong and Quangninh in the North; HCM, Binhduong, Dongnai and Vungtau in the South; and Hue, Danang and Quangngai in Central
Table 4: Relationship between provincial governance changes and economic performance Dependent variable: Sale to Asset
(1) (2) (3) (4) (5) (6)
wPCI 1.925***
(0.656)
Land_Security 3.085 3.303
(2.351) (2.883)
Info_Charge 9.022** 6.904*
(4.173) (4.224)
Prod_Leadership 7.384*** 4.854**
(2.397) (2.449)
Priv_Support 8.123*** 9.375***
(3.139) (3.347)
Popu_per 37.39*** 39.16*** 43.97*** 37.86*** 26.30** 27.30**
(12.850) (13.000) (13.350) (12.900) (11.110) (11.450)
Labo_per 1.266 0.310 0.856 0.300 1.825 1.428
(1.025) (1.043) (0.967) (0.981) (1.166) (1.178)
Fphone_per -0.397 -0.386 -0.198 -0.334 -0.728** -0.299
(0.360) (0.335) (0.418) (0.359) (0.360) (0.379)
For_dum 0.819 3.689 3.432 1.245 4.414 0.912
(10.680) (10.510) (10.560) (10.620) (10.370) (10.550) Log(firmage) 19.28*** 19.11*** 19.14*** 19.64*** 19.17*** 19.33***
(4.812) (4.853) (4.863) (4.825) (4.853) (4.781)
Leverage 0.189 0.159 0.161 0.173 0.198 0.223
(0.196) (0.199) (0.198) (0.197) (0.195) (0.194)
Log(asset) -14.49*** -14.34*** -14.49*** -14.47*** -15.24*** -15.36***
(3.033) (3.037) (3.038) (3.034) (3.056) (3.061)
Intercept 150.300 300.6*** 229.0*** 282.2*** 201.8** 125.700
(93.520) (77.440) (83.350) (78.000) (90.520) (98.670)
Year and industry dummy Yes Yes Yes Yes Yes Yes
Observations 1367 1367 1367 1367 1367 1367
R^2 0.081 0.072 0.073 0.079 0.08 0.088
Ad_R^2 0.074 0.065 0.067 0.073 0.073 0.080
Detail definition of variables is shown in Table 2. Robust standard errors are reported in parentheses.
Significance at 1%, 5%, and 10% level is noted by ***, ** and *, respectively.
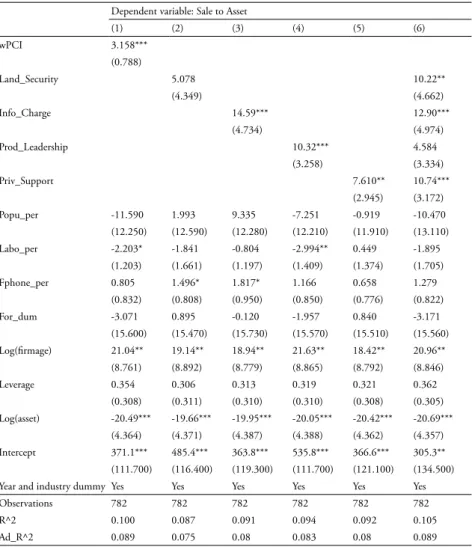
Vietnam). We duplicate the above regression but exclude the firms located in the three main business hubs. The results of Table 5 are consistent with those of Table 4 and indicate that an improvement in provincial governance changes correlates positively with higher performance of the provincial business sector. In particular, another result of Table 5 (Mode 6) suggests a positive relationship between the secured property rights-of-uses and the economic performance of provincial firms.
Table 5: Provincial governance changes and economic performance (excluding firms in big cities) Dependent variable: Sale to Asset
(1) (2) (3) (4) (5) (6)
wPCI 3.158***
(0.788)
Land_Security 5.078 10.22**
(4.349) (4.662)
Info_Charge 14.59*** 12.90***
(4.734) (4.974)
Prod_Leadership 10.32*** 4.584
(3.258) (3.334)
Priv_Support 7.610** 10.74***
(2.945) (3.172)
Popu_per -11.590 1.993 9.335 -7.251 -0.919 -10.470
(12.250) (12.590) (12.280) (12.210) (11.910) (13.110)
Labo_per -2.203* -1.841 -0.804 -2.994** 0.449 -1.895
(1.203) (1.661) (1.197) (1.409) (1.374) (1.705)
Fphone_per 0.805 1.496* 1.817* 1.166 0.658 1.279
(0.832) (0.808) (0.950) (0.850) (0.776) (0.822)
For_dum -3.071 0.895 -0.120 -1.957 0.840 -3.171
(15.600) (15.470) (15.730) (15.570) (15.510) (15.560)
Log(firmage) 21.04** 19.14** 18.94** 21.63** 18.42** 20.96**
(8.761) (8.892) (8.779) (8.865) (8.792) (8.846)
Leverage 0.354 0.306 0.313 0.319 0.321 0.362
(0.308) (0.311) (0.310) (0.310) (0.308) (0.305)
Log(asset) -20.49*** -19.66*** -19.95*** -20.05*** -20.42*** -20.69***
(4.364) (4.371) (4.387) (4.388) (4.362) (4.357)
Intercept 371.1*** 485.4*** 363.8*** 535.8*** 366.6*** 305.3**
(111.700) (116.400) (119.300) (111.700) (121.100) (134.500)
Year and industry dummy Yes Yes Yes Yes Yes Yes
Observations 782 782 782 782 782 782
R^2 0.100 0.087 0.091 0.094 0.092 0.105
Ad_R^2 0.089 0.075 0.08 0.083 0.08 0.089
Detailed definition of variables is shown in Table 2. Robust standard errors are reported in parentheses.
Significance at 1%, 5%, and 10% level is noted by ***, ** and *, respectively.
5. 2 Institutional changes and average aggregate provincial firm economic performance This section explores the impacts of institutional changes (or provincial governance reform) on the business-sector performance by using the average aggregate financial performance of provincial firms. The average aggregate financial performance which is collected from the national enterprises survey is measured by ROA (Return on Asset) or ROCE (Return on Capital Employed). The use of a different performance dataset is expected to provide supplemental evidence to the results obtained from the use of economic performance of the listed firms. In addition, the new measurements of economic performance ROA and ROCE instead of Sale to Asset may make it necessary to check the robustness of our research results. Based on the previous results of model specification (1), which show significant impacts of Informal Charges, Active Leadership and Private Support Service Indexes, in model specification (2), we also expect to see the relationship between the wPCI, the four sub-indices and the average aggregate financial performance of provincial firms.
Model specification (2) of OLS regression is as follows:
Performancesjt =α+β1Institutional and governance conditionjt +β2Popu_perjt+β3Labo_perjt+β4Fphone_perjt
+β5Year dummies +δj+εjt (2)
where the dependent variables are average aggregate financial performance, named ROApjt or ROCEjtof province j in year t (2006 - 2008);δj is the unobservable time- invariant province effect;εjtis the error term;αis the intercept. Like model specification (1), the most important independent variable is Institutional and governance condition which could be the weighted PCI or one of its four sub-indices of province j in year t. Other independent variables represent proxy measurements for some specific provincial features (market size, labor size and quality of infrastructure) and time (year) effects.
Detailed definitions of all variables are shown in Table 2.
Panel A of Table 6 shows the results of the OLS regression testing the effects of the institutional changes on economic performance measured by the average aggregate ROA of surveyed firms within a province. Models (1), (2), (4), and (5) show a positive and significant association between wPCI, three of its sub-indices (Land Security, Active Leadership and Private Support Service) and the average aggregate ROA. The results are consistent with those obtained from the previous regression of model specification (1).
The results support our research hypotheses 1, 2, 4, and 5 which suggest that better provincial governance changes lead to higher economic performance of the business
sector in the local area. In which, the provincial efforts in improving property rights-of- uses, generating more active business supporting policies and enhancing private business support services are among the important provincial changes for better performance of the local business sector. However, the Informal Charges index does not exhibit any significant relationship with the average aggregate ROA, which is not in line with the results of previous regressions.
Results in Panel B of Table 6 show that there are significant positive associations between wPCI including all the four sub-indices (Land Security, Active Leadership, Informal Charges and Private Support Service) and ROCE. The results are consistent with those of previous regressions. A positive relationship between improvements (in the overall institutional reforms and the other four sub- components, especially those as proxies for corruption and property rights-of-uses) and economic performance at the micro level provides additional evidences supporting the findings of previous studies (North, 1981, 1991; Glaeser et al., 2004; Aoki, 2005; Chang, 2006 among others), and supplementing those of previous studies using the Vietnam PCI (McCulloch et al., 2013;
Nguyen N and Nguyen T, 2007; Anh et al., 2007 among others).
6. Additional tests
In this section, we use several additional tests to check the robustness of the research findings. We expect to obtain consistent results compared with those of previous regressions that support our research hypotheses, even though the results of the additional tests may not always be significant for wPCI and all of its four sub-indices under different estimation methods.
Firstly, there may be a concern over the time lagging effects of the provincial institutional changes on economic development at the micro level because it may require a certain period of time before governance reforms and changes become effective.
McCulloch et al. (2013) thus used the lag value of the PCI to examine the impacts of provincial governance reforms on private domestic investment. We also employed one- year lag value of wPCI and its sub-indices for our study. We duplicated the regression using model specification (1). Table 7 shows results consistent with those of previous regressions, which indicates a significant positive relationship between the improvement in institutional changes and firm economic performance, especially in the cases of wPCI and the two sub-indices (private support services and pro-activeness of provincial leadership).
Secondly, we tested the relationship between the changes in the values of wPCI, its
sub-indices and the changes in the business-sector performance measured by Sale to Asset (of the listed firms) 6. We also employed robust regression clustered at firm level to examine the relationship. Results of the unreported tests show consistent findings that there is a significantly positive correlation between changes in values of the Land Security as well as Prod Leadership sub-indices and economic performance of the business sector.
It means that better land access and security of tenure and pro-activeness of provincial leadership are among the important provincial governance reforms that bring benefits to the local business sector. There are no significant results found for other sub-indices.
6 Model specification testing relationship between the changes in wPCI (& its sub- indices) and changes in business-sector development is presented as follows: (Detailed definitions of variables are shown in Table 2).
ΔPerformancesjt =α+β1ΔInstitutional and governance conditionjt
+β2Popu_perjt+β3Labo_perjt+β4Fphone_perjt
+β5For_dumjt+β6Log(firmage)jt+β7Leveragejt
+β8Log(asset)jt+β9Industry and Year dummies +γj+εjt.
Table 6: Provincial governance initiatives and the performance of the provincial business sector Panel A: provincial governance initiatives and ROAp
Panel A Dependent variable: ROAp
(1) (2) (3) (4) (5) (6)
wPCI 0.0866*
(0.045)
Land_Security 0.550** 0.099
(0.272) (0.439)
Info_Charge 0.653 0.107
(0.557) (0.622)
Prod_Leadership 0.549*** 0.363
(0.201) (0.234)
Priv_Support 0.537* 0.245
(0.276) (0.317)
Popu_per -0.424 -0.330 -0.292 -0.427 -0.501 -0.466
(0.331) (0.291) (0.281) (0.319) (0.361) (0.358)
Labo_per -0.172 -0.183 -0.186 -0.179 -0.170 -0.182
(0.120) (0.120) (0.122) (0.121) (0.119) (0.116)
Fphone_per 0.077 0.110* 0.092 0.095 0.064 0.084
(0.058) (0.064) (0.062) (0.065) (0.053) (0.051)
Intercept 7.536 8.886 8.315 9.488 9.436 8.225
(6.399) (7.336) (7.755) (6.584) (6.613) (7.968)
Thirdly, there may be other concerns on the endogeneity issue when examining the relationship between provincial governance changes and provincial business-sector outcome. The wPCI and its four sub-indices may be endogenously decided by unobservable factors in our model. For instance, the provincial efforts in improving the institutional governance aim not only at developing current business sector, but also at attracting more FDI inflows. In addition, there may be a change in the leadership position of a certain province, affecting to the improvement/reduction of the PCI and its
Year dummy Yes Yes Yes Yes Yes Yes
Observations 189 189 189 189 189 189
R^2 0.069 0.056 0.056 0.075 0.07 0.078
Ad_R^2 0.038 0.025 0.025 0.044 0.039 0.031
Robust standard errors are reported in parentheses. 1%, 5%, and 10% is ***, ** and *, respectively.
Panel B: provincial governance initiatives and ROCEp
Panel B Dependent variable: ROCEp
(1) (2) (3) (4) (5) (6)
wPCI 0.130**
(0.060)
Land_Security 1.410*** 0.778
(0.371) (0.573)
Info_Charge 1.402* 0.464
(0.736) (0.781)
Prod_Leadership 0.865*** 0.537*
(0.293) (0.309)
Priv_Support 0.750** 0.168
(0.355) (0.368)
Popu_per -0.561 -0.420 -0.339 -0.572 -0.659 -0.542
(0.380) (0.338) (0.327) (0.366) (0.414) (0.406)
Labo_per -0.210 -0.243 -0.243* -0.221 -0.206 -0.250*
(0.146) (0.147) (0.145) (0.145) (0.146) (0.140)
Fphone_per 0.051 0.118 0.072 0.078 0.034 0.092
(0.069) (0.077) (0.074) (0.078) (0.064) (0.062)
Intercept 8.963 8.214 8.078 11.760 12.060 6.312
(8.719) (9.016) (10.370) (8.399) (8.555) (10.290)
Year dummy Yes Yes Yes Yes Yes Yes
Observations 189 189 189 189 189 189
R^2 0.064 0.062 0.054 0.076 0.061 0.087
Ad_R^2 0.033 0.031 0.023 0.046 0.03 0.042
Robust standard errors are reported in parentheses. 1%, 5% and 10% is ***, ** and *, respectively.
sub-indices. The new provincial leader turnover can be an important determinant explaining business condition of the province. In fact, endogeneity is often a serious potential problem in empirical studies. We further control for the issue by using Instrument Variables (IVs) regression. However, the independent (exogenous) variables in our database provide only a very limited selection of potential instruments. We also recognize an issue that weak instruments may lead to the bias and inconsistent estimation
Table 7: One-year lag value of provincial governance changes and economic performance Dependent variable: Sale to Asset
(1) (2) (3) (4) (5) (6)
wPCI (t-1) 2.085***
(0.676)
Land_Security (t-1) 1.258 1.712
(2.419) (3.070)
Info_Charge (t-1) -2.089 -3.111
(3.512) (4.014)
Prod_Leadership (t-1) 6.186*** 7.670***
(2.364) (2.595)
Priv_Support (t-1) 5.178** 6.807**
(2.060) (2.798)
Popu_per 41.04*** 39.39*** 38.92*** 39.01*** 37.76*** 37.32***
(13.260) (13.140) (12.920) (12.940) (12.580) (12.500)
Labo_per 1.426 0.631 0.748 0.608 1.260 1.285
(1.047) (0.953) (0.975) (0.953) (1.016) (1.018)
Fphone_per -0.290 -0.474 -0.513 -0.461 -0.520 -0.460
(0.381) (0.373) (0.363) (0.362) (0.366) (0.367)
For_dum 1.072 4.000 4.771 1.242 5.037 1.450
(10.720) (10.560) (10.470) (10.690) (10.370) (10.620) Log(firmage) 19.60*** 19.13*** 19.15*** 19.35*** 19.72*** 19.93***
(4.835) (4.882) (4.884) (4.842) (4.894) (4.876)
Leverage 0.186 0.157 0.157 0.178 0.183 0.221
(0.196) (0.199) (0.199) (0.199) (0.194) (0.194)
Log(asset) -14.55*** -14.41*** -14.49*** -14.44*** -14.90*** -15.15***
(3.044) (3.043) (3.048) (3.045) (3.028) (3.040)
Intercept 129.400 295.0*** 310.1*** 271.1*** 241.2*** 202.4**
(102.200) (78.780) (79.880) (79.560) (81.940) (95.260)
Industry and year dummy Yes Yes Yes Yes Yes Yes
Observations 1366 1366 1366 1366 1366 1366
R^2 0.083 0.072 0.072 0.078 0.077 0.088
Ad_R^2 0.076 0.065 0.065 0.071 0.071 0.08
Detailed definitions of variables are shown in Table 2. Robust standard errors are reported in parentheses.
Significance at 1%, 5%, and 10% level is noted by ***, ** and *, respectively.
of the PCI-performance relationship.
Since Mai (2002) and Nguyen N and Nguyen T (2007) suggest that market size and quality of provincial infrastructure are two determinant factors attracting FDI, we thus decided to select provincial population (a proxy for market size) and number of fixed phone to provincial population (a proxy for provincial infrastructure quality) as the two
Table 8: IV regression (the second stage) examining the relationship between provincial governance changes and economic performance
Dependent variable: Sale to Asset
(1) (2) (3) (4) (5)
wPCI 16.65***
(6.295)
Land_Security 8.124
(8.179)
Info_Charge -7.922
(7.950)
Prod_Leadership 29.11**
(13.340)
Priv_Support 14.69***
(5.205)
Labo_per 3.555* -2.094 0.057 -3.006** 3.493**
(2.050) (1.709) (0.820) (1.403) (1.433)
For_dum -26.15* 3.680 6.716 -7.291 5.649
(15.650) (7.618) (7.212) (9.985) (7.025)
Log(firmage) 20.79*** 19.26*** 18.72*** 21.63*** 18.18***
(4.048) (2.981) (3.040) (3.423) (3.030)
Leverage 0.435** 0.129 0.108 0.202 0.199
(0.193) (0.125) (0.124) (0.135) (0.127)
Log(asset) -14.72*** -13.71*** -13.88*** -14.22*** -15.64***
(2.605) (1.917) (1.903) (2.022) (1.999)
Intercept -862.2* 396.7*** 369.9*** 354.9*** 60.990
(477.800) (62.820) (53.430) (54.310) (106.200)
Year and industry dummy Yes Yes Yes Yes Yes
Observations 1367 1367 1367 1367 1367
R^2 0.094 0.058 0.055 0.001 0.068
Ad_R^2 0.088 0.053 0.049 -0.005 0.062
Test of endogeneity
Robust score chi2(1) 8.048*** 0.555 3.794* 2.560* 1.485
Robust regression F(1, 1357) 8.298*** 0.550 3.684* 2.616* 1.492
Detailed definition of variables is shown in Table 2. Robust standard errors are reported in parentheses.
Significance at 1%, 5%, and 10% level is noted by ***, ** and *, respectively.