along global value chains
権利 Copyright World Bank
journal or
publication title
Global value chain development report 2017 : measuring and analyzing the impact of GVCs on economic development
page range 119‑139
year 2017
章番号 Chapter 5
URL http://hdl.handle.net/2344/00049249
119
CHAPTER
The middle-income trap and upgrading along global value chains
JAKOB ENGEL AND DARIA TAGLIONI
A
fter acting as the primary drivers of global growth in the years immediately following the 2007–08 global financial crisis, emerging and developing economies experienced a substantial decline. Having exceeded 4% a year from 2010 to 2014, their growth declined to 3.4% in 2015 and to an expected 3.5% in 2016, with commodity produc- ers projected to grow only 0.4% in 2016 (figure 5.1; World Bank 2016a). The end of the commodity boom and concerns about financial stability in many emerging economies led Haldane (2015, p. 13) to argue that after the Anglo-Saxon crisis of 2008/09 and the euro-area crisis of 2011/12, “we may now be entering the early stages of Part Three of the [crisis] trilogy, the ‘Emerging Market’ crisis of 2015 onwards.” Many emerging economies face high corporate debt and excess capacity, leaving them vulner- able to unexpected domestic or global events (IMF 2016). And many of the world’s largest middle-income countries — including Argentina, Brazil, China, Indonesia, Nigeria, and the Russian Federation — have seen substantial slowdowns.1 In this economic climate, gaining better understanding of different growth trajec- tories and the obstacles middle-income countries face in sustain- ing rapid growth becomes all the more relevant.This chapter examines in greater depth the middle-income trap — in which high sustained growth becomes increasingly dif- ficult once a country reaches GDP per capita of around $10,000.
The term, coined by Gill and Kharas (2007) in relation to growth prospects in Asia, remains ambiguous and is interpreted in var- ious ways, producing different empirical findings and policy recommendations. Indeed, a trap specific to middle-income countries is disputed (see Pritchett and Summers 2014; Im and Rosenblatt 2013; Roy and others 2016), and the data tend to
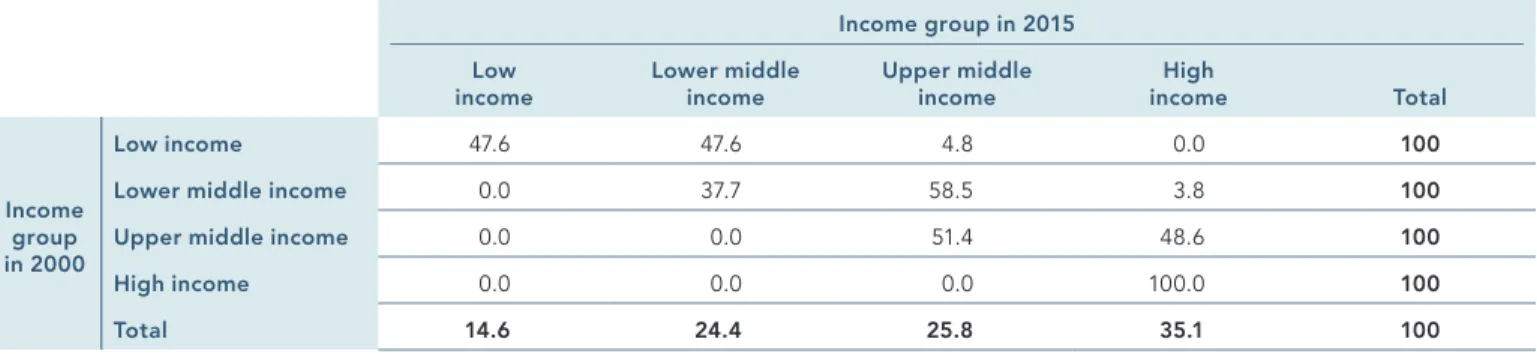
show substantial upward mobility between 2000 and 2015, par- ticularly for middle-income countries, with 79 of 133 countries that were low or middle income in 2000 improving their income status and none declining (table 5.1).
After addressing some of the definitional issues, the chapter reviews recent cross-country and case-study literature on the middle-income trap — its causes and its possible solutions.
It then links the middle-income trap to the emergence and growing significance of trade through global value chains (GVCs).
The role of GVCs in trade and investment flows dominates aca- demic and policy debates on trade and industrial development (see Gereffi 2014; Taglioni and Winkler 2016). One characteristic of GVC trade is the denationalizing of comparative advantage, which could allow countries to industrialize by joining GVCs rather than by building their own (Baldwin and Lopez-Gonzalez 2015). So integration into GVCs has been widely viewed as a stra- tegic pillar for developing countries to become more competi- tive, to develop the skills and human capital of their labor force, and to acquire technology to industrialize and move into higher value-added production. Whether such economic upgrading is happening — and if so, where and how — remains subject to much debate and speculation.
This chapter surveys these two debates — on the middle- income trap phenomenon and on countries’ ability to grow and develop through GVC participation — and asks whether integra- tion into GVCs can help countries avoid a middle-income trap and, if so, why and under what circumstances. The primary focus is examining how the factors that are hypothesized to contrib- ute to growth slowdowns at middle income may also impede economic upgrading through GVCs. The literature is limited on
5
the relationship between the two debates, but empirical analy- ses have found some evidence that GVC participation supports escape from the dynamics hypothesized in the middle-income trap literature, albeit with substantial variation (Kummritz and others 2016; Boffa and others 2016). However, this chapter does not assign causality; it instead asserts that while GVC integra- tion can support sustained high growth rates for middle-income countries, a certain level of development and industrial com- plexity also tends to be a prerequisite for participation in more sophisticated, higher value-added GVCs.
The chapter makes four central claims:
• The two debates have existed mostly independent of each other, but they should be bridged. The factors that constrain GVC participation and upgrading provide a more granular perspective of tasks, products, and industries — and a more
coherent and applicable set of policy recommendations to address the causes of growth slowdowns and structural stagnation.
• The need for developing countries to adapt to trade through globally integrated value chains in goods, services, and information presents a partial but important conceptual par- adigm and policy framework to identify levers for middle- income countries to converge with richer countries. The eco- nomic complexity and institutional sophistication required to upgrade into higher value-added tasks and products over time — in the context of the emergence of globally integrated lead firms — are lacking in many middle-income countries.
• The institutional, macroeconomic, trade, and industrial policies required for successful GVC participation can also address eco- nomic stagnation among trapped middle-income countries.
FIGURE 5.1 GDP per capita growth, by income group, 2006–15
–5 0 5 10
2015 2014
2013 2012
2011 2010
2009 2008
2007 2006
High income Low income Lower middle income
Upper middle income
Source: World Development Indicators database.
TABLE 5.1 Share of all countries in a given income group in 2000 and 2015 Percent
Income group in 2015 Low
income Lower middle
income Upper middle
income High
income Total
Income group in 2000
Low income 47.6 47.6 4.8 0.0 100
Lower middle income 0.0 37.7 58.5 3.8 100
Upper middle income 0.0 0.0 51.4 48.6 100
High income 0.0 0.0 0.0 100.0 100
Total 14 6 24 4 25 8 35 1 100
Source: World Bank County and Lending Group Classification (see https://datahelpdesk.worldbank.org/knowledgebase/articles/906519-world-bank-country -and-lending-groups).
• Emerging technological changes are likely to further complicate the ability to develop by integrating into and upgrading within GVCs unless countries explicitly address the links between pro- duction and distribution and between economic and social change. This informs a broad set of policy recommendations that — while requiring more nuanced targeting and adapta- tion specific to each country and sector — provide a promising framework for overcoming difficulties specific to middle-income countries in the age of automation and digitization.
The chapter first goes into greater depth on the debates sur- rounding the middle-income trap and clarifies the main terms. It then provides a framework for viewing transitions from low- to middle-income status and from middle- to high-income status through a GVC lens — and the GVC-related factors that medi- ate these transitions. It then examines emerging technological and economic factors and trends that are likely to make efforts to escape the middle-income trap through participation in GVCs more complex in the medium term and offers some potential policy solutions.
Definitions and implications of the middle- income trap
The term “middle-income trap” was coined almost a decade ago by Gill and Kharas (2007), who discussed three transformations that modern growth theory predicted middle-income countries in East Asia would experience. First was the slowing and rever- sal of diversification as countries became more specialized in production and employment. Second was the declining impor- tance of investment and the acceleration of innovation. And third was the shift in education systems to equip workers with the skills not just to adjust to new technologies, but also to shape new products and processes. They noted that many Southeast Asian countries stagnated and failed to make the transition to productivity-driven growth. While the term middle-income trap was novel, the concept was not — drawing on earlier work on low- level equilibrium traps (Nelson 1956), poverty traps (Leibenstein 1962; Aazariadis and Drazen 1990; Kraay and Raddatz 2007), and globalization’s missing middle (Garrett 2004).
What is the middle-income trap, does it exist, and how can it be measured?
A large and growing body of literature focuses on whether the term is useful for examining the problems facing industrializing countries. As Gill and Kharas (2015) noted, after 10 years and more than 300 articles the term remains poorly defined and backed by almost no formal modeling, with very few exceptions (Agénor and Canuto 2015; Dabús and others 2016). However, two dominant definitions of the middle-income trap have emerged.
At its most basic, the trap is seen as sustained economic stagna- tion. Egawa (2013, p. 2) argues that it is “a situation in which an MIC [middle-income country] falls into economic stagnation and becomes unable to advance its economy to a high-income level for certain reasons specific to MICs” related to “a delay or failure
to change the economic structure from an input-driven growth model into a productivity-driven growth model.”
Three approaches to assessing when a country is stuck in a middle-income trap have emerged: one on absolute conver- gence to high-income countries, one on relative convergence, and one on structural change, going beyond income-related measures of development. The approaches are not mutually exclusive, and even studies focused on assessing convergence dynamics — and in many cases not finding any unique middle- income country trap — generally acknowledge that specific structural changes are required for middle-income countries to increase their income.
Absolute convergence. Drawing on Hausmann and others’ (2005) definition of growth slowdowns, Eichengreen and others (2013) stipulated three conditions for a growth slowdown to be clas- sified as a middle-income trap: a seven-year average growth rate of GDP per capita of at least 3.5% prior to the slowdown, a decline in the seven-year average growth rate of GDP per capita of at least 2 percentage points, and GDP per capita greater than
$10,000 in 2005 international purchasing power parity prices.
They find a bimodal middle-income trap at GDP per capita of
$10,000–$11,000 and $15,000–$16,000, suggesting that growth in middle-income countries slows in two main stages.
Relative convergence. Felipe and others (2012) focused on how long it took countries to cross income thresholds and defined a lower-middle-income trap as a country failing to attain average growth of income per capita of at least 4.7% a year and an upper- middle income trap as a country failing to attain average growth of income per capita of at least 3.5% a year. The relative approach is exemplified by Aiyar and others (2013), who regressed growth in GDP per capita on lagged income and measures of physical and human capital to come up with a predicted growth rate. The residuals of this regression are defined as actual growth minus estimated growth, and a slowdown takes place when a substan- tial deviation in actual versus expected growth is sustained over 10 years. Robertson and Ye (2013) likewise used the growth rate of income relative to the United States as their dependent vari- able. Similarly, Huang (2016) defined this process of stagnation as an economy’s ability to continue to grow more rapidly than the United States after reaching middle-income status. Furthermore, not even the World Bank and International Monetary Fund defi- nition of a middle-income country is considered a helpful bench- mark by all researchers: Aiyar and others (2013) and Roy and others (2016) assigned a country middle-income status if its GDP range was 15–50% of U.S. income, depending on the specification.
Structural change. A third approach, while not contradicting the relative and absolute convergence approaches, focuses less on quantitative measures of growth slowdowns and more on the structure of the country’s economy and on processes of trans- formation. Dingemans (2016, p. 644) defined Chile’s middle- income trap as the country’s “inability to (incrementally) diversify and enhance its export trade.” Ohno (2009, p. 1) argued that the
defining characteristic of the middle-income trap is a country’s failure “to build a national mindset and institutions that encour- age constant upgrading of its human capital.” Ohno divided the catching-up industrialization process into four stages and iden- tified a middle-income trap as a glass ceiling in manufacturing between stages two and three (figure 5.2). In stages one through three foreign direct investment is critical to promote and sus- tain growth. Ohno found that Viet Nam’s growth in the past two decades was driven largely by liberalization and large inflows of external purchasing power. Rigg and others (2014) took a more sociological approach in their analysis of Thailand and argued that a middle-income trap can be assessed by how individuals and households negotiate — or do not — the skills/employment transition.
Useful? While most researchers find at least some value in the concept, Pritchett and Summers (2014) demonstrated empiri- cally that there has been little continuity in growth performance historically and found that growth declines are more likely to be sudden and large than gradual and small. Thus, what others may perceive as the middle-income trap is more likely to be a regres- sion to the mean. Im and Rosenblatt (2013, p. 25) rejected the middle-income trap concept arguing that “MICs [middle-income countries] do not really look that different in terms of transitions across the inter-country distribution of income” and display
growth trajectories that “do not conform to one clear pattern that can be easily characterized as a ‘trap.’”
More recently, Roy and others (2016) found little value in the middle-income trap as an empirical phenomenon. Using var- ious measures of convergence based on catching up with rich countries either as a group or with the United States and based on both the country and individuals as the unit of measurement (accounting for and assuming away distributional changes within countries), they found that while economic divergence was a dominating global phenomenon before the 1980s, there is strong evidence for economic convergence globally since. They then tested whether middle-income countries were negative outliers within an unconditional convergence framework that included all countries and only middle- and high-income countries2 — and found no evidence for either form of middle-income trap.
What are the main identified causes of middle-income traps, and which countries are affected?
The substantial definitional issues and differing empirical results complicate the notion of a clearly demarcated middle-income trap. Can something unique about industrialization processes for present-day middle-income countries be generalized? Here there is greater convergence, even among the skeptics. The lit- erature assessing the causes of the trap differentiate between structural causes and policy-related and institutional causes.
FIGURE 5.2 Ohno’s stages of catch-up industrialization
Stage four Full capability
in innovation and product design as global leader
Japan, United States, European Union Arrival of
manufacturing foreign direct
investment
Agglomeration
Technology absorption
Creativity
Glass ceiling for ASEAN countries (middle-income trap)
Stage three Management and technology
mastered, can produce high- quality goods
Republic of Korea, Chinese Taipei Stage two
Have supporting industries, but
still under foreign guidance Thailand, Malaysia Stage one
Simple manufacturing under foreign
guidance Viet Nam Stage zero
Monoculture, subsistence agriculture, aid dependency
Source: Ohno 2009.
Moreover, some researchers distinguish between factors that cause the trap and those that perpetuate it (see, for example, Toh 2013). However, there is a general consensus that the trap reflects a country’s inability to shift its growth strategy and eco- nomic structure toward sustained high growth rates.
In reviewing the previous decade of debate, Gill and Kharas (2015) argued that the middle-income trap occurs when rapidly growing countries with rising wages have tried to sustain an economy based on labor-intensive manufacturing and export-led growth. But as their competitive advantages decline, they have been unable to find alternative sources of demand to replace exports. This has been exacerbated by the declining elasticity of trade to growth in recent years — as well as by rising global com- petition, increasing currency and balance-sheet risk due to the heightened international financial flows, and for some countries, a lack of the requisite infrastructure while prematurely attempt- ing to become knowledge economies.
Differentiating between structural change and convergence (whether relative or absolute) has implications from a policy per- spective. As Paus (2014) noted, even within an income conver- gence framework there can still be no capability convergence.
Jankowska and others (2012) explicitly framed this as an issue of structural transformation, with Latin America unable to com- pensate for the decreasing labor share in agriculture through its manufacturing sector, but with the Asian newly industrializing countries developing modern sectors in which productivity is both higher than in the traditional sector and sufficiently labor- intensive to transmit the gains to a sizable share of the labor force.
Glawe and Wagner (2016) pointed to two primary theoret- ical arguments to explain the trap. The first draws on Arthur Lewis’s dual-sector model of the economy and sees the trap as reflecting a country’s inability to continue boosting productivity by shifting workers from agriculture to industry. The latter argu- ment, derived mostly from more recent developments in growth theory, focuses on a country’s ability (or lack thereof) to imitate foreign technologies and develop comparative advantages in new export products. Agénor and Canuto (2015), in broad strokes, attempted to model and extend this line of thinking, arguing that knowledge network effects to developing advanced skills and infrastructure allow countries to evade a lower-growth equilibrium that they see as equivalent to the middle-income trap.
Several studies using absolute and relative convergence defi- nitions have determined the impact of variables that either are correlated with or causally contribute to the trap:
• Eichengreen and others (2013) used a sample of present-day developed countries and found that correlates and determi- nants of growth slowdowns were more likely in economies with high old-age dependency ratios, high investment rates, and undervalued real exchange rates.
• Aiyar and others (2013) examined 42 variables in seven cate- gories using a weighted average least-squares approach and found the following to be significant determinants of falling into the trap: rule of law, size of government, the regulatory
environment, dependency and sex ratios, the share of gross capital inflows, investment public debt in GDP, output diver- sification, agriculture and service shares, a country’s GDP- weighted distance, its degree of output diversification, whether it is involved in a war or civil conflict, and whether it has a tropical climate.
• Bulman and others (2014) used pooled regressions on middle- income countries and found that escapees from the trap had higher growth at all relative incomes, higher total factor pro- ductivity growth, faster transformations toward industry, better macroeconomic management, and consistently more export orientation. Furthermore, countries with high second- ary and tertiary education and with a larger share of high-tech products in exports are less likely to fall into the trap.
The results, while methodologically distinctive and using dif- fering control variables, provide some consistency in their focus on demography, equity, the macroeconomic framework, and — most prominently — the export structure. In other words there is some consensus that factors seen as important for long-run eco- nomic development are important for middle-income countries to sustain GDP growth. This is a useful contribution, but as Paus (2014, p. 25) noted, “it is not clear what these findings mean for policymaking.”
Trade and export diversification is central to numerous recent analyses. Felipe and others (2012) compared the export struc- ture of countries in the trap across variables related to their abil- ity to structurally transform and found that escapees had more sophisticated and diversified export baskets than did nonescap- ees. This is also supported by country case studies. Dingemans (2016) found that the lack of diversification in Chile was caused in large part by the country’s inability to promote innovation and develop more complex export products. Paus (2014) likewise saw the main challenge for Latin America as addressing the disjunc- ture between global competitive pressures and the slow process for firms to learn and countries to implement capability-enhanc- ing policies. Rigg and others (2014) identified the primary failure of inadequate structural transformation at three distinct levels in Thailand: government’s inability to develop the population’s human capital, firms’ failure to develop human capital or exploit what already exists, and individuals’ unwillingness to develop human capital and embrace opportunities away from their home villages. The trap is “as much personal as it is structural and insti- tutional” (p. 196).
Several researches have focused on social and demographic factors. Egawa (2013) saw the worsening income distribution as a primary engine of stagnation, while Ozturk (2016) empha- sized the presence and size of the middle class. Panther and Flechtner (2015) took the relevance of inequality a step further by examining domestic and international inequality as political economy drivers of the trap, using a large sample of compar- ative qualitative case analyses. For national inequality multiple intersecting inequalities (income, ownership of assets, access to power) result in low institutional quality, which in turn pre- vents the adoption of policies that may be opposed by vested interests and would allow the country to transition to a more
productive economy. For international inequality the ability of countries to benefit from globalization and the proliferation of multinational corporations and GVCs are influenced by distribu- tions of power and income at the global level. Ito (2016) made this focus on institutions as the mediating factor for countries either escaping or stuck in the trap more explicit by arguing that countries sort themselves into three equilibria (low income, middle-income trap, and middle-income convergence toward high income), depending on their willingness to carry out fun- damental economic and structural reforms. Much recent work deals either explicitly (Woo 2012; Huang 2016) or implicitly with China (World Bank 2013; Pritchett and Summers 2014). In most of these China-focused analyses governance and institutions are particularly relevant.
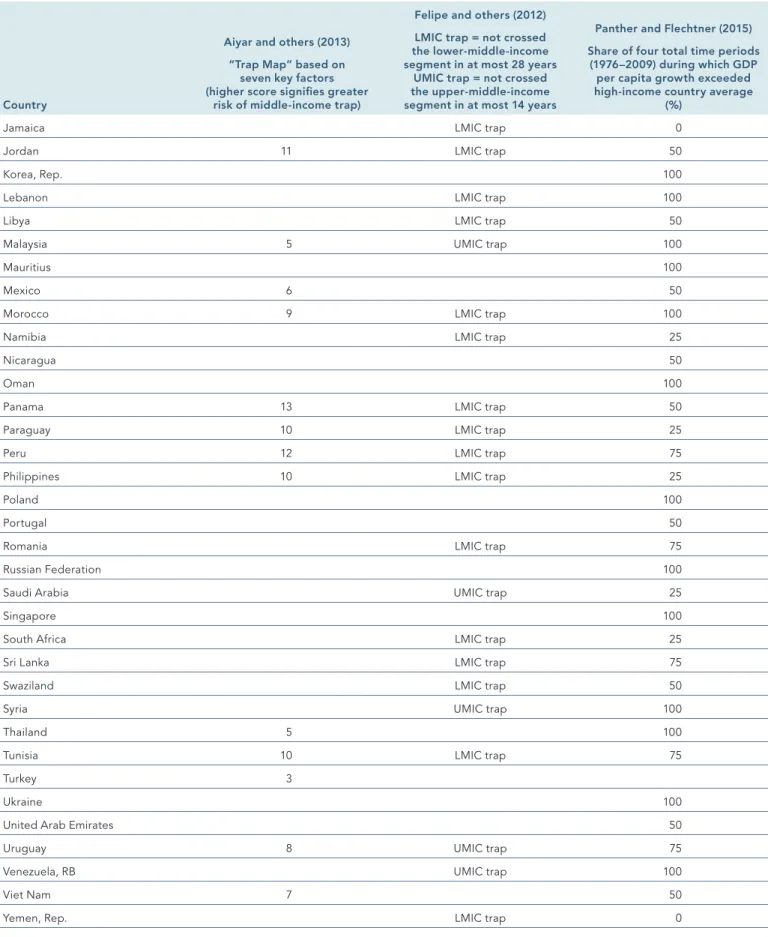
Both the definitions and the causes inform the classifica- tion of countries in the middle-income trap. Some researchers focus on individual countries — Egawa (2013) on Malaysia, China, and Thailand, Dingemans (2016) on Chile, and Ohno (2009) on Malaysia and Thailand. Other researchers take a multicountry approach and come to different conclusions. For example, Felipe and others (2012) considered 35 of 52 countries to be stuck in the trap. Aiyar and others (2013) used a “trap map” based on the seven factors and 42 variables to determine countries most at risk. Panther and Flechtner (2015) examined which countries have achieved convergence with the United States over discreet eight- to-nine-year time periods.
Annex 5.1 illustrates the results of the three cross-country studies that address different points in time. Aiyar and others (2013) examined whether countries risk falling into the middle- income trap in the future. Felipe and others (2012) analyzed countries now in the trap. Panther and Flechtner (2015) assessed whether countries that were middle-income countries at some point in the past 40 years have managed to converge toward the average GDP per capita in high-income countries over discreet
nine-year periods. So definitively stating which countries are now in the middle-income trap is an imprecise science.
How can countries escape from the trap?
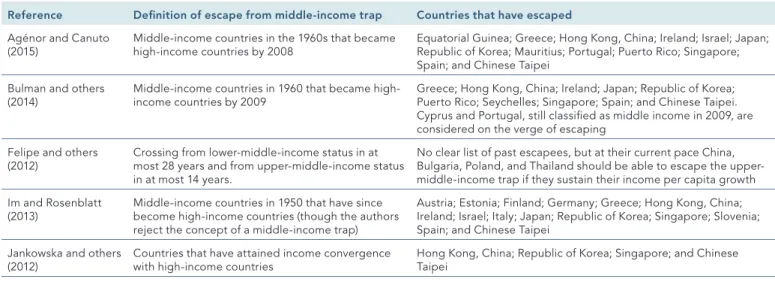
The broad array of causes for countries entering and becoming stuck in an alleged middle-income trap include macroeconomic and microeconomic factors related to industrial structure, trade profile, demographics, income distribution, macroeconomic management, and the quality of institutions. So how have coun- tries in the past escaped from middle-income status? And what lessons might this hold for countries today? In absolute terms many if not all of today’s high-income countries were arguably stuck in some sort of middle-income trap in the 20th century (table 5.2; Im and Rosenblatt 2013).
It is clear by the objective criteria for escaping the middle- income trap (graduating from middle-income country status) that numerous countries, particularly in East Asia and Central and Eastern Europe, have escaped whatever trap dynamics middle- income status might entail. Bulman and others (2014) described this process as part of a momentum hypothesis, where past escapees achieved strong growth in one period, followed by strong growth in the subsequent period. But Im and Rosenblatt (2013, p. 25) are cautious about this inevitability approach, argu- ing that attempts to grow at rates higher than 7% could lead to
“unsustainable polices that eventually create the ‘trap’-like pat- tern of dismal growth that MICs [middle-income countries] are trying to avoid in the first place.” So gradualism that focuses on overcoming the institutional factors inhibiting growth might be more promising. Roy and others’ (2016) analysis of the structural break in the 1980s when convergence started attributed this to the sharper focus on macroeconomic stability in the 1990s and on the transformational changes that the spread of information and communication technologies engendered in developed economies.
TABLE 5.2 Countries that have escaped the middle-income trap
Reference Definition of escape from middle-income trap Countries that have escaped Agénor and Canuto
(2015) Middle-income countries in the 1960s that became
high-income countries by 2008 Equatorial Guinea; Greece; Hong Kong, China; Ireland; Israel; Japan;
Republic of Korea; Mauritius; Portugal; Puerto Rico; Singapore;
Spain; and Chinese Taipei Bulman and others
(2014) Middle-income countries in 1960 that became high-
income countries by 2009 Greece; Hong Kong, China; Ireland; Japan; Republic of Korea;
Puerto Rico; Seychelles; Singapore; Spain; and Chinese Taipei.
Cyprus and Portugal, still classified as middle income in 2009, are considered on the verge of escaping
Felipe and others
(2012) Crossing from lower-middle-income status in at most 28 years and from upper-middle-income status in at most 14 years.
No clear list of past escapees, but at their current pace China, Bulgaria, Poland, and Thailand should be able to escape the upper- middle-income trap if they sustain their income per capita growth Im and Rosenblatt
(2013) Middle-income countries in 1950 that have since become high-income countries (though the authors reject the concept of a middle-income trap)
Austria; Estonia; Finland; Germany; Greece; Hong Kong, China;
Ireland; Israel; Italy; Japan; Republic of Korea; Singapore; Slovenia;
Spain; and Chinese Taipei Jankowska and others
(2012) Countries that have attained income convergence
with high-income countries Hong Kong, China; Republic of Korea; Singapore; and Chinese Taipei
The experiences of these countries center policy recommen- dations primarily on structural, industrial, and trade policies as well as social policy:
• Macroprudential policies limit the buildup of excessive capital inflows to cushion impacts of potential sudden stops. How- ever, Aiyar and others (2013) see an important role for mea- sures to enhance regional integration, infrastructure invest- ments, and deregulation in areas where private sector activity is excessively stifled. Their threat map aims to provide an ana- lytical tool to assess where these issues may be at play (see table A5.1.1 in annex 5.1).
• Developing knowledge network externalities could link indi- viduals’ skill attainment and access to public infrastructure (Agénor and Canuto 2015).
• Skilled workers are needed to move up the value chain from low value-added industries to develop higher value-added activities (Eichengreen and others 2013).
• To avoid the middle-income trap, China, like past escapees, will need to upgrade its industrial structure through new industries with higher levels of technology (Huang 2016). This will require differentiating between state-owned enterprises and non-state-owned enterprises and between product and factor markets.
Jankowska and others (2012) compared the experience of Latin American countries with the Asian newly industrialized countries using a product-space methodology and suggested that diversi- fying to new products is central to emulating the experience of the newly industrialized countries (figure 5.3). In these countries new production was sequentially developed in industries such as iron, steel, machinery, and electronics through workers with skills
and capabilities transferable from existing industries. A central lesson from these past industrialization processes is learning how to produce and export more complex products — a finding that also emerges from the complex systems analysis literature.3
Ohno (2009) proposed that Viet Nam develop a proactive industrial policy to internalize skills and technology, develop effective public–private partnerships, and deepen industrial knowledge. Focusing primarily on structural characteristics related to trade, industry, and labor market transformations, Felipe and others (2012) argued that the most direct strategy for a middle-income country to become a high-income country is to acquire a revealed comparative advantage in sophisticated and well-connected products. The focus on linking education to (pri- marily horizontal) industrial development objectives is a logical corollary for numerous researchers. Pantner and Flechtner (2015) pointed to mobilizing talent through education and providing this talent with the right incentives to assimilate best-practice technologies and organizational routines to adapt and apply them to cutting-edge technologies. Rigg and others (2014) linked this more explicitly to countries moving up the value chain through re-training and re-skilling and sustained investments in upper secondary and tertiary education.
Researchers that focus on the role of inequality in driving trap- like dynamics for middle-income countries see addressing dispar- ities as the central component. Egawa (2013) argued that policies need to address urban–rural disparities, providing benefits for low-income individuals, fiscal redistributive reforms, transfers, as well as equalizing education opportunities. Kahras and Kohli (2011) see social programs and a change in the policymaking mindset that targets the middle class as essential to avoiding the
FIGURE 5.3 Product space maps of Peru and the Republic of Korea in 2009
Peru Republic of Korea
Source: Jankowska and others 2012.
Note: The product space methodology provides a map of all traded goods displaying relative proximity or similarity between products. The colors on the map represent the Leamer classification, which categorizes products according to labor, capital, and other resource intensiveness. The black squares indicate prod- ucts in which the country has a revealed comparative advantage.
middle-income trap. All this helps countries mediate three critical transitions — from diversification to specialization in production, from physical accumulation of factors to productivity-led growth, and from centralized to decentralized economic management.
This in turn leads to a focus on institutions. Panther and Flecht- ner (2015) used a two-level model of the relationship between inequality and the middle-income trap to argue that at the inter- national level ensuring a certain level of domestic equality medi- ates the benefits of global integration for growth. At the domes- tic level a focus on economic (over political) equality is central to catch-up policies. At the global level having some independence in policy-setting from dominant external powers is essential for convergence when paired with export diversification. Dinge- mans (2016) saw the bidirectional relationship between structural change and economic development as driven by institutional change. Chang (2011) argued that increased wealth intensifies the demand for and provision of higher quality institutions and new political actors who demand and shape them. In that sense, moving from a more state- centered approach to export devel- opment, not just export promotion, is essential.
Gill and Kharas’s (2015) assessment of 10 years of literature on the middle-income trap focused on the need for policymakers to manage a transition to more mature institutions so that capital investments remain efficient even after growth moves from pro- ductivity growth stemming from intersectoral resource realloca- tions to intrasectoral catch-up technological growth.
A new World Bank study (2016b, forthcoming) on Poland’s recent high and stable growth sees this as being due in part to the country’s institutions transforming in parallel with firms increasing in sophistication and complexity — including provid- ing better foundations for resolving conflict, enforcing contracts, and implementing antitrust and competition laws. This has been bolstered by rapid integration into the EU bloc, boosting pro- ductivity through increased trade openness, investment and talent, increased domestic competition and regulatory harmoni- zation, and more certainty through commitments to EU institu- tions. In comparing new high-income countries (Chile, the Czech Republic, Hungary, the Republic of Korea, Poland, and the Slovak Republic) with trapped middle-income countries (Brazil, Mexico, Romania, and Turkey), the study found that while in the late 1990s these countries were fairly similar in many aspects, by 2015 barriers to entrepreneurship, trade, and investment were much lower in the new high-income countries, which also had lower perceived economic and political risk.
The relevance of global value chain trade for understanding the middle-income trap
While the role of trade through GVCs remains more implicit than explicit in discussions of the middle-income trap, the sig- nificance of producing and trading higher value-added goods is a central lesson from the literature. Establishing this link is the focus here. This section first addresses three questions. What is meant by GVC participation and upgrading? How is it measured,
and what factors condition countries’ ability to upgrade in GVCs? And what is the empirical relationship between GVC participation and the middle-income trap? It then provides a conceptual framework for viewing income transitions through a firm-level GVC lens.
An overview of global value chain participation and economic upgrading
Driven by lower transport, information, and communication costs, technological improvements, and lower barriers to the move- ment of goods and capital, global patterns of trade and produc- tion have changed dramatically over the past decades. Trade is now characterized by the growth and increasing dominance of vertically integrated multinational firms with fragmented value chains stretching across borders. The internationalization (and particularly regionalization) of global production and the devel- opment of value-chain trade in both goods and services have changed the prospects for countries to benefit from trade. In this context, understanding a country’s current participation in value chains is central to ensuring that its industrial and trade policies can facilitate sustainable productivity gains and increased qual- ity employment in higher value-added sectors. For developing countries this creates opportunities to upgrade into new higher productivity tasks and activities and to integrate into global production networks. But according to some researchers, this is often less an issue of catching up than of fitting into existing GVCs (Whittaker and others forthcoming).
The value chain concept in the industrial organization litera- ture (Porter 1985) has become ever more central to understand- ing and analyzing the interfirm and intrafirm dynamics and gov- ernance of value-chain trade (Gereffi and others 2005). And in trade economics it has increasingly become the dominant frame- work to understanding the second unbundling of globalization (Baldwin 2006; see Antràs and Rossi-Hansberg 2009 and Ahmad 2013 for overviews of this literature). Viewing trade through a GVC framework involves four paradigm shifts for trade policy (Catteneo and others 2013):
• It implies a move toward a global (or at least regional) view of policy.
• It requires a shift from entire industries to narrower tasks and business functions.
• It requires assessing a country’s competitiveness not as endowments and stocks but as flows in which GVCs are the primary channel enabling transfers.
• It implies a change from focusing on tariffs as the most rele- vant obstacles to trade to focusing on behind-the-border bar- riers and regulatory measures.4
Viewing trade this way requires a revised approach to mea- suring and analyzing cross-border and cross-industry flows, with value-added trade becoming a more relevant measure of trade flows within GVCs. For individual countries becoming competitive in specific components and tasks to participate in globalized pro- duction networks and in turn generate more value domestically over time becomes increasingly important (Taglioni and Winkler 2016). So using multiregion input- output tables allows for tracking
use at the sectoral level and for differentiating between transac- tions in intermediate and final goods. This has informed a growing literature on the development of value added in trade (see Hum- mels and others 2001, Koopman and others 2014, and Johnson and Noguera 2012) and a growing number of indicators and indi- ces (Fally 2012, Antras and Chor 2013, and Wang and others 2016).
Measuring value-added trade through multiregion input- output databases has clear benefits (Ahmad 2013):
• It makes it possible to understand a country’s actual indus- trial structure and international links among sectors in order to formulate targeted policies and strategies.
• It provides evidence of how nontariff measures or regulatory changes affect upstream and downstream producers.
• It offers better analytical tools to anticipate the impact of potential shocks.
• It enables calculations of the trade’s job content and impact on ecosystem services, thanks to satellite accounts of employ- ment and environmental indicators.
However, multiregion input- output tables have some limita- tions. They cannot measure the links among service sectors very accurately. And they are subject to two simplifying assumptions:
the proportionality assumption, that all products (for export and domestic use) have the same import content, and the homo- geneity assumption, that the use of inputs is uniform among all firms in a sector.
The new data make it possible to quantify economic upgrad- ing through GVC participation. Drawing on earlier work by Hum- phrey (2004), Taglioni and Winkler (2016) differentiated four types of economic upgrading based on skills, capabilities, and comparative advantage. Process upgrading is based on effi- ciency gains and productivity improvements. Product upgrading entails moving into more sophisticated products in an existing value chain. Functional upgrading involves increasing the value- added share by moving toward more sophisticated tasks. And intersectoral upgrading involves moving into new value chains with higher value-added shares (figure 5.4).
The ability of firms to upgrade is determined by improving workers’ skills, improving firms’ absorptive capacity and technol- ogy, and increasing productivity in existing tasks. Lead firms set detailed specifications and requirements that exceed local norms and create opportunities for improving capabilities, technolo- gies, and assets. But this is not always the case: the complexity of GVCs and the power dynamics within their governance structures can lead to stagnation or downgrading (Rossi 2013; Blažek 2015).
The empirical relationship between global value chain integration and the middle-income trap
A broad literature on the factors likely to influence a country’s ability to upgrade in GVCs is based primarily on case studies, with few econometric analyses (until recently). But open econo- mies tend to grow faster and have higher incomes than do closed economies (Wacziarg and Welch 2008; Gill and Kharas 2015).
GVC participation can lead to higher output, productivity, and value added through five main transmission channels: back- ward and forward links, pro- competitive market restructuring,
technology spillovers, minimum scale achievements that amplify pro- competitive effects, and labor market effects, including the demand for skilled workers and their training as well as turn- over when trained workers move to local firms (figure 5.5).5 The individual channels have complex and frequent intermediating effects on each other.
Three main factors link value-chain integration to productiv- ity: foreign direct investment, exporting, and importing inputs FIGURE 5.4 Achieving functional, product, and
intersectoral upgrading through skills, capital, and process upgrading
Value- added growth value-added High
production
Tasks
with
comparative advantage Current skills and capa
bilities Capital upgrading
upgra ding Skills
upgrading Process Functional upgrading
upgra ding Inte
rsecto
ral upgrading Product
Source: Taglioni and Winkler 2016.
(Kummritz and others 2016). For foreign direct investment the impact of spillovers on productivity is not conclusive (Görg and Greenaway 2004, Paus and Gallagher 2008). For the link between exporting and economic upgrading, Bernard and Jensen (1999) demonstrated that exporters outperform nonexporters in the same sector and country in productivity, skills, and wages. Is this self-selection or learning by exporting? For self-selection the assumption is that only more productive firms are able to absorb additional trade costs. The learning by exporting liter- ature argues that exporting improves the productivity of firms over time, with the most robust findings for developing countries and nascent industries. Recent research questions the robust- ness of these early learning by exporting studies (Clerides and others 1998), but Lileevea and Treffler (2007) found learning by exporting effects for Canada, and Fernandes and Isgut (2005) found them for Colombia.
Research on the link between importing inputs and produc- tivity focuses on developed countries. Importing can improve key aspects of competitiveness through three main feedback loops: productivity, innovation, and skills. Easier access to imports tends to improve firm productivity. Grossman and Rossi- Hansberg (2006) showed that offshoring can entail productivity gains similar to technological progress for offshoring countries through lower input costs. Amiti and Konings (2007) showed that
a 10% drop in input tariffs leads to a 12% improvement in pro- ductivity for importing firms. Bas (2012) showed that for a sample of Argentinian firms, input tariffs facilitate entry into export mar- kets. MacGarvie (2006), drawing on French trade and citation data, and Bøler and others (2015), using a sample of Norwegian firms, found importers to be more innovative and profitable.
Skills are relevant for importing and complementary to it. Koren and Csillag (2011) showed that importing more sophisticated machines requires higher skills to operate them and increases the returns to skills.
To test whether GVC participation has enabled countries to upgrade economically, Kummritz and others (2016) used foreign value added in exports and domestic value added re-exported by third countries as respective measures of backward and for- ward GVC integration and domestic value added generated by a specific sector as the measure of economic upgrading. They tested the impact of national characteristics that may be associ- ated with economic upgrading via GVC participation: infrastruc- ture, connectivity, investment and trade policy, business climate and institutions, financial and labor markets, skills and education, innovation and product standards, as well as labor, social, and environmental standards. They found that overall GVC integra- tion increases a country’s domestic value added. Splitting the sample into income groups did not substantially change results, FIGURE 5.5 Transmission channels from global value chain participation to the domestic economy
Diffusion effect Availability and quality
effect Demonstration
effect
Technology spillovers
Backward and forward
links
Labor markets Minimum
scale achievements
competitivePro- market restructuring
Amplification of pro-competition
effect Sustainability
effect
Pro-competition effect Demonstration
effect
Demand effect Assistance
effect
Demand effect Training effect Labor turnover
effect
Domestic impact of GVC
participation
Source: Taglioni and Winkler 2016.
though GVC integration as a buyer (through foreign value added) is more significant at lower incomes and selling into GVCs has more impact at higher incomes. For countries buying from GVCs air freight infrastructure and road network quality are particu- larly important. Connectivity, education and skills, and standards compliance are most important for countries selling into GVCs.
The researchers concluded that the policy areas thought to be significant for economic upgrading in GVCs largely have the expected impact.
The correlation between GVC integration and GDP per capita depends on income status and the type of integration (figure 5.6; Boffa and others 2016). GVC integration increases GDP per capita, but the gains diminish as income increases. Similarly, growth in output per capita is highest for lower income groups.
Some channels for GVC integration depend on industry similar- ity, with links assumed to be easier when trade is intraindustry.
Manufacturing leads to higher GDP gains for buyers, but for
services both types of integration — forward and backward — lead to similar GDP increases.
These studies suffer from two main limitations. First, because of the lack of value-added trade data prior to 1990, they permit analysis for only the last 20 years, while much of the middle- income-trap literature goes back 50 years or more. Second, they do not specify the conditions for specific types of institutions and policies to produce greater gains from GVC participation.
The next section addresses both limitations in part from a theo- retical perspective.
Viewing income transitions through a global value chain lens: bringing in the firm perspective
The previous section showed that while integrating into GVCs is associated with sustained growth and development, doing so may become more difficult and complex at higher incomes.
This section explicitly adopts a GVC firm-level lens to the income
FIGURE 5.6 Growth of global value chain integration and GDP per capita by income category GDP per capita
Buyer perspective
Low income Lower middle income Upper middle income High income
Lower middle income Upper middle income High income –3
–1 –2 0 1 2 3
–3 –2 –1 0 1 2 3 –3 –2 –1 0 1 2 3 –3 –2 –1 0 1 2 3 –3 –2 –1 0 1 2 3
–3 –1 –2 0 1 2 3
–3 –2 –1 0 1 2 3 –3 –2 –1 0 1 2 3 –3 –2 –1 0 1 2 3 –3 –2 –1 0 1 2 3
Foreign value added Foreign value added Seller perspective
Low income
Source: Boffa and others 2016.
transitions from low to middle to high through a series of dia- grams laying out these transitions.
Mariscal and Taglioni (2017) proposed a framework that views firms’ connection to GVCs as a dynamic process for the rele- vance of capabilities to evolve in a continuum (figure 5.7). The first dimension (x-axis) contains the buying, producing, and sell- ing aspects of integration in GVCs, and the second dimension (y-axis) illustrates the degree of GVC engagement, from proto- connecting to connecting to upgrading to mature engagement.
The orange lines indicate the growing intensity of engagement on the buying side, and the blue lines indicate the growing inten- sity of engagement on the selling side. More sophisticated issues tend to appear on the upper section of the diagram, where upgrading meets buying, producing, and selling in increasingly nuanced and complex ways. Connecting usually starts on the buying side: firms that correctly evaluate their core capabilities and have an effective sourcing strategy are more likely to suc- cessfully engage in GVCs. However, the sequence of engage- ment from simpler to more sophisticated, and from buying to selling capabilities, is intended to be illustrative. Rather than
tightly allocating capabilities into specific steps on the diagram, most capabilities are shared between elements. The diagram is somewhat selective in reporting the most relevant determinants, since they may vary by industry and GVC.
Engagement starts with the proto-connecting stage, when reaching a minimum scale of transactions is key in both the buying and the selling functions. Intermediaries that play a matching role can help firms move the first steps toward inter- national engagement. The large intermediaries may themselves become companies engaging in GVCs, as traders or by gradu- ally adding value by expanding into processing for some of the immediate upstream or downstream functions.
The pure connection stage is mostly about meeting minimum requirements — a few basic capabilities that allow the firm to con- nect to either a foreign market or a lead firm. Basic capabilities (such as production or managerial abilities and cheap access to key inputs of the production process) and the ability to correctly evaluate and leverage the firm’s core competences are crucial in connecting to GVCs. From a buying perspective this means that the firm can streamline its processes and product scope while FIGURE 5.7 How global value chain determinants evolve as the engagement in global value chain changes
GVC engagement intensity on the buying side
GVC engagement process
Buying Producing Selling
Mature engagement
Upgrade
Connect
Proto-connect
GVC engagement intensity on the selling side Automation
Coordination of processes
• Overcome low-value transaction constraints on the selling (exporting) side
• Overcome low-value transaction constraints on the buying (importing) side
• Establishing proper access to inputs
• Input quality
• Deep relationship with own suppliers
• Development of investment capabilities
• Full alignment of own and buyer procurement strategies
• Deep relationship with tech institutions
• Capital deepening
• Adaptive research and development (to seamlessly fit inputs to own product)
Learning by doing
GVC engagement stage, domestic value added in exports, foreign value added in exports
• Firm organizational and managerial practices
• Learning about demand
• Skills for efficient use of intermediates
• Frontier research and development
• Acquiring capabilities in intangible capital
• Widely recognized brand
• Organizational capital as core capability
• Learning through imitation
• Adaptive research and development, product and process upgrading
• Functional and intersectoral upgrading
Define own product scope
Source: Mariscal and Taglioni 2017.
complementing production with proper and effective access to input markets. From a selling perspective the key capabilities are aligning its goals to those of actual and potential buyers and modulating its processes to fit seamlessly in their produc- tion processes. At this stage engagement in GVCs is not a robust situation but is unstable and subject to market forces that may exclude the firm from continuing the connection.
Once a firm overcomes the challenges of pure connection, its learning processes and absorptive capacities become more fundamental — learning by exporting, learning from selling to global buyers, and learning to connect decisions on the prod- uct scope to the available importing possibilities. At this stage demand-side elements also acquire importance, as the firm needs to make its product known and valued. Efforts will also be made to accumulate customers, although competition will be based mostly on price rather than quality. As the process continues and deep- ens, process innovation and product innovation will start to matter greatly. Relatedly, firms’ organization of skills will change. Middle management will start to become more important than produc- tion, and the firm will increasingly focus on its core competences and learn to spin off tasks that are not its comparative advantage.
In the final stage firms upgrade toward the most complex stages of GVC production. Firms are now in direct relation with, or themselves become, lead firms, turnkey suppliers, trading platforms, or global buyers. The relationships between buyers and sellers are seldom the result of market interactions but are geared to modular (or even captive) interaction. Firms connect to the most technologically relevant buyers with good learning
potential and virtuous feedback loops through direct and indi- rect exposure to new ways of managing and organizing produc- tion. Meanwhile product complexity also increases, with prod- ucts both more elaborate and containing more value added.
The evolutionary process in GVCs is unlikely to take place in a vacuum. As firms transition from proto-connecting to connect- ing to upgrading to mature engagement, a parallel process of development takes place in the hosting economy. The domestic economy will likely have evolved to development stages where an ecosystem of firms starts building up, populating the middle size. The determinants of firm growth will also evolve, increas- ingly a function of firm capabilities rather than institutional idiosyncrasies.
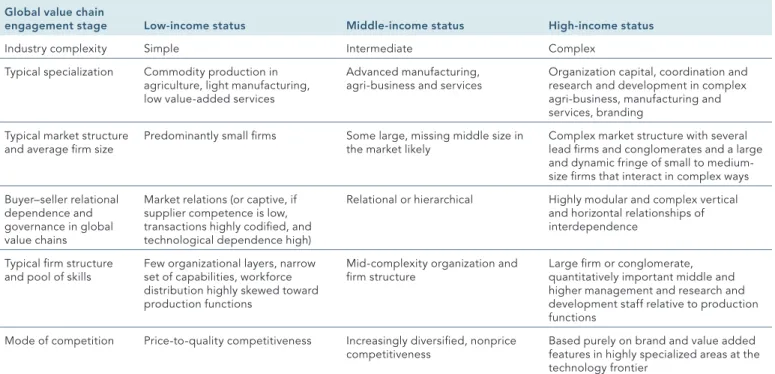
Reflecting their comparative advantages, firms in low-income countries will tend to be engaged in GVCs in industries such as agriculture and manufacturing, where complexity is limited and price competition is more common than nonprice competition (table 5.3). In these industries buyer–seller relations tend to be either at arm’s length or captive. They are captive when the lead firms are technologically very dependent on suppliers, transac- tions are highly codified, and supplier competence is low. Firm size is not a constraint at this stage, so small firms can easily engage. Once countries graduate to middle-income status, their firms start integrating in GVCs with functions in advanced man- ufacturing and modern professional services, including prepro- duction and postproduction high-value added services. In these GVCs buyer–seller relations tend to be more relational, captive, or hierarchical, with substantial know-how transfers. Participating
TABLE 5.3 Trajectories in global value chain engagement Global value chain
engagement stage Low-income status Middle-income status High-income status
Industry complexity Simple Intermediate Complex
Typical specialization Commodity production in agriculture, light manufacturing, low value-added services
Advanced manufacturing,
agri-business and services Organization capital, coordination and research and development in complex agri-business, manufacturing and services, branding
Typical market structure
and average firm size Predominantly small firms Some large, missing middle size in
the market likely Complex market structure with several lead firms and conglomerates and a large and dynamic fringe of small to medium- size firms that interact in complex ways Buyer–seller relational
dependence and governance in global value chains
Market relations (or captive, if supplier competence is low, transactions highly codified, and technological dependence high)
Relational or hierarchical Highly modular and complex vertical and horizontal relationships of interdependence
Typical firm structure
and pool of skills Few organizational layers, narrow set of capabilities, workforce distribution highly skewed toward production functions
Mid-complexity organization and
firm structure Large firm or conglomerate,
quantitatively important middle and higher management and research and development staff relative to production functions
Mode of competition Price-to-quality competitiveness Increasingly diversified, nonprice
competitiveness Based purely on brand and value added features in highly specialized areas at the technology frontier
Source: Adapted from Mariscal and Taglioni 2017.
firms tend to be medium to large, particularly in manufacturing (Cusolito and others 2016). Firm growth is driven by productivity and capabilities rather than by rent positions. And competition among firms is increasingly based on nonprice features, such as quality, customization, and responsiveness and timeliness in delivery.
Once countries reach high-income status, their firms’ engage- ment in GVCs will likely be predominantly specialized in coor- dination and high-value added services, such as research and development and branding. Firms are primarily buyers of inputs and components and sellers to end markets — or engaged in modular relationships. Their comparative advantage is based on offering highly specialized products at the technology frontier.
Institutions are central to these processes. Consider three key aspects. First, coordination among different levels of govern- ments has to ensure that policies are not done and undone at dif- ferent levels or that competition among regions does not erode the fiscal base. Coordination becomes increasingly important at higher levels of development. Second, predictability in policy implementation also matters proportionally with the level of development. Uncertainty could erode good current incentives by exposing firms to unnecessary risk. For example, uncertainty in trade openness policies may freeze the formation of buyer–
supplier links as firms find it optimal to wait before engaging in investments that lose all their value unless variable trade costs are actually reduced. Third, policies should be well sequenced.
For example, opening to foreign direct investment without actu- ally developing basic infrastructure and institutions is unlikely to generate much investment or many jobs. It may be beneficial to consider gradual increases in competition so that foreign firms do not eradicate all domestic firms and capture all economic rents. To put in place policies conducive to real domestic com- petition is a sensible requirement before opening to trade or foreign direct investment. Another, more classic example is the coordination between foreign direct investment and trade pol- icies. Since multinational corporations are import-intensive, opening to foreign direct investment to create jobs will not work unless foreign companies can also have access to the foreign services and intermediate goods they require.
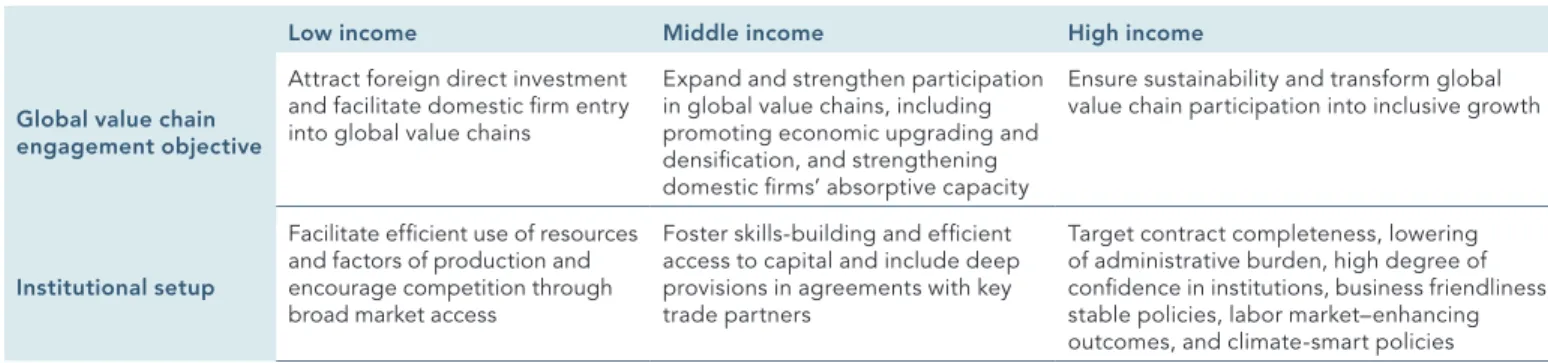
There is no one way to optimally sequence policies, since considerations are context-specific. Yet some general regular- ities in policies are likely to matter at different stages of GVC engagement and development (Taglioni and Winkler 2016). At the initial stages of GVC engagement, policies are best directed toward facilitating efficient use of resources and factors of pro- duction and encouraging competition through broad market access (table 5.4). As development takes place and GVC engage- ment deepens, the institutional setup should focus on helping firms thrive in a complex world — with both imports and exports from and to multiple countries and sourcing and selling to multi- national corporations (domestic and foreign).
When a country reaches middle-income status, institutions can help leverage GVC engagement for development by foster- ing skill building, innovation, and efficient access to capital; by including deep provisions in agreements with key trade partners;
by supporting the engagement of more local firms and workers in the GVC network; and by focusing on structural reforms that raise domestic labor productivity and skills. As countries target high-income status, building institutions that allow for contracts to be more complete and for administrative burdens to be lower.
They also need to ensure high confidence in the institutions, busi- ness friendliness, and stable policies. Labor market– enhancing outcomes for workers at home and more equitable distributions of opportunities and outcomes create social support for a reform agenda aimed at strengthening a country’s GVC participation.
Climate-smart policy prescriptions can mitigate the challenges for firms from climatic disruptions. Frederick’s (2016a, 2016b) work on the apparel GVC in China illustrates this dynamic (box 5.1).
Participating in global value chain trade in the context of a rapidly changing world of industrial production and work The positive and significant relationship between GDP per capita and integration into GVCs raises questions about the gains of GVC trade for workers in countries at the middle-high income threshold. Over the past few years numerous reports and papers have investigated the impact of technological change on produc- tion, trade, and labor markets (West 2015; Oxford Martin School 2016; Chui and others 2016; WEF 2016; KPMG 2016; Autor 2015;
TABLE 5.4 The institutional dimension of global value chain engagement
Low income Middle income High income
Global value chain engagement objective
Attract foreign direct investment and facilitate domestic firm entry into global value chains
Expand and strengthen participation in global value chains, including promoting economic upgrading and densification, and strengthening domestic firms’ absorptive capacity
Ensure sustainability and transform global value chain participation into inclusive growth
Institutional setup
Facilitate efficient use of resources and factors of production and encourage competition through broad market access
Foster skills-building and efficient access to capital and include deep provisions in agreements with key trade partners
Target contract completeness, lowering of administrative burden, high degree of confidence in institutions, business friendliness, stable policies, labor market–enhancing outcomes, and climate-smart policies
Source: Adapted from Taglioni and Winkler 2016.
Beaudry and others 2016, Eden and Gaggi 2015; Morikawa 2016;
Pikos and Thomsen 2016). Researchers have focused on the rapid technological advances in automation, big data analytics, and digitization. They have also looked at manufacturing responses to climate change and other environmental- and resource- related risks, including transitions toward additive manufacturing through three-dimensional printing technologies. And they see the growth of the circular economy as likely to require manufac- turers to design products for several cycles of disassembly and reuse.
GVCs are characterized by four features: customized produc- tion; sequential production decisions going from the buyer to the suppliers; high contracting costs; and global matching of goods, services, production teams, and ideas (Antràs 2015). All four point to the substantial power that multinational corporations coordi- nating GVCs have in selecting where to geographically locate individual production tasks. Technological improvements are likely in each of these cases to increase both the sophistication of buyer demands and the supplier capabilities to meet them. A full exploration of these issues is beyond the scope of this chapter, but given their implications for the relationship between GVC par- ticipation and declining economic growth and structural stagna- tion that many middle-income countries experienced, it is worth addressing two aspects of these medium-term developments.
First, the workforce skills required to manufacture even unsophisticated products is likely to increase substantially, requir- ing not only higher levels of education but also cross-domain
skills and tacit knowledge for using new equipment and think- ing computationally and analytically and high levels of technical and engineering knowledge. For many middle-income countries this will require a fundamental upgrade of education systems, research institutions, and innovation systems. So the already diminishing advantage that labor-abundant, low-wage countries possess for low-skill manufacturing is likely to diminish further.
Second, re-shoring production to developed economies — given the need for highly skilled workers and, more important, the ability to automate many tasks — is likely to become even greater in coming years, reinforced by the rapidly growing polit- ical backlash against globalization and rising economic nation- alism in many western countries. Some 70% of clients surveyed in a recent study believe that automation and developments in three-dimensional printing will encourage companies to move their manufacturing closer to home, with North America seen as having the most to gain from this trend and China the most to lose (Oxford Martin School 2016). The jobs of 77% of workers in China and 69% of workers in India are at risk because of auto- mation (World Bank 2016c). In this context the rapidly growing importance of trade in data and information, even within produc- tion and manufacturing, is likely to further increase the modu- larity of work processes and to bypass all but the most sophisti- cated middle-income countries.
Together, these issues are likely to reinforce concerns of pre- mature deindustrialization, with countries running out of industri- alization opportunities sooner and at lower income than earlier BOX 5.1
Lessons from China for apparel upgrading
China has been remarkably successful in the apparel indus- try, improving all key areas and growing rapidly. Fredrick (2016) argued that it was able to upgrade (process, product, end-market, function, and intersectoral) by having a dis- tinct value proposition that entailed affordability, reliability, and the development of a good reputation; a broad range of product categories; full-package offerings; and “good- enough” compliance. She attributes this to six factors:
• Industrial polices geared toward upgrading and assess- ing global dynamics, including grants and loans for tech- nological upgrading, incentives for machinery to make more advanced products while removing incentives for lower-value products; targeting of non-EU and non-U.S.
markets as well as the domestic market; investments in textile capabilities and sustained technological invest- ments and growth in key material segments; a “go-out”
policy to encourage investment of low value-added seg- ments in neighboring countries; and support for domes- tic brand development.
• A functional division of labor between sales and produc- tion, using agents and intermediates to promote manu- facturers and link up with global buyers.
• Investments in connectivity through sourcing offices in Hong Kong, China, and near airports in mainland China that focused on having buyers both close and comfortable.
• Continuous innovation and modifications in production processes to keep costs low and keep up with emerging competitors.
• Developing long-term relationships that built on improvements in quality, speed, and price competition.
• Correctly assessing the tipping points for buyers possi- bly inclined to change suppliers and not exceeding them.
While China’s success cannot be directly replicated, it does have numerous lessons for other countries, including the importance of developing long-term relationships and ties with foreign firms, partnering with Chinese firms both to transfer skills and knowledge and to access the Chinese market, targeting emerging markets without highly devel- oped buyer–supplier relationships, targeting niches within a highly diversified industry, and taking advantage of rising labor costs in China to undercut these suppliers.
Source: Frederick 2016.