Impact of product‑related environmental
regulations in Asia : descriptive statistics from a survey of firms in Vietnam
著者 Michida Etsuyo, Nabeshima Kaoru, Ueki Yasushi
権利 Copyrights 日本貿易振興機構(ジェトロ)アジア
経済研究所 / Institute of Developing
Economies, Japan External Trade Organization (IDE‑JETRO) http://www.ide.go.jp
journal or
publication title
IDE Discussion Paper
volume 466
year 2014‑03‑01
URL http://hdl.handle.net/2344/1312
INSTITUTE OF DEVELOPING ECONOMIES
IDE Discussion Papers are preliminary materials circulated to stimulate discussions and critical comments
Keywords: global supply chain, FDI, product-related environmental regulation, REACH, RoHS
JEL classification: F18, O14
* Associate Senior Research Fellow, IDE ** Chief Senior Researcher, IDE
*** Economist, Economic Research Institute for ASEAN and East Asia (ERIA) Corresponding author: Etsuyo Michida ([email protected])
IDE DISCUSSION PAPER No. 466
Impact of Product-related Environmental Regulations in Asia: Descriptive Statistics from a Survey of Firms in Vietnam
Etsuyo Michida
*, Kaoru Nabeshima
**and Yasushi Ueki
***March 2014
Abstract
This paper summarizes the main results of a unique firm survey conducted in Vietnam in 2011 on product-related environmental regulations (PRERs). The results of this survey are compared with the results of a corresponding survey of firms in Penang, Malaysia (Michida, et al. 2014b). The major findings are as follows. First, adaptation to PRERs involves changes in input procurement and results in market diversification, which potentially alters the structure of supply chains. This finding is consistent with the Malaysian survey result. Second, connections to global supply chains are key to compliance, but this requires firms to meet more stringent customer requirements. Third, government policy can play an important role in assisting firms to comply with PRERs.
The Institute of Developing Economies (IDE) is a semigovernmental, nonpartisan, nonprofit research institute, founded in 1958. The Institute merged with the Japan External Trade Organization (JETRO) on July 1, 1998.
The Institute conducts basic and comprehensive studies on economic and related affairs in all developing countries and regions, including Asia, the Middle East, Africa, Latin America, Oceania, and Eastern Europe.
The views expressed in this publication are those of the author(s). Publication does not imply endorsement by the Institute of Developing Economies of any of the views expressed within.
INSTITUTE OF DEVELOPING ECONOMIES (IDE), JETRO 3-2-2, WAKABA,MIHAMA-KU,CHIBA-SHI
CHIBA 261-8545, JAPAN
©2014 by Institute of Developing Economies, JETRO
No part of this publication may be reproduced without the prior permission of the IDE-JETRO.
1
Impact of product-related environmental regulations in Asia:
Descriptive statistics from a survey of firms in Vietnam Etsuyo Michida, Kaoru Nabeshima and Yasushi Ueki
Abstract
This paper summarizes the main results of a unique firm survey conducted in Vietnam in 2011 on product-related environmental regulations (PRERs). The results of this survey are compared with the results of a corresponding survey of firms in Penang, Malaysia (Michida, et al. 2014b). The major findings are as follows. First, adaptation to PRERs involves changes in input procurement and results in market diversification, which potentially alters the structure of supply chains. This finding is consistent with the Malaysian survey result. Second, connections to global supply chains are key to compliance, but this requires firms to meet more stringent customer requirements. Third, government policy can play an important role in assisting firms to comply with PRERs.
Acknowledgement
This research project was conducted from 2011 to 2013 as a joint project of UNIDO-ERIA-IDE for collaborative research on the green economy. Our research “Impact of product-related environmental regulations in Asia” was financed and conducted by IDE. The research team was led by Etsuyo Michida. Kaoru Nabeshima and Yasushi Ueki are members of the team from IDE-JETRO. We are indebted to Toshi H. Arimura from Waseda University, Tsunehiro Otsuki from Osaka University, Shunsuke Managi from Tohoku University, and Hakaru Iguchi from Atomi Women’s University for their valuable advice and comments. I would like to thank the Vietnam Chamber of Commerce and Industry (VCCI) for assisting in administering the survey in Vietnam.
Introduction
Environmental and health-related regulations for products or product-related environmental regulations (PRERs) imposed in developed countries have raised concern among exporting countries. If exported products do not satisfy the regulatory requirements, noncompliant products cannot be placed on regulated markets and firms may face technical barriers to trade (TBT). As PRERs become more demanding and increase in variety, concerns about their use have been most prevalent in developing Asian countries that have been the center of world manufacturing for decades (Michida, et al. 2014a). Many parts and component suppliers of global assemblers are located in these countries and these firms are required to meet PRERs in their manufacturing activities.1,2
1 See, for instance, Hiratsuka and Uchida (2010).
2
Although developing Asian countries have improved their manufacturing capabilities, many firms appear to lack capacity to comply with technical regulations.
Michida and Nabeshima (2012), through a series of interviews with firms in the electrical and electronic, furniture, and plastic industries of Vietnam in 2011, show that firms that are part of global supply chains (GSCs) are most able to adapt to PRERs.
Specifically, firms involving multinational corporations (MNCs) as customers or lead firms often are assisted by the lead firms in adapting to the PRERs imposed in their export markets. In contrast, domestic firms that do not belong to GSCs often face hurdles to continued export to regulated markets. This result implies that PRERs could become a barrier for firms attempting to export to regulated markets lacking the support of MNC lead firms. The Vietnam Research Institute (2011), through case studies of the footwear industry, also confirm that footwear firms working with MNC firms can receive technical advice and, given the relatively larger financial base of these firms, can make production process changes easily. However, there are also a number of small-scale domestic firms that currently target only the domestic market but that are examining the use of exports in the future as a way to increase their market opportunities.
Our research focuses on regulations and requirements related to chemicals contained in products. Two primary European Union (EU) regulations are the major examples of such PRERs examined in this paper. These regulations, enacted by the EU Parliament and Council, are the Restriction of Hazardous Substances (RoHS) Directive and the Registration, Evaluation, Authorization and Restriction of Chemicals (REACH) Regulations. The RoHS Directive, which restricts the use of certain hazardous substances in electrical and electronic equipment, was implemented in 2006.3 The REACH Regulations were implemented in 2007 and regulate chemical substances and chemicals contained in products that cause serious concern for consumer health and the environment. Under REACH, if a product contains chemicals classified as substances of very high concern (SVHC) in excess of 0.1% by weight, firms are required to notify the European Chemicals Agency, the relevant regulatory body, and obtain authorization.
PRERs are not only set by foreign governments. In Vietnam, the Ministry of Industry and Trade issued Circular No. 30/2011/TT-BCT on temporary regulations on allowable concentration limits of certain hazardous substances in electrical products and electronics, which set the same limits for the six hazardous substances defined under the
2 For a description of chemical-related PRERs in Asia, see Michida (2014). For Asian countries’ actions about PRERs, see Ramungul (2013) for the case of Thailand, Chen et al. (2014) for the case of Malaysia.
3Prohibited substances include lead, mercury, cadmium, polybrominated biphenyl (PBB), and polybrominated diphenyl ether (PBDE).
3
EU RoHS Directive.4 Thus, this regulation has been referred to as the Vietnamese RoHS.
When chemicals contained in final products are regulated, the materials, parts, and components used in them must be redesigned, monitored, tested, and proven to meet the mandated chemical thresholds. Part and component suppliers are located across borders;
therefore supply chains, value chains, and production networks must be managed across firms, industries, and countries. To make adaptation even more complicated, the impact of chemical-related are often affects multiple industries. Firms affected by the EU REACH and RoHS regulations are not only those in the chemical industry, but also the textile, wood products, plastic, rubber, machinery, electric and electronic industries, and many others5. Many potentially affected industries are located in developing countries and firms that aim to export to EU markets are affected in particular.
Our research interest lies in examining the impact of PRERs on Asian firms that directly or indirectly export to regulated markets. Differences in capacity and strategies in adapting to PRERs in different industries are also highlighted.
Beyond anecdotal evidence drawn from firms’ experiences or case studies, no statistics have been collected on a larger scale on adaption to PRERs. Thus, further examination on the impact of PRERs on firms and their adaptation behavior has not been possible to date. To our knowledge, research has not yet been conducted that allows for extensive examination of how firms adapt to PRERs. Therefore, we decided to conduct a research project on PRERs from 2012 to 2014. We approached the issue from different methodologies, including case studies of firms, interviews with policy makers, and a series of surveys of firms in three Asian countries at different stages of economic development: Vietnam in 2011, Malaysia in 2012, and Japan in 2013. The Malaysia survey results are compiled in Michida, et al. (2014b). Using the survey of firms in these three countries, we have constructed a unique dataset. Using the data obtained in Malaysia, the roles of GSCs in PRER compliance are discussed in Michida et al. (2014a). Arimura et al.(2014) examined the linkage between compliance with PRERs and adoption of ISO standards.
This paper shows the descriptive statistics from our Vietnam survey conducted in
4 However, the Circular does not specify which agencies are required to make the assessment of the levels of toxic chemicals in products, and a second circular guiding customs authorities has been issued since there have been difficulties in implementation of the Circular.
5 The targeted products of RoHS are electrical and electronic (E&E) products. But RoHS affect the sectors other than E&E because the final products may be distributed with textile bags, or the products such as electric outlet are assembled into wooden desks and so on.
4
2011 and compares the results with those of the Malaysian survey.6
Section 1 explains the research questions for our firm survey and Section 2 provides an explanation of our dataset. Section 3 shows general characteristics of firms in Vietnam. Section 4 highlights the structure of supply chains in Vietnam. Section 5 examines the statistical results for each research question addressed in Section 1. Finally, Section 6 concludes the paper.
1. Research Questions
This section highlights the research questions used in our survey of firms. As the surveys in Malaysia and Vietnam were conducted using the same research questions, many of the survey questions are common to both surveys. Therefore, the questions described in this paper are the same as in Michida, et al. (2014b) for the Malaysian survey. This paper compares the results of the two surveys conducted in Vietnam and Malaysia. For further details of the Malaysian survey results, please see Michida,, et al.
(2014b).
Although we have anecdotal evidence on the impact of PRERs on firms, we are not certain how extensive the impact is across firms and industries. In addition, the situation on PRER adaptation in developing countries is not clear. Therefore, our first question is:
Question 1: Impacts of chemical PRERs on firms: How are firms affected by regulations/requirements for chemicals in products?
Questions 2 to 4 address firms’ adaptation with PRERs and their effect on global supply chain structures.
Question 2: Material Procurement: How do firms optimize their behavior with regard to purchasing materials?
Question 2 refers to our hypothesis that changing input materials may require firms to change their suppliers in order to meet regulations. It implies that compliance with regulations could change supply chain structures by prompting firms to switch from non-compliant to compliant suppliers.
6 Arimura et al. (2014) analyze diffusion of ISO 9000 and 14001 when firms face chemical regulations.
Michida et al. (2014a) focuses on the roles of global supply chains in adapting to PRERs.
5
Question 3: Market diversification: Do firms change their destination markets due to stricter regulations implemented in their previous export markets?
Question 3 addresses whether PRERs hamper trade and require firms to change their markets. Both Question 2 and Question 3 lead us to ask what implications these changes have on the environment in country, regional, and worldwide levels.
Question 4: Implication on supply chains: What are the implications of switching markets on the environment and health in developing countries?
Questions 5 and 6 ask about measures taken by firms to adapt to PRERs and their implications for businesses.
Question 5: Measures taken by firms: What did firms do to adapt to PRERs?
What were the motivations for firms to take these measures?
Question 6: Business implications: What were the implications for business from adapting to PRERs?
Lastly, Question 7 relates to implications of government policy. What can policy do to improve the situation?
Question 7: Policy implications: What can policy do to assist firms adapt to PRERs?
2. Data description: Basic information
The survey in Vietnam was planned and the main content of the questionnaire developed by a team from IDE-JETRO. Then, the questionnaire was translated into Vietnamese and administered by the Vietnam Chamber of Commerce and Industry. For sampling, the targeted sectors covered manufacturing and commercial sectors that are likely to be required to manage chemicals in products. The geographical scope of the survey covered 63 provinces in Vietnam. The sample was drawn from a list of firms from the General Department of Taxation containing 1,954 foreign-owned firms and 10,024 private domestic firms. For our purposes, foreign-owned firms are defined as all firms receiving foreign direct investment (FDI) and include both 100% foreign-owned
6
firms and joint ventures between local firms and MNCs (henceforth, we refer to these firms as FDI firms). The survey was sent to all FDI firms and 70% of private firms that were randomly selected. The Vietnam survey was conducted from December 2011 to January 2012. The questionnaire was distributed via mail, with follow-up phone calls made when necessary. Over the month that the survey was conducted, we sent out a total of 11,978 questionnaires and received 1,055 responses, resulting in a response rate of 8.8%.
Comparing the distribution of the firms to which the questionnaire was sent and the distribution of firms from which a response was received, FDI firms account for 16.3% of questionnaire recipients and 31.9% of the responses. Among the responding firms, most were located in Hanoi (190 firms), followed by Ho Chi Minh City (179 firms).
3. Basic information on the dataset
This section summarizes general information on our sample. The number of observations in the sample was 1,055. Figure 3.1 shows the years in which firms in our sample were established. As can be seen, the majority of firms in our dataset were established since 2001. Vietnam became a WTO member in 2007 and participation in the WTO brought FDI to Vietnam during this period (Pham, 2011). This increasing trend in investment is observed in our dataset.
Figure 3.1. Number of firms by year of establishment
0 100 200 300 400 500 600 700 800
Before
1960 1961 to
1970 1971 to
1980 1981 to
1990 1991 to
2000 2001 to 2012
7
Figure 3.2 shows the asset size and annual sales size. We asked for asset and annual sales as categorical ranges because some firms may be hesitant to give exact figures.
Sixty-four firms did not answer the asset size questions and 183 firms did not give answer to the annual sales question.
Figure 3.2. Number of firms by total assets and annual sales 7
Table 3.1. Distribution of firm employment size
Cumulative share Employment (%) (no. of workers)
25% 1~23
50% ~120
75% ~600
95% ~3000
100% ~16,175
Mean Std. Dev.
No. Obs.
630.4 1,407.1
978
The data covers both manufacturing and trade. Of 935 firms that gave answer to the question about firm’s activities, 383 firms are involved in manufacturing only (41%) and 392 firms conduct both manufacturing and commercial activities (42%). The remaining 160 firms (17%) are involved in the commercial sector only. Looking at the data by type of firm, FDI firms tend to have a larger number of employees (Table 3.2).
Table 3.2. Number of employees by type of firm
7 Asset size was reported in Vietnamese dong in the questionnaire. The dollar figures were calculated by using the exchange rate 21,000 VND per 1 USD which was the exchange rate in 2011.
0 50 100 150 200 250
<$47 $47 - $236 $236 -
$472
$472 -
$2,360
$2,360 -
$9,440
$9440 -
$24,000
$24,000 <
asset annual sales
(in 1,000s of USD)
8
Domestic Firm State-owned Firm FDI Firm All firms
No. % No. % No. % No. %
Less than 9 96 13.5 0 0 3 0.9 99 9.4
10~199 358 50.4 4 44.4 91 27.2 453 43
200~299 32 4.5 0 0 23 6.9 55 5.2
300~399 30 4.2 1 11.1 14 4.2 45 4.3
400~699 51 7.2 2 22.2 49 14.6 102 9.7
700~999 23 3.2 0 0 30 9 53 5
1,000~1,999 34 4.8 1 11.1 50 14.9 85 8.1
2,000~3,999 21 3 0 0 34 10.1 55 5.2
4,000~9,999 9 1.3 0 0 14 4.2 23 2.2
More than 10,000 4 0.6 0 0 4 1.2 8 0.8
No answer 52 7.3 1 11.1 23 6.9 76 7.2
Total 710 100 9 100 335 100 1054 100
Figure 3.3. Number of firms involved in manufacturing and commercial activities
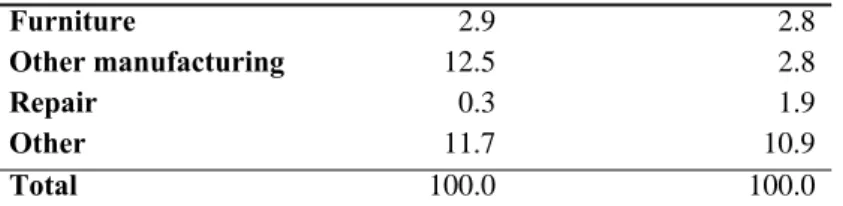
Figure 3.4 shows the industrial distribution of the firms in the sample. Table 3.3 compares the overall structure of industries in Vietnam according to GDP and the distribution of firms by industry in our sample. Reflecting the overall industrial structure in Vietnam, our sample shows labor-intensive industrial sectors such as food, textiles, and apparel as having higher shares. However, our data have a disproportionally larger share of firms in the apparel and wood manufacturing sectors compared with the overall industrial structure in Vietnam as captured by GDP statistics.
Figure 3.4. Number of firms by industry and firm type
383
160 392
Manufacturing Commerce Manufacturing &
Commerce
9
Table 3.3. Comparison of industry distribution in sample and overall economy in Vietnam
Sample
(% of firms) Overall economy (% of GDP)
Food 9.3 17.9
Beverage 0.7 1.6
Tobacco 0.5 0.8
Textile 4.4 4.1
Apparel 25.8 4.1
Leather 3.8 3.4
Wood 12.2 1.7
Paper 0.5 2
Printing 0.5 0.7
Petroleum products 0.3 3.7
Chemicals 0.9 4.5
Pharmaceutical 0.6 1.2
Rubber/Plastic 5.0 4.4
Non-metallic mineral 0.9 5.3
Basic metals 0.9 4
Fabricated metal 1.5 5.7
Computer/electronic 1.5 5.6
Electrical 2.1 3.3
Machinery 1.2 1
Motor vehicle 0.4 2.8
Other transport 0.4 3.8
0 50 100 150 200 250 300
Domestic firms State-owned firms FDI firms
10
Furniture 2.9 2.8
Other manufacturing 12.5 2.8
Repair 0.3 1.9
Other 11.7 10.9
Total 100.0 100.0
Source: General Statistics Office of Vietnam. Data downloaded on March 10, 2012, from http://www.gso.gov.vn/default_en.aspx?tabid=470.
Note: Other sectors, including mining, electricity and other services, are not directly comparable between the two data sources and have been excluded.
Among manufacturing firms, 54.8% are FDI firms. Among firms in the commercial sector and those involved in both manufacturing and commerce, the majority are domestic firms.
Table 3.4. Number of firm by firm type and activity
Manufacturing
only Commerce
only Manufacturing
and commerce All firms
No. % No. % No. % No. %
Domestic firms 171 44.6 155 96.9 314 80.3 640 69
State-own firms 2 0.5 2 1.3 4 1 8 1
FDI firms 210 54.8 3 1.9 73 18.7 286 31
Total 383 100 160 100 391 100 934 100
4. Structure of supply chains Customers and markets
In the questionnaire, we asked firms, “To whom does your firm sell products?
Please let us know your biggest customer.” Four customer categories were presented for selection: domestic firms, firms located abroad, domestic traders, and international traders. We are interested in knowing how supply chain linkages connect firms. A firm that sells products to other firms is considered to be an intermediate goods supplier belonging to a supply chain. Because a firm connecting to a supply chain can communicate with its customers, cooperation in quality management is easier. However, a firm that sells products to traders can be either a final good producer or an intermediate good producer, and the firm is not connected to a supply chain. Table 4.1 shows the main customers of the three types of firms. While domestic firms tend to sell to any of the four types of customers, foreign firms tend to supply products to other firms located abroad. It is also observed that FDI firms tend to have more foreign and international customers than local customers. When comparing sales to firms and to
11
traders, more FDI firms sell to firms than to traders. For domestic firms, traders play a more significant role in transactions.
Table 4.1. Type of customers by firm type
Customer type/
Firm type Local
traders International
traders Firms
abroad Domestic
firms All customers
Domestic firms 254 167 252 192 865
State-owned firms 5 4 7 5 21
FDI firms 25 66 161 43 295
Total 284 237 420 240 1181
Note: The number of observation is more than 1,055 as some firms checked multiple categories of customers.
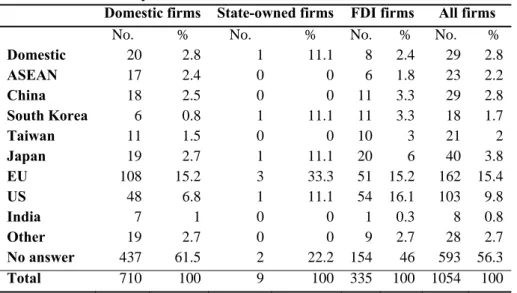
Table 4.2 shows the main markets for firms in our sample of Vietnamese firms.
Out of 461 respondents, the largest number of firms answered that the EU was their main market, followed by the United States. The EU and US markets are important to both domestic firms and FDI firms.
Table 4.2. Primary market of firms
Domestic firms State-owned firms FDI firms All firms
No. % No. % No. % No. %
Domestic 20 2.8 1 11.1 8 2.4 29 2.8
ASEAN 17 2.4 0 0 6 1.8 23 2.2
China 18 2.5 0 0 11 3.3 29 2.8
South Korea 6 0.8 1 11.1 11 3.3 18 1.7
Taiwan 11 1.5 0 0 10 3 21 2
Japan 19 2.7 1 11.1 20 6 40 3.8
EU 108 15.2 3 33.3 51 15.2 162 15.4
US 48 6.8 1 11.1 54 16.1 103 9.8
India 7 1 0 0 1 0.3 8 0.8
Other 19 2.7 0 0 9 2.7 28 2.7
No answer 437 61.5 2 22.2 154 46 593 56.3
Total 710 100 9 100 335 100 1054 100
According to Bui, et al. (2011), Vietnamese domestic electronic and information technology firms are predominantly small- and medium-scale firms, with small amounts of capital, and rather average levels of technology. Firms have various export products, but these are relatively low in quality. Thus, for these firms it is crucial to identify niche markets, specifically those that are not of interest to MNCs. This trend highlights the market segmentation that exists for different types of firms.
12
However, Bui, et al. (2011) discusses the fact that this situation is improving because of the close cooperation between Vietnamese firms and firms with foreign investment capital. In some cases, Vietnamese firms found partners to export their products, but did not have enough capital and technology. Thus, these firms referred their partners to FDI firms with sufficient resources. At the same time, FDI firms also shifted some of their partners and products to Vietnamese firms based on common benefits and aiming to increase export turnover in the electronics sector.
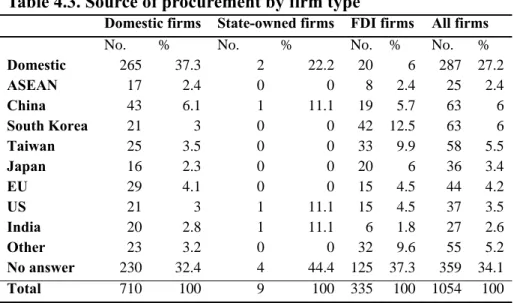
Procurement of raw materials
With regard to countries from which raw materials are sourced, 27% of firms procure materials domestically, with China, Korea, Taiwan, EU, and Japan the next most common sources, as shown in Table 4.3. When looking by firm type, 37% of domestic firms procure input materials domestically compared with only 6% of FDI firms. Instead, FDI firms in Vietnam procure materials overseas from countries such as South Korea, Taiwan, China, and Japan. Although the major destination markets for both domestic and FDI firms are the EU and the United States, the source countries for raw materials tend to differ between the two types of firms.
Table 4.3. Source of procurement by firm type
Domestic firms State-owned firms FDI firms All firms
No. % No. % No. % No. %
Domestic 265 37.3 2 22.2 20 6 287 27.2
ASEAN 17 2.4 0 0 8 2.4 25 2.4
China 43 6.1 1 11.1 19 5.7 63 6
South Korea 21 3 0 0 42 12.5 63 6
Taiwan 25 3.5 0 0 33 9.9 58 5.5
Japan 16 2.3 0 0 20 6 36 3.4
EU 29 4.1 0 0 15 4.5 44 4.2
US 21 3 1 11.1 15 4.5 37 3.5
India 20 2.8 1 11.1 6 1.8 27 2.6
Other 23 3.2 0 0 32 9.6 55 5.2
No answer 230 32.4 4 44.4 125 37.3 359 34.1
Total 710 100 9 100 335 100 1054 100
As discussed previously, the roles of GSCs in chemical management need to be examined. Therefore, in the questionnaire, firms were asked “Does your firm supply a
13
primary product to global supply chains (GSCs)?” On the survey, GSCs were defined as a chain of firms sourcing material from and selling products to multiple countries. As shown in Table 4.4, 29% of FDI firms and 16% of domestic firms answer that they are GSC participants.
Global supply chains
Table 4.4. Participation in global supply chains
Domestic firms State-owned firms FDI firms All firms
No. % No. % No. % No. %
GSC participant 112 15.8 1 11.1 97 29.0 210 19.9 GSC non-participant 374 52.7 3 33.3 167 49.9 544 51.6
No answer 224 31.5 5 55.6 71 21.2 300 28.5
Total 710 100.0 9 100.0 335 100.0 1054 100
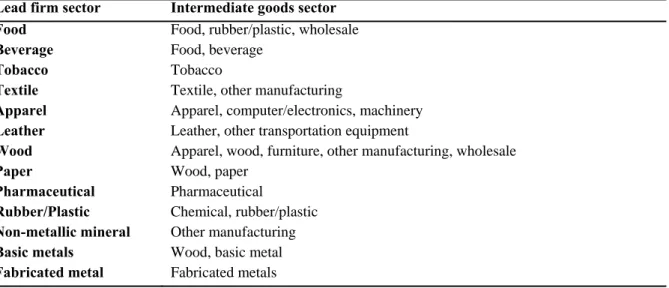
To see how supply chains are connected across industries, the questionnaire asked firms about the final product of their supply chains. For example, if a firm produces engines, a component in automobiles, and is categorized in the machinery industry, this firm is expected to give an answer of “motor vehicle” as the industry of its lead firm. Table 4.5 shows the industries of lead firms in supply chains in the left column and the industries of firms answering that their lead firms are described in the right column as intermediate good producers. For many sectors, the type of industry of lead firms is the same as those for intermediate producers. This implies that firms operate toward the downstream end of supply chains.
Table 4.5. Comparison of industry classifications of lead firms and intermediate good producers
Lead firm sector Intermediate goods sector Food Food, rubber/plastic, wholesale Beverage Food, beverage
Tobacco Tobacco
Textile Textile, other manufacturing
Apparel Apparel, computer/electronics, machinery Leather Leather, other transportation equipment
Wood Apparel, wood, furniture, other manufacturing, wholesale
Paper Wood, paper
Pharmaceutical Pharmaceutical
Rubber/Plastic Chemical, rubber/plastic Non-metallic mineral Other manufacturing Basic metals Wood, basic metal Fabricated metal Fabricated metals
14 Computer/electronic Computer/electronic Electrical Electrical, machinery Machinery Apparel
Motor vehicle Motor vehicle
Furniture Fabricated metal, motor, furniture
Other Manufacturing Leather, printing, wood, non-metal, basic metal, machinery, other manufacturing
5. Chemical management in Vietnamese firms
Question 1: Impacts of chemical PRERs on firms: How are firms affected by regulations/requirements for chemicals in products?
To answer how firms are affected by chemical regulations and requirements, firms were asked, “Have you ever needed or been asked to take measures about chemicals substances in your product since 2000?” in the questionnaire.
As shown in Table 5.1, 43.1% of firms have perceived the need to conduct chemical management. Looking at firms by type, 48.1% of FDI firms responded that chemical management was required, a higher share than for domestic firms. Looking at firms by industry, all firms in the petroleum products sector responded that they needed to conducted chemical management. The next highest industry was the chemicals sector.
Contrary to our expectations, only 14% of computer/electronics firms answered that they needed to take measures to manage the use of chemicals in their products.
The same question was asked in the survey of Malaysian firms. More than 80%
of firms in the computer/electronics sector answered they took chemical management measures (Michida, et al. 2014b). Across the all industries, the percentage of firms in Vietnam taking chemical management measures was much lower than for the corresponding category in Malaysia. Two reasons can help explain these results. First, fewer firms in Vietnam actually face the need to conduct chemicals management.
However, as described in Section 4, many Vietnamese firms supply their products to EU markets. Thus, it is unlikely that these firms are not required to conduct any chemical management. Second, as Baldwin (2011) suggests about supply chain structures in Asia, firms in Vietnam are more involved in assembling activities on the downstream end of supply chains and chemical management is not as necessary for these activities as all the prior processed involving chemicals have been completed before reaching firms in Vietnam in the form of parts or components.
Table 5.1. Chemical regulation measures by firm type
15
No Yes Total
No. % No. % No. % Domestic Firm 365 59.5 248 40.5 613 100 State-owned Firm 4 44.4 5 55.6 9 100 FDI Firm 153 51.9 142 48.1 295 100 All Firms 522 56.9 395 43.1 917
Figure 5.1. Chemical regulation measures by industry (%)
Note: The figure in parenthesis is the number of samples for each industry.
When a firm fails to meet customer requirements on chemicals, it may result in the rejection of products by customers.8 Table 5.2 shows the number of rejections
8 In the questionnaire, firms were asked, “Have your products been rejected by your customers because of chemical substances in products?”
0 10 20 30 40 50 60 70 80 90 100
Petroleum products (3) Chemicals(9) Motor vehicles (4) Food (93) Paper (5) Leather (38) Tobacco (5) Other manufacturing (125) Textile (44) Apparel (257) Wholesale trade (6) Wood (122) Rubber/plastic (50) Beverage (7) Printing (5) Pharmaceutical (6) Machinery (12) Electrical (21) Furniture (29) Retail trad (except motor vehicles) (6) Other (92) Fabricated metal (15) Non-metalic mineral (9) Basic metals (9) Computer/electronic (15) Other transportation (4) Repair (3) Motor vehicle trade (2)
16
across the three types of firms. Out of 552 firms providing a response, 54 firms (9.8%) reported having products rejected by customers because of chemicals in products. When looking at the figures for domestic and FDI firms, 14.2% of FDI firms experienced rejection compared with 3.7% of domestic firms. Although samples differ between the Malaysian and Vietnamese surveys, the results are comparable with a rejection rate of 9.2% for all firms in Malaysia and FDI firms facing higher rejection rates (See Figure 5.1 for the rejection rates across industries). In fact, the rejection rates for both domestic firms and FDI firms are higher in the survey in Malaysia (Michida, et al. 2014b).
Table 5.2. Number and percentage of firms experiencing rejections due to chemicals in product
Domestic firms State-owned firms FDI firms All firms
No. % No. % No. % No. %
No 336 92.8 5 71.4 157 85.8 498 90.2
Yes 26 3.7 2 28.6 26 14.2 54 9.8
Total 362 100 7 100.0 183 100.0 552 100.0
Table 5.3 shows the percentage of firms reporting customer rejection by industry. Firms in the machinery and electrical industries face the highest rejection rates, at 37.5% and 30%, respectively. These industries are followed by the textile (17.4%), leather (12.5%), and rubber/plastic (10.3%) industries in terms of highest percent of product rejections.
Table 5.3. Number of rejections by industry
Yes No Total %
Yes
Food 9 53 62 14.5
Beverage 0 2 2 0.0
Tobacco 1 0 1 100.0
Textile 4 19 23 17.4
Apparel 13 131 144 9.0
Leather 3 21 24 12.5
Wood 4 66 70 5.7
Paper 0 3 3 0.0
Printing 0 3 3 0.0
Petroleum products 0 2 2 0.0
Chemicals 0 7 7 0.0
Pharmaceutical 0 2 2 0.0
Rubber/plastic 3 26 29 10.3
Non-metallic mineral 0 5 5 0.0
Basic metals 0 4 4 0.0
Fabricated metal 0 8 8 0.0
17
Computer/electronic 0 4 4 0.0
Electrical 3 7 10 30.0
Machinery 3 5 8 37.5
Motor vehicle 0 2 2 0.0
Other transport 0 3 3 0.0
Furniture 0 14 14 0.0
Other manufacturing 6 48 54 11.1
Repair 0 1 1 0.0
Trade of motor vehicles 0 1 1 0.0
Wholesale trade 1 4 5 20.0
Retail trade (except motor vehicles) 0 3 3 0.0
Other 1 33 34 2.9
Total 54 498 552 9.8
Question 2: Material Procurement: How do firms optimize their behavior with regard to purchasing materials?
As shown in Table 5.4, 24.3% of firms changed input materials to meet regulations or the requirements of customers. For comparison, in the Malaysian survey, 43.9% of firms responded that they had changed input materials.
Table 5.4. Firms changing input materials to adapt to regulation Domestic firms State-owned firms FDI firms All firms
No. % No. % No. % No. %
Yes 87 31.8 1 20.0 30 14.5 118 24.3
No 187 68.2 3 60.0 98 47.3 288 59.3
Total 274 100.0 5 100.0 207 100.0 486 100.0
Changing raw materials is one strategy for meeting regulations because using compliant chemicals is a key way of adapting to regulations. However, finding suitable substitutes is not always easy. Table 5.5 shows that 19.2% of firms responded that they faced difficulty in procuring inputs to meet chemical regulations and requirements.
Table 5.5. Difficulty procuring substitute inputs
Domestic firms State-owned firms FDI firms All firms
No. % No. % No. % No. %
Difficult 48 20.1 0 0.0 13 17.1 61 19.2 Not difficult 191 79.9 2 100.0 63 82.9 256 80.8
Total 239 100 2 100 76 100 317 100
For firms that are eager to confirm their suppliers’ compliance with chemical
18
regulations and requirements, specifying or making recommendations about input materials is one way to control chemicals in the products used by suppliers. Customer requests and recommendations that a supplier choose certain input materials are an indicator of the level of control for chemicals in products. We asked firms about the type of requests and specifications from customers in different countries in terms of the selection of input materials. As shown in Table 5.6, depending on customers’ country of origin, the degree of specification of raw materials differs. For firms with customers in the EU, 39.2% reported that customers from the EU requested the use of specified materials. For other countries, this was followed by 34.4% of firms with Japanese customers and 32.6% of firms with US customers specified input materials. A similar trend was also observed in the Malaysian survey.
Table 5.6. Specification of input materials by customer country of origin and firm type
Domestic firms State-owned
firms FDI
firms All
firms
Domestic market No. % No. % No. % No. %
Specify materials 53 22.0 0 0 13 20.6 66 21.7
Recommend materials 19 7.9 0 0 5 7.9 24 7.9
Did not specify/recommend 169 70.1 0 0 45 71.4 214 70.4
Total 241 100.0 0 100 63 100.0 304 100.0
ASEAN No. % No. % No. % No. %
Specify materials 17 19.5 0 0.0 7 17.9 24 18.9
Recommend materials 1 1.1 0 0.0 3 7.7 4 3.1
Did not specify/recommend 69 79.3 1 100.0 29 74.4 99 78.0
Total 87 100.0 1 100.0 39 100.0 127 100.0
China No. % No. % No. % No. %
Specify materials 23 21.7 1 50.0 20 33.9 44 26.3
Recommend materials 9 8.5 0 0.0 8 13.6 17 10.2
Did not specify/recommend 74 69.8 1 50.0 31 52.5 106 63.5
Total 106 100.0 2 100.0 59 100.0 167 100.0
Korea No. % No. % No. % No. %
Specify materials 23 22.8 0 0.0 15 26.3 38 24.1 Recommend materials 11 10.9 0 0.0 7 12.3 18 11.4 Did not specify/recommend 67 66.3 0 0.0 35 61.4 102 64.6
Total 101 100.0 0 0.0 57 100.0 158 100.0
Taiwan No. % No. % No. % No. %
Specify materials 12 14.3 1 100.0 13 28.3 26 19.8
Recommend materials 3 3.6 0 0.0 7 15.2 10 7.6
Did not specify/recommend 69 82.1 0 0.0 26 56.5 95 72.5
19
Total 84 100.0 1 100.0 46 100.0 131 100.0
Japan No. % No. % No. % No. %
Specify materials 32 30.5 1 50.0 20 42.6 53 34.4
Recommend materials 7 6.7 1 50.0 4 8.5 12 7.8
Did not specify/recommend 66 62.9 0 0.0 23 48.9 89 57.8
Total 105 100.0 2 100.0 47 100.0 154 100.0
EU No. % No. % No. % No. %
Specify materials 53 37.3 0 0.0 29 43.9 82 39.2 Recommend materials 15 10.6 1 100.0 9 13.6 25 12.0 Did not specify/recommend 74 52.1 0 0.0 28 42.4 102 48.8
Total 142 100.0 1 100.0 66 100.0 209 100.0
US No. % No. % No. % No. %
Specify materials 36 30.3 0 0.0 21 37.5 57 32.6 Recommend materials 15 12.6 0 0.0 8 14.3 23 13.1 Did not specify/recommend 68 57.1 0 0.0 27 48.2 95 54.3
Total 119 100.0 0 0.0 56 100.0 175 100.0
India No. % No. % No. % No. %
Specify materials 7 9.7 2 100.0 1 4.5 10 10.4
Recommend materials 2 2.8 0 0.0 3 13.6 5 5.2
Did not specify/recommend 63 87.5 0 0.0 18 81.8 81 84.4
Total 72 100.0 2 100.0 22 100.0 96 100.0
Question 3: Market diversification: Do firms change their destination markets due to stricter regulations implemented in their previous export markets?
One concern raised in regard to PRERs has been that such regulations could act as TBT for exporters. This concern in regards to firms in Asia has not been examined statistically to date. Therefore, in the questionnaire, we asked whether or not firms had changed their markets because of chemical regulations for products. To examine this research question, firms were asked, “Have you changed export markets because of chemical regulations or requirements?” As shown in Table 5.7, 4.0% of firms answered that they had changed their target market. In terms of firm type, 5.2% of domestic firms changed markets because of PRERs, compared with 2.1% of FDI firms. In the Malaysian survey, the share of all firms that changed their destination markets is also around 4%.
Table 5.7. Firms changing export market because of PRERs
Domestic firms State-owned firms FDI firms All firms
20
No. % No. % No. % No. %
No 362 94.8 6 100.0 235 97.9 603 96.0
Yes 20 5.2 0 0.0 5 2.1 25 4.0
Total 382 100.0 6 100.0 240 100.0 628 100.0
Question 4: Implication on supply chains: What are the implications of switching markets on the environment and health in developing countries?
Although changing target markets was not a prevalent strategy for adapting to PRERs, changing input materials was done by a significant number of firms. Moreover, as shown in Table 5.8, 51.4% of firms responded that they changed the types of chemicals used in products depending on the destination market. The same tendency is also observed in Malaysia. The implication is that products with compliant chemicals are sent to regulated markets, whereas noncompliant products are sent to less regulated markets. This trend could result in the creation of pollution havens in countries where proper regulation has not yet been implemented.
Table 5.8. Firms changing chemicals in products for different markets by firm type
Domestic firms State-owned firms FDI firms All firms
No. % No. % No. % No. %
No 81 47.4 0 0.0 39 54.2 120 48.6 Yes 90 52.6 4 100.0 33 45.8 127 51.4 Total 171 100.0 4 100.0 72 100.0 247 100.0
Question 5: Measures taken by firms: What did firms do to adapt to PRERs? What were the motivations for firms to take these measures?
The most common measures taken by firms to comply with PRERs are sending products for testing, followed by changing production processes (Table 5.9).
Table 5.9: Measures taken to adapt to regulations
Domestic firms State-owned
firms FDI firms Total
No. % No. % No. % No. %
Change production processes 41 25.8 0 0 8 11 49 21 Invest in new production, equipment,
facility, or physical plant 22 13.8 0 0 9 12.3 31 13.3 Invest in in-house testing/lab facility 16 10.1 0 0 16 21.9 32 13.7 Send products for testing 43 27 1 100 21 28.8 65 27.9
Change inputs 20 12.6 0 0 8 11 28 12
Change product design 2 1.3 0 0 0 0 2 0.9
21
Obtain certification/labels/logos 2 1.3 0 0 1 1.4 3 1.3 Use external private consulting service 1 0.6 0 0 1 1.4 2 0.9 Use external technical assistance 3 1.9 0 0 1 1.4 4 1.7 Increase the number of technical workers 3 1.9 0 0 0 0 3 1.3
Increase R&D investment 6 3.8 0 0 8 11 14 6
Total 159 100 1 100 73 100 233 100
Table 5.10 shows the key motivating factors for firms to adapt to chemical PRERs. Most firms answered that they adapted to avoid the rejection of products by their customers. The next most common response was seeking full compliance with domestic regulations and requirements. Adaptation to regulations is not seen by firms as a source of competitiveness or improved brand image. Instead, compliance is seen as a mandatory action for firms to keep the business of their customers.
Table 5.10. Firms’ reasons for compliance with regulation
Domestic firms State-owned
firms FDI firms All firms
No. % No. % No. % No. %
Avoid customer rejection 100 43.5 1 20 38 37.3 139 41.2 Maintain current business
relationships 13 5.7 0 0 5 4.9 18 5.3
Develop new business relationship 8 3.5 1 20 1 1 10 3
Improve brand image 10 4.3 0 0 10 9.8 20 5.9
Attain higher sales price 3 1.3 0 0 1 1 4 1.2
Increase export 29 12.6 1 20 10 9.8 40 11.9
Increase domestic sales 15 6.5 1 20 2 2 18 5.3
Comply fully with domestic
regulation/requirements 48 20.9 1 20 35 34.3 84 24.9
Other 4 1.7 0 0 0 0 4 1.2
Total 230 100 5 100 102 100 337 100
Question 6: Business implications: What were the implications for business from adapting to PRERs?
Does adaptation to chemical regulations and requirements improve firms’
competitiveness? We asked firms meeting regulations and requirements whether their exports have increased, decreased or unchanged. Overall, 65.7% of firms responded that compliance did not change their exports. This shows that compliance with regulations offers only the opportunity to export to regulated markets by meeting the minimum requirements. Also, some firms experienced a decrease in exports after regulatory compliance. As compliance with regulations can involve an increase in costs, it may reduce the price competitiveness of firms in some situations.