Damping effect by contacting a piezoelectric element on an object in perpendicular direction of vibration
Abstract
This study demonstrates a novel method for vibration damping using a piezoelectric element. A piezoelectric transducer excited by ultrasonic vibrations is placed in contact with a vibrating object in a direction perpendicular to the vibration. In conventional methods, piezoelectric elements attached to vibrating objects are excited in the same direction as the vibration direction of the object. Such methods require complicated control and measurements for maintaining the vibration of the transducer in the phase opposite to the object’s vibration, to exert the damping effect. In contrast, the proposed method does not require adjustment of the transducer’s vibration phase according to the object because this method manipulates a friction loss between the transducer and a vibrating object for damping. This study confirmed a damping effect with the proposed method by conducting hammering tests on a cantilever. Furthermore, the parameters influencing the damping effect and the damping principle were considered. The damping ratio obtained from these tests was approximately 10 times the value when a non-excited transducer was statically pressed to the cantilever.
Moreover, the test results suggested that the magnitude of the damping effect could be estimated by measuring the current flowing in the transducer, and that an optimal current to achieve the highest damping effect exists.
The damping effect by the proposed method is considered to be triggered with a slip between the transducer and a vibrating object by suppressing the transverse oscillation of the transducer using the inertia effect caused by the transducer’s excitation. Furthermore, the increase of the impact force applied to the object by the excitation improves the damping effect. By measuring the stress waves in a long bar based on the one-dimensional elastic wave propagation theory, the impact force caused by the excited transducer was measured. The impact force had a peak at a specific current and changed with the same tendency as the damping ratio. The results suggested that both suppressing the transducer’s transverse oscillation and increasing the impact force cause the high damping effect by using the proposed method.
Keywords: Vibration damping, Piezoelectric transducer, Damping effect, Hammering test, Impact force
1. Introduction
Mechanical vibrations, such as the chatter vibration of machine tools and the residual vibration of robots, significantly affect the production accuracy and efficiency. Therefore, various vibration-damping methods have been investigated. In recent years, vibration-damping methods using piezoelectric elements have been attracting attention, because they are more compact in comparison to ordinary mechanical devices such as dynamic vibration absorbers.
Yusuke UENO*, Masahiro HIGUCHI**, Hiroshi TACHIYA**, Masahiro TAKANO*** and Yoshiki KINOSHITA*
*Graduate School of Natural Science and Technology, Division of Mechanical Science and Engineering Kakuma-machi, Kanazawa-shi, Ishikawa 920-1192, Japan
**Faculty of Frontier Engineering, Institute of Science and Technology, Kanazawa University Kakuma-machi, Kanazawa-shi, Ishikawa 920-1192, Japan
E-mail: [email protected]
***Industrial Research Institute of Ishikawa
2–1 Kuratsuki, Kanazawa-shi, Ishikawa 920-8203, Japan
Received: 27 June 2019; Revised: 1 November 2019; Accepted: 26 November 2019
There are two primary vibration damping methods using piezoelectric elements: passive damping and active damping. Passive damping is a method of attaching a piezoelectric element to a vibrating object and then converting the vibration energy into electrical energy by utilizing the piezoelectric effect (Berardengo et al., 2017; Park, 2003;
Sales et al., 2013). These methods do not always exert a significant vibration damping effect, although the elements are appropriately designed according to the object to be damped. On the other hand, active damping is a method of applying a controlled voltage to a piezoelectric element, and applying vibrations opposite in phase to the vibration of the object by utilizing the inverse piezoelectric effect (Abdeljaber et al., 2016; Bruant et al., 2010; Goncalves et al., 2017; Hu, 2009; Kermani et al., 2004; Lin and Zheng, 2012; Sabatini et al., 2012; Sun et al., 2004). Although this method has a more pronounced effect in terms of vibration damping, it requires complicated control to generate opposite phase vibrations. Recently, Omidi and Mahmoodi (2016) proposed a robust method which can suppress the vibration even if the observer could not successfully estimate the vibrational behavior, by devising an electrical circuit controlling the piezoelectric elements. Moreover, hybrid methods that combine passive and active methods (Matsubara et al., 2014; Yamada et al., 2014), have been investigated. The investigated methods could suppress vibration stability by a passive damping method, and simultaneously provide a highly effective suppression of the vibration by application of an active damping method. However, these methods required the installation of measurement instruments on the object and the use of advanced feedback control.
The methods described above press the excited piezoelectric elements to the objects so that the directions of vibrations agree. Conversely, a high damping effect caused by bringing the piezoelectric transducer excited by the ultrasonic vibration in contact with an object in a direction perpendicular to the vibration of the object was confirmed.
Because the proposed method uses a friction loss between the piezoelectric transducer and the vibrating object for damping, it does not require a complicated control as needed in the active damping mentioned above. Furthermore, it can exert a higher effect than the passive damping. Thus, the present method can become a new application of the piezoelectric elements to suppress vibration.
Therefore, as a fundamental study, the parameters influencing the damping effect and the mechanical principle for causing the damping effect are clarified by the proposed method. By using a piezoelectric transducer designed for an ultrasonic linear motor (Takano et al., 2011), the damping effect of the proposed method is confirmed by conducting simple hammering tests with a cantilever. The damping effect by the proposed method is influenced by the contact conditions. Therefore, to determine the conditions for achieving the highest damping effect, the parameters influencing the damping effect are verified by changing the contact conditions, such as the displacement of the statically pressed transducer and the applied voltage for excitation of the transducer. Moreover, to discuss the principle of the proposed method in detail, the impact forces applied by exciting the transducer, placed in contact with an object under a certain static force are measured. The methods for measuring the static force generated by pressing the transducer statically against the object and the impact force generated by excitation of the transducer are investigated. Furthermore, from the relation between the impact force and the damping effect, the validity of the presented principles has been verified.
2. Method for Vibration Damping with Piezoelectric Transducer
2.1 Casing Device Holding Piezoelectric Transducer and Driving Method
Figure 1 shows the casing device holding the piezoelectric transducer used in this study. Figure 1(a) shows its detailed structure and Fig. 1(b) shows a photo of the fabricated device. As shown in Fig. 1(a), this transducer has a 24-layer piezoelectric rectangular plate with a length of 30 mm, a width of 8.4 mm, and a thickness of approximately 4 mm. The thickness of each layer is 160 μm. Furthermore, two electrodes were attached to both the side surfaces of the transducer. Alternating current (AC) voltage was applied to the transducer to induce ultrasonic vibrations: the first mode in the longitudinal direction and the second mode in the transverse direction. This study uses the first longitudinal vibration to damp vibration of an object. The friction head for contacting with the object was made of Alumina and was attached to the tip of the transducer. The transducer was held to the case with leaf springs as shown in Fig. 1(a), and the friction head was pressed to the object stably by using the elastic deformation of the leaf springs as static preloading.
The piezoelectric transducer was driven as follows. First, the non-excited transducer was brought in contact with
the object under static preload. The AC voltage was then applied to the transducer, and its frequency was adjusted to
induce ultrasonic vibration. When the applied frequency of the AC voltage approached the resonance frequency of the
transducer that is placed in contact with the object, the amplitude velocity increased and reached its maximum at the
resonance point.
(a) Detail structure of the transducer and casing device (b) Photo of the fabricated device Fig. 1 Casing device holding the piezoelectric transducer
2.2 Vibration Damping Method
As described in the previous section, in the vibration damping method proposed in this study, the non-excited transducer was first statically pressed to the object to be damped, in a direction perpendicular to the vibration. Then, the ultrasonic vibration of the transducer was excited by applying an AC voltage, making it possible to damp the residual vibration of the object rapidly. As described in Section 1, because the proposed method manipulates a friction loss between the transducer and the object, it does not require any complicated control or analysis and detailed measurement of the vibration behavior of the objects to be damped.
3. Confirmation of Damping Effect with the Proposed Method 3.1 Experimental Apparatus
Figures 2 and 3 show the schematic and photo of the experimental apparatus, respectively. The hammering tests used a cantilever made of aluminum alloy (A5052) as the object to be damped. To measure the acceleration in the
Y-axis of the cantilever, an accelerometer (SHOWA SOKKI, MODEL-2462) was mounted on the cantilever at aposition 15 mm from its top. The bottom of the aluminum plate was sandwiched with stainless steel plates and bolted.
The cantilever had a height of 170 mm, a width of 50 mm, and a thickness of 5 mm. The theoretical first and second natural resonance frequencies of the cantilever were 143 Hz and 899 Hz, respectively. The 2-mm-thick alumina plate was attached to the side surface of the cantilever. The friction head of the transducer was placed in contact with the alumina plate on the one side of the cantilever as shown in Fig. 2. The contacting point was 5 mm from the top of the cantilever. As shown in Fig. 3, the casing device with the piezoelectric transducer is mounted onto the slider. The slider can adjust the position of the device in units of 10 μm along the direction of the
X, Y, and Z-axes, respectively. Thetransducer was connected to a signal generator to allow adjustment of the amplitude and frequency of the applied AC voltage. The free vibration of the cantilever was induced with an impulse hammer (DYTRAN INSTRUMENTS, MODEL 5850A) that can measure the impact load. The impact point was 30 mm from the bottom of the cantilever.
Fig. 2 Schematic of the experimental apparatus Fig. 3 Photo of experimental apparatus
Lamination
Piezoelectric rectangular plate
t0.16 30mm 8.4mm
Insulator plate
Case
Leaf spring
Transducer Friction head
Electrodes 4mm
Leaf spring
Case Friction
head Transducer
10mm
Friction head
× Alumina
plate
Vibration damping object (Cantilever) Piezoelectric transducer
in casing device
Y Z
× X
50 25
Hammering point Contacting point
30
×
170
5 5
Y Z
×X
15 Accelerometer
Vibration damping object (Cantilever)
X
Y Z
Piezoelectric transducer in casing device
Slider
3.2 Experimental Procedure for Confirmation of the Damping Effect
First, the friction head of the transducer was placed in contact with the side of the cantilever under static preloading in the X-axis by adjusting the position of the casing device mounted onto the slider along the direction of the
X-axis.Here, the displacement of the casing device from an origin point where the friction head of the transducer contacts with the surface of the cantilever was defined as the static pressing displacement x
st. The x
stwill correlate with the amount of preloading of the transducer to the cantilever. Next, the AC voltage
V with a specified amplitude was applied to thetransducer, and the ultrasonic vibration was excited by approximating the frequency in the vicinity of the resonance frequency. In this test, the resonance frequency of the transducer is the frequency where the current flowing in it is maximized when the transducer is in contact with the object.
Then, the free vibration of the cantilever was induced with an impulse hammer. The hammering tests were conducted with varying static pressing displacements x
stand applied voltages V described in Table 1. At each condition, the hammering tests were conducted 3 times, and the transducer frequency was adjusted to the resonance frequency of the transducer, where the current flowing in the transducer is maximized as described above.
Table 1 lists the measured resonance frequencies of the transducer in the hammering tests for the applied AC voltage and the static pressing displacement. The condition of
V = 0 V for each static pressing displacement xstrepresents the non-vibrating state of the transducer.
For comparison, the hammering tests on the cantilever were performed without contacting the transducer.
Furthermore, the structure of the vibrating object or the contact state between the object and the transducer change the resonance frequency of the transducer that is in contact with the object. In this case, the transducer frequency deviates from its resonance frequency and the damping effect by the proposed method may change. Thus, to investigate the influence of the frequency of the transducer on the damping effect, hammering tests that intentionally shifted the transducer frequency from the resonance frequency shown in Table 1 were also performed. These tests were conducted under several frequencies for V = 1 V and 2 V at x
st= 0.01 mm. Table 2 shows the range of the frequencies shifted from the resonance frequencies of the transducer at each condition; the value in parentheses is the original resonance frequency.
In the tests, the accelerance obtained by dividing the acceleration by the peak of the impact load was evaluated.
Table 1 Resonance frequency of the transducer at each condition in hammering tests Unit: kHz
Applied AC voltage V [V]
Static pressing displacement x
st[mm]
0.01 0.05 0.1 0.2 0.3
0 0.0 0.0 0.0 0.0 0.0
1 53.6 54.7
2 53.4 54.2 54.7 55.3 55.4
3 53.1 54.2
4 53.1 54.0 54.4 54.9 55.1
5 52.8 53.5
6 52.8 53.4 54.1 54.6 54.9
7 53.1
8 52.9 53.4 54.4 54.6
Table 2 Frequencies shifted from resonance frequencies of the transducer Unit: kHz
Applied AC voltage V [V]
Static pressing displacement x
st[mm]
0.01
1 54.1 – 54.3 (Resonance frequency: 53.6)
2 53.5 – 54.1 (Resonance frequency: 53.4)
3.3 Experimental Results of Confirmation of Damping Effect
Typical examples of accelerance changing with time obtained from the hammering tests under the resonance frequencies are shown in Fig. 4. Figure 4(a) shows free vibration of the cantilever when the transducer was not in contact. Figures 4(b), (c) and (d) show results at V = 0 V, 6 V, and 8 V when x
st= 0.05 mm. Figures 4(e), (f) and (g) show results at V = 0 V, 6 V, and 8 V when x
st= 0.1 mm. Figures 4(h) and (i) show results at V = 0 V, and 8 V, when x
st= 0.2 mm. In the case of the AC voltage V = 0 V, the transducer is not being vibrated.
As shown in Figs. 4(b), (e) and (h), the accelerance changing with time under the non-vibrating conditions did not markedly change in comparison to the non-contact condition shown in Fig. 4(a). Thus, this result suggests that the damping effect could not be sufficiently exerted only by statically pressing of the non-excited transducer to the vibrating object. In contrast, under the conditions of V = 6 V or 8 V at x
st= 0.05 mm, and V = 8 V at x
st= 0.1 mm, the accelerance converged rapidly in comparison to the non-vibrating conditions (V = 0 V), as shown in Figs. 4(c), (d) and (g). The condition of x
st= 0.01 mm shows a similar tendency in the range of V larger than 1 V. Moreover, as shown in Figs. 4(f) and (i), when V = 6 V at x
st= 0.1 mm, and V = 8 V at x
st= 0.2 mm, the maximum amplitude of the accelerance decreased in comparison to the non-vibrating condition.
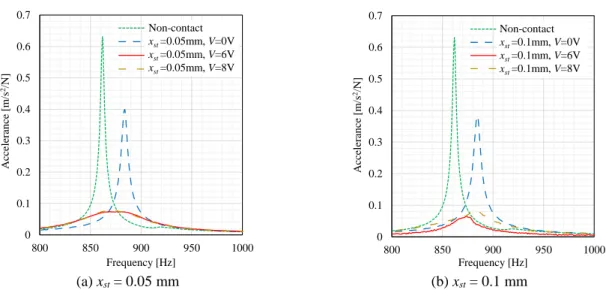
Furthermore, the power spectrum diagrams obtained by the Fast Fourier Transform from the change in the accelerance with time are shown in Fig. 5. As shown in Figs. 5(a) and (b), when x
st= 0.05 mm and 0.1 mm, the peak value of the power spectrum decreased remarkably under the excitation state of the transducer, in comparison to each non-excitation condition. However, the peak values were insensitive to the changes of the applied voltage. Furthermore, the natural frequencies of the cantilever under the vibrating conditions (V = 6 V and 8 V) decreased in comparison to those of the non-vibrating conditions. Additionally, from Fig. 5(b), the spectrums for
xst= 0.1 mm show a sharper tendency in comparison to those for x
st= 0.05 mm under similar applied voltages.
From the above results, the damping effect of the proposed method was confirmed for the cantilever made of aluminum alloy (A5052) under the test conditions.
(a) Non-contact (b) x
st= 0.05 mm,
V = 0 V (non-vibrating)(c) x
st= 0.05 mm,
V = 6 V(d) x
st= 0.05 mm,
V = 8 V(e) x
st= 0.1 mm,
V = 0 V (non-vibrating)(f) x
st= 0.1 mm,
V = 6 V(g) x
st= 0.1 mm,
V = 8 V(h) x
st= 0.2 mm,
V = 0 V (non-vibrating)(i) x
st= 0.2 mm,
V = 8 VFig. 4 Change of the accelerance with time under each resonance frequency
-10 -5 0 5 10
0 20 40 60 80
Accelerance[m/s2/N]
Time [ms]
-10 -5 0 5 10
0 20 40 60 80
Accelerance[m/s2/N]
Time [ms]
-10 -5 0 5 10
0 20 40 60 80
Accelerance[m/s2/N]
Time [ms]
-10 -5 0 5 10
0 20 40 60 80
Accelerance[m/s2/N]
Time [ms]
-10 -5 0 5 10
0 20 40 60 80
Accelerance[m/s2/N]
Time [ms]
-10 -5 0 5 10
0 20 40 60 80
Accelerance[m/s2/N]
Time[ms]
-10 -5 0 5 10
0 20 40 60 80
Accelerance[m/s2/N]
Time [ms]
-10 -5 0 5 10
0 20 40 60 80
Accelerance[m/s2/N]
Time [ms]
-10 -5 0 5 10
0 20 40 60 80
Accelerance[m/s2/N]
Time [ms]
(a) x
st= 0.05 mm (b) x
st= 0.1 mm Fig. 5 Power spectrum diagram at each resonance frequency 4. Effects of Contact Condition of the Transducer
4.1 Condition of Transducer Contact with a Vibrating Object
The previous section confirms the occurrence of the damping effect with the proposed method by using the cantilever as an object to be damped. The damping effect is caused by bringing the excited transducer in contact with a vibrating object. Hence, the damping effect is influenced by the friction condition at the contact surface between the transducer and the object. The friction condition should be influenced by the contact conditions of the transducer, the static pressing displacement of the casing device that holds the transducer, and the applied voltage ordinarily used for driving a piezoelectric transducer. This chapter investigates the influence of the contact conditions and discusses the principle of damping effect of the proposed method.
4.2 Influence of Static Pressing Displacement and Applied Voltage on the Damping Effect
From the accelerance data obtained by the hammering tests in Section 3.2, the relationship between static pressing displacement, applied AC voltage, and damping ratio was investigated. By using the half-power bandwidth method (Papagiannopoulos and Hatzigeorgiou, 2011), the damping ratio
ζwas calculated from the power spectrum diagram shown in Fig. 5. The damping ratio, ζ, is given by
2 1
2
rf f
f (1)
where f
ris the resonance frequency of the transducer, and f
1and f
2are the half-power frequency points.
Figure 6 shows the relationship between the damping ratio and the applied voltage for each static pressing displacement. The standard deviation is denoted by
σ. The green dashed line shows the damping ratio under thecondition that the transducer does not contact with the cantilever. The red dashed line shows the average value of the damping ratios under the static pressing. The damping ratio is almost constant with variation in the static pressing displacement. In addition, the figure shows the damping ratios obtained by shifting the transducer frequency from the resonance frequency, under V = 1 V and 2 V at x
st= 0.01 mm, as shown in Table 2. As shown in Fig. 6, the damping ratio was approximately 0.38 % under all static pressing displacements when the transducer in non-excited state was statically pressed to the cantilever. This value was almost equivalent to the damping ratio when the transducer was not in contact with the cantilever. Therefore, the damping effect does not occur only by statically pressing the transducer to the cantilever. As shown in Fig. 6, at x
st= 0.05 mm (red triangle symbol), the damping ratio increased with an increase in the applied voltage V, showing a peak of approximately 3.4 % at V = 7 V, and decreasing in the range above 7 V.
This peak value was similar to 10 times the damping ratio when the transducer statically presses to the cantilever. At x
st= 0.1 mm (green lozenge symbol), the damping ratio increased gradually up to V = 8 V. Contrarily, at x
st= 0.2 (yellow square symbol) and
xst= 0.3 mm (purple cross symbol), the damping ratios did not increase even when the applied voltage V was increased. Furthermore, at x
st= 0.01 mm (blue circle symbol), the damping ratio remarkably increased at
0 0.1 0.2 0.3 0.4 0.5 0.6 0.7
800 850 900 950 1000
Accelerance[m/s2/N]
Frequency [Hz]
Non-contact xst=0.05mm,V=0V xst=0.05mm,V=6V xst=0.05mm,V=8V Non-contact xst=0.05mm, V=0V xst=0.05mm, V=6V xst=0.05mm, V=8V
0 0.1 0.2 0.3 0.4 0.5 0.6 0.7
800 850 900 950 1000
Accelerance[m/s2/N]
Frequency [Hz]
Non-contact xst=0.1mm,V=0V xst=0.1mm,V=6V xst=0.1mm,V=8V Non-contact xst=0.1mm, V=0V xst=0.1mm, V=6V xst=0.1mm, V=8V
V = 1 V, and tended to decrease above V
= 1 V. Furthermore, the damping ratio started to increase at a low applied voltage as the static pressing displacement decreased.
Additionally, as described in Section 3.2, under
V = 1 V and 2 V at xst= 0.01 mm, the hammering test was conducted by shifting the transducer frequency from the resonance frequency, as shown in Table 2. The results are shown in Fig. 6 with blue outlined circles. The damping ratio varied with a change in the transducer frequency from the resonance frequency at the same applied voltage. Under V = 2 V at x
st= 0.01 mm, most of the damping ratios when the transducer frequency was shifted from the resonance frequency, were higher than the value when the frequency matched the resonance frequency. This result suggests the frequency to obtain the highest damping effect exists in the range different from the resonance frequency.
Therefore, the damping effect by the proposed method does not always occur at the resonance frequency of the transducer. To obtain a higher damping effect, an appropriate combination of the applied voltage and the transducer frequency should be investigated for each static pressing displacement. Thus, it is difficult to estimate the magnitude of the damping effect from the combination of these parameters. Therefore, the next section investigates the change in the damping ratio sorted by the current that flows in the transducer and relates it to its amplitude velocity.
Fig. 6 Change of the damping ratio with the applied voltage 4.3 Influence of Current Flowing in the Transducer on the Damping Effect
The damping effect by the proposed method is related to the friction condition of the contact surface between the transducer and the object. The friction force induced at the contact surface is related to a static force by pressing the transducer to the object in addition to an impact force applied by the vibrating transducer, while the impact force relates to the amplitude velocity of the transducer. The amplitude velocity correlates to the current flowing in the transducer in the piezoelectric media. The current will, therefore be related to the damping effect due to the proposed method.
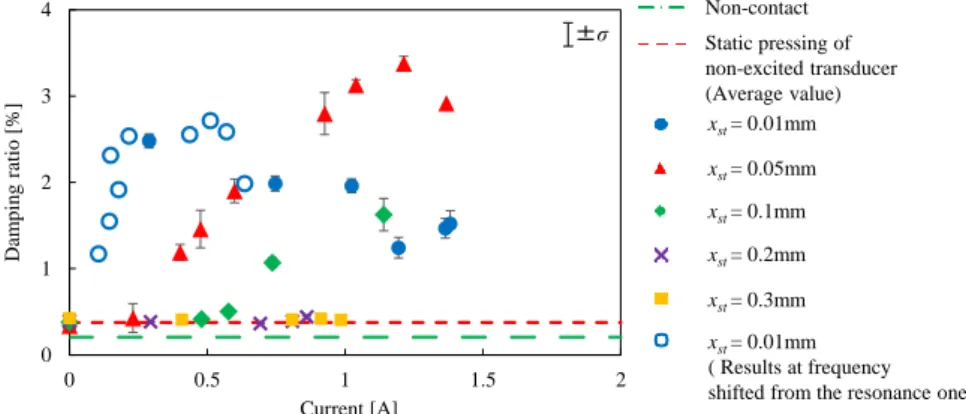
Therefore, the damping ratios obtained in the previous section were sorted using the value of the current flowing in the transducer, as shown in Fig. 7. In Fig. 7, the blue outlined circles denote the damping ratio with the current when the transducer frequency is shifted from the resonance frequency of the transducer under V = 1 V and 2 V at x
st= 0.01 mm.
As shown in Fig. 7, at x
st= 0.1 mm (green lozenge symbol), the damping ratio monotonically increased with the current. At x
st= 0.05 mm, the damping ratio showed a peak at a specific current. With V = 1 V and 2 V at x
st= 0.01 mm (blue outlined circle symbol) in Fig. 6, when its frequency was shifted from the resonance frequency of the transducer, the damping ratio varied depending on its frequency even when the applied voltage was the same. In contrast, with V = 1 V and 2 V at x
st= 0.01 mm (blue outlined circle) in Fig. 7, the damping ratio clearly showed a peak at specific current values even though the transducer frequency was shifted from the resonance frequency. This peak value was obtained at the frequency different from the resonance frequency. Moreover, the peak value of the damping ratio at
xst= 0.05 mm was higher than the value at x
st= 0.01 mm. Increasing the static pressing displacement increased the current value where the damping ratio started to rise and at the current peak value of the damping ratio.
This result suggests that the magnitude of the damping effect, which will occur on the object, can be estimated by measuring the current flowing in the transducer and that the optimal current for achieving the highest damping effect exists. The piezoelectric element ordinarily drives at its resonance frequency in conventional methods for suppressing the vibration using a piezoelectric element. Contrarily, the proposed method does not require adjusting the transducer frequency to the resonance frequency. The highest damping effect is exerted by adjusting the applied voltage and the
Non-contact
xst= 0.01mm
xst= 0.01mm ( Results at frequency shifted from the resonance one ) xst= 0.05mm
xst= 0.1mm xst= 0.2mm xst= 0.3mm Static pressing of non-excited transducer (Average value)
0 1 2 3 4
0 2 4 6 8 10
Damping ratio [%]
Applied voltage V[V]
±σ
frequency so that the measured current reaches an optimal value. Moreover, a high damping effect is maintained by changing the current without the need to adjust the static pressing displacement accurately. Additionally, the proposed method has a less adverse effect on the object structure because a high damping effect can be exerted with a small static pressing displacement. Further investigation by varying the elements of the piezoelectric transducers and the casing devices is required to determine the appropriate conditions in detail. This work has been planned for the future.
Fig. 7 Change of the damping ratio with the current flowing in transducer 4.4 Discussion of the Vibration Damping Principle
From the above results, the principle of the proposed method is considered as follows. Figure 8 shows the outline of the proposed method and denotes the possible significant factors. In the proposed method, the non-excited transducer is statically pressed to the cantilever at a specific force by displacing the casing device holding it with a static pressing displacement. The static force, which the transducer applies to the cantilever, is hereafter defined as the static pressing force. The transducer is statically pressed to the cantilever at a specific static pressing force in the hammering tests described in Section 3.2. As shown in Fig. 8(a), when the cantilever vibrates by hammering and the transducer in non-excited state is only pressed statically to the cantilever, the transducer oscillates with the cantilever in the cross direction against the friction head because the transducer is supported by the leaf spring with a low rigidity. Thus, the tip of the transducer does not slip against the cantilever, and the energy loss due to friction is small, making the sufficient damping effect unobtainable. Meanwhile, as shown in Fig. 8(b), the excitation of the transducer by the ultrasonic vibration increases its amplitude velocity. The inertia effect in the longitudinal direction of the transducer thus increases and its transverse oscillation is reduced. As a result, the slip amount between the transducer and the cantilever increase and the damping effect begins to occur. Furthermore, the excitation of the transducer applies a high impact force, in addition to the static pressing force, to the cantilever. As a result, the friction force at the contact surface increases. Therefore, the energy loss increases, making a high damping effect obtainable.
(a) Transducer is not excited (b) Transducer is excited
Fig. 8 Outline of the proposed method and denotes the possible significant factors
Non-contact
xst= 0.01mm
xst= 0.01mm ( Results at frequency shifted from the resonance one ) xst= 0.05mm
xst= 0.1mm xst= 0.2mm xst= 0.3mm Static pressing of non-excited transducer (Average value)
0 1 2 3 4
0 0.5 1 1.5 2
Damping ratio [%]
Current [A]
±σ
Transverse oscillation
Static pressing
Cantilever top Transducer
Small slip Leaf spring
Static pressing force
Large slip
&
Increase in friction force
Impact force Suppression of
transverse oscillation
Static pressing
Ultrasonic vibration
The results shown in Fig. 7 are discussed based on the vibration damping principle described above. As shown in Fig. 7, when the transducer is not excited and is only statically pressed to the cantilever, the damping ratio will not increase from the value when the transducer is not in contacted with the cantilever for all static pressing displacements.
This is because the slip does not occur at the contact surface by the transverse oscillation of the transducer as described above. Conversely, under the transducer excitation, the damping ratio varied differently for each static pressing displacement. As shown in Fig. 7, at x
st= 0.01 mm, the transducer is slippery at the contact surface because the static pressing force is relatively low. Therefore, the damping ratio starts to increase at a low current because the transducer slips by a small reduction effect of the transverse oscillation. On the other hand, increasing the static pressing force makes the transducer hardly slip at the contact surface. Thus, to reduce the transverse oscillation significantly and to make the transducer slip, a high current is required. Increasing the static pressing displacement increases the current where the transducer starts to slip. Therefore, the damping ratio starts to increase at a lower current in the order of x
st= 0.01 mm, 0.05 mm, and 0.1 mm. At x
st= 0.2 mm and 0.3 mm, because the static pressing displacement is excessive, the transducer does not slip at the contact surface even though the transducer is excited. As a result, the damping ratio does not increase. The similar result as above is expected when the static pressing displacement is larger than 0.3 mm.
Moreover, the larger static pressing force is applied, the larger the force will be applied to the cantilever by the transducer excitation. If the transducer slips under a high friction force generated by a large static pressing displacement, the damping effect effectively occurs. Therefore, the peak value of the damping ratio for each
xstincreases with increasing the
xst. Thus, the peak value is higher at
xst= 0.05 mm than the value at
xst= 0.01 mm as shown in Fig. 7. However, when static pressing displacement is excessive, the slip at the contact surface of the transducer is small as described above. Therefore, the damping effect does not increase significantly under low current value although the high friction force generated at the contact surface. Thus, the damping ratios at
xst= 0.1 mm are smaller than the peak value of the damping ratio at
xst= 0.05 mm. Furthermore, it suggests that the damping ratio decreases in the range above the specified current because the impact force decreases.
To verify the validity of this finding, investigation of the relation between the damping effect with the proposed method and the impact force applied by the transducer to the object to be damped needs to be considered. Thus, we propose a method for measuring the impact force generated by the excitation of the transducer. In the proposed measurement method, the transducer is placed in contact with a bar with rigidity different from the cantilever used in the hammering tests in Section 3.2. It is desirable that the static pressing force value as the contact condition of the transducer approximately corresponds to the value where the high damping effect occurred in the hammering tests.
However, it is difficult to adjust to this desired value using the static pressing displacement. The following chapter proposes a method for measuring two values: the static pressing force and the impact force generated by excitation of the transducer. The impact test is performed later under the static pressing force approximately corresponding to the value in the hammering tests. The change in the measured impact force with the current is compared to that of the damping effect.
5. Measurement Methods of the Force Caused by the Transducer 5.1 Measurement Method for Static Pressing Force
The static pressing force applied to the cantilever from the transducer was adjusted by changing the static pressing
displacement value x
stas described above. However, it is difficult to accurately determine the static pressing force from
the static pressing displacement x
stbecause the stiffness of an object and the installation state also affect the value of x
st.
Therefore, we focused on the deformations of the two leaf springs in the casing device, which occur when the
transducer is pressed as shown in Fig. 9. By attaching strain gauges to the leaf springs as flexure elements, the static
pressing force can be measured from the strain outputs. The installation state of strain gauges is shown in Fig. 10. As
shown in Fig. 10, two strain gauges (Tokyo Measuring Instruments Lab., FLA-1-23) were attached to each leaf spring
symmetrically with respect to the longitudinal direction of the transducer. Each set of the strain gauges was connected
with a bridge box to be composed of a quarter bridge with two gauges connected in series.
Fig. 9 Deformation of the leaf spring Fig. 10 Installed condition of the strain gauge
The strain outputs were calibrated to the static pressing force by the following procedure. A force sensor (Tec Gihan, USL06-H5-100N) was installed on the apparatus shown in Fig. 3, replacing the cantilever. The transducer was statically pressed to the force sensor. In this state, while changing the static pressing displacement step by step, the strain outputs and static pressing force were measured at each static pressing displacement. The calibration test was repeated three times.
Figure 11 shows the results of the calibration test. The ε denotes averaged output value of the gauge sets. From Fig.
11, the
ε increased with increasing the static pressing force Fst. Furthermore, the
ε changed nonlinearly atapproximately F
st= 11.4 N or larger. This change occurs as the result of changing the direction of the force applied to the leaf springs with increasing the force. Calculating the calibration coefficient by the least-squares method for the range up to F
st= 11.4 N (flesh color range in Fig. 11), the coefficient was obtained as 29.63 με/N. The static pressing force caused by the transducer statically pressed to the cantilever for each static pressing displacement was measured by the calibration coefficient. Figure 12 shows the change of the static pressing force
Fstwith the static pressing displacement x
st. As shown in Fig. 12, the static pressing force linearly changed with the static pressing displacement until the force of about 10 N. This is because the calibration coefficient was calculated by linear approximation for range of static pressing force of 11.4 N or less as described above. Section 3.3 confirmed the occurrence of the damping effect under x
st= 0.01 mm, 0.05 mm and 0.1 mm. From Fig. 12, these static pressing displacements correspond to static pressing forces of approximately 0.2 N, 2.6 N and 6.1 N, respectively.
Fig. 11 Results of calibration test Fig. 12 Change of static pressing force F
stwith static pressing displacement x
st5.2 Measurement Method for Impact Force
The transducer under excitation applies the impact force to the vibrating object. The impact force cannot be directly measured by the strain gauges attached to each leaf springs due to their low responsiveness. Therefore, in this study, based on the one-dimensional elastic stress wave propagation theory (Kolsky, 1963), the impact force is measured from the stress wave propagating in the long bar. Figure 13 shows the impact test apparatus. The transducer excited by the ultrasonic vibration is pressed against one end of the round bar. At this stage, an impact force is applied to the tip of the
Static pressing displacement xst
Deformed leaf spring
Apply strain gauge 10mm
Cantilever ( Top view ) Strain gauge
Strain gauge
0 200 400 600 800 1000 1200
0 10 20 30
Strainε[με]
Static pressing force Fst[N]
ε= 29.63Fst
11.4N 363με
±σ
0 5 10 15 20 25 30
0 0.05 0.1 0.15 0.2 0.25 0.3 0.35
Static pressing forceFst[N]
Static pressing displacement xst[mm]
±σ
long bar by the vibration of the transducer, and the stress wave propagates. The stress wave is measured by the strain gauge, and the impact force is calculated by multiplying the measured strain by the cross-section area and the Young’s modulus of the bar.
The round bar was made of the aluminum alloy (A7075-T65) with 10 mm diameter to reduce the mechanical impedance. The length of the bar was 2000 mm. The impact end of the bar was spherically machined with R5. The semiconductor strain gauges (Kyowa, KSP-2-120-E4) were used to measure the stress wave. To eliminate bending strain components, the two semiconductor strain gauges were attached symmetrically to both the sides of the bar and were composed of a quarter bridge with two gauges connected in series. The semiconductor strain gauge was attached at the position of 250 mm from the impact end. Additionally, the opposite end of the bar was supported by the soft rubber having 2 mm thickness to be the free end.
The experimental procedure to measure the impact force by the transducer is as follows. First, the transducer is pressed to the tip of the long bar. By checking the strain output of the leaf springs, the static pressing displacement was adjusted so that a static pressing force became a specified value. In this state, the ultrasonic vibration was generated by the transducer, and the output from the semiconductor strain gauge was measured.
Fig. 13 Impact testing apparatus
In the impact test, the transducer is excited to produce the ultrasonic vibration while in contact with the right end of the bar, as shown in Fig. 13. At this time, the stress wave according to the impact force caused by the transducer propagates from the impact end to the free end. This stress wave is reflected on the free end of the bar. Because the free end reflection occurs here, the amplitude of the combined stress wave of the incident and reflected waves does not exceed that of the incident stress wave generated on the impact end. Moreover, the excitation frequency of the transducer producing the ultrasonic vibration is approximately 54 kHz; hence, the stress wave propagating in the bar has a high frequency. Thus, the stress wave is sufficiently attenuated before it reciprocates to the attachment position of the strain gauge. From the above, the stress wave measured from the semiconductor gauge shows only the wave occurring due to the impact force applied to the object by the excited transducer, and the impact force can be accurately determined from its amplitude.
6. Relation between the Force Caused by the Transducer and the Damping Effects 6.1 Measurement of the Force Caused by the Transducer
In the impact test, the transducer was excited by changing the applied voltage
Vand the transducer frequency f under the static pressing forces F
st= 2.6 N and 6.1 N. As shown in Fig. 12, these static pressing forces correspond to the static pressing displacement of 0.05 mm and 0.1 mm, for which a high damping effect was confirmed in the hammering tests in Section 3.2. However, the long bar used in the impact test differs from the cantilever used in the hammering test in terms of the rigidity and state of the frictional surface. Therefore, this chapter investigates the qualitative change in the impact force with the current.
The transducer frequency was adjusted to the resonance frequency for each
Fstand
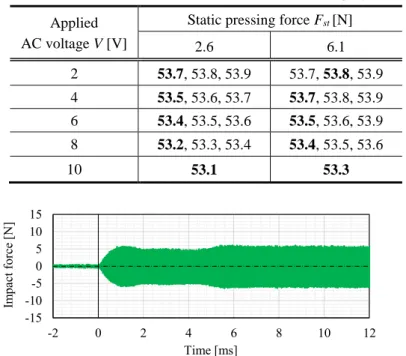
V, and to the frequenciesintentionally shifted from its resonance frequency. In this impact test, the resonance frequency of the transducer means the frequency where the current flowing in it is maximized when contacting the transducer with the long bar. Table 3 lists the test conditions. The bold values in the table denote the measured resonance frequency. Here, at V = 10 V for each F
st, impact tests were conducted under the resonance frequency.
Figure 14 shows an example of the change in the impact force with time caused by the transducer obtained from the impact test. The excitation start time of the transducer was set to 0 ms, and the impact force was measured as the difference from the static pressing force. As shown in Fig. 14, the amplitude of the impact force markedly increased
Transducer Impact force
Semiconductor strain gauge
Aluminum bar
2000
250
φ10
Unit : mm
Free end Impact end
after excitation of the transducer, and converged to a steady value. The frequency of the stress wave was confirmed to agree with the vibration frequency of the transducer.
This section measured the impact force applied to the object by the transducer excited by the ultrasonic vibration.
The next section investigates the relationship between the impact force obtained by this impact test and the current flowing in the transducer and compares the relation with that between the damping effect and the current obtained by Section 4.3.
Table 3 Transducer frequency f at each condition in impact tests ( Bold font: resonance frequency )
Unit : kHz Applied
AC voltage V [V]
Static pressing force F
st[N]
2.6 6.1
2
53.7, 53.8, 53.953.7, 53.8, 53.9 4
53.5, 53.6, 53.7 53.7, 53.8, 53.96
53.4, 53.5, 53.6 53.5, 53.6, 53.98
53.2, 53.3, 53.4 53.4, 53.5, 53.610
53.1 53.3Fig. 14 Change of the impact force with time
( F
st= 6.1 N, V = 6 V, f = 53.5 kHz(resonance frequency) and current 1.23A ) 6.2 Correlation of Impact Force and Damping Effects
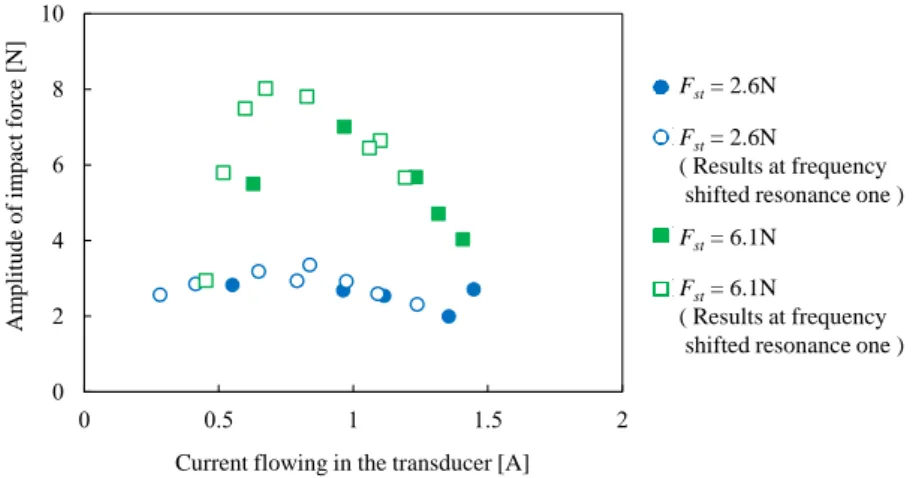
The amplitude of the impact force at steady state vibration is determined directly from the impact force -time relation measured in the previous section. Figure 15 shows the relation between the amplitude of the impact force and the current for each F
st. The outline symbols in the figure denote the results obtained at the transducer frequency shifted from the resonance frequency for each
Fst. The current where the impact force shows a peak in the impact tests does not correspond to the value in the hammering tests because the bar pressed to the transducer differs from the cantilever. However, as shown in Fig. 15, the amplitude of the impact force has a peak with respect to the current. This tendency of the impact force with the current is similar to that of the damping ratio at x
st= 0.01 mm and 0.05 mm, as shown in Fig. 7. This result suggests that the damping effect has a peak at the specified current because the impact force applied to the object also has a peak. Moreover, like the damping ratio, measuring the current can estimate the magnitude of the impact force. Additionally, the high impact force can be generated by adjusting the applied voltage and the transducer frequency so that the current matches the optimal value. These results confirm that the impact force applied to the object by the transducer excitation changes with the current and that the damping effect can be improved by increasing the impact force.
When only statically pressing the non-excited transducer to a vibrating object, the transducer oscillates with the vibrating object. In this case, because the transducer hardly slips at the contact surface between itself and the object, a sufficient damping effect cannot be obtained. In the proposed method, the excitation of the transducer causes the suppression of its transverse oscillation and makes the transducer slip at the contact surface. Furthermore, the excitation of the transducer applies the impact force in addition to the static pressing force to the object, and a higher friction force can be generated at the contact surface. In the proposed method,
-15 -10 -5 0 5 10 15
-2 0 2 4 6 8 10 12
Impact force [N]
Time [ms]
the friction between the transducer and the vibrating object generates significant energy loss, exerting a high damping effect.
Fig. 15 Change of the amplitude of impact force with the current flowing in the transducer 7. Conclusions
This study has verified a method of bringing an excited piezoelectric transducer in contact with a vibrating object in a direction perpendicular to the vibration of the object. Because the proposed method manipulates a friction loss between the transducer and the object for damping, the method does not require complicated control and design of the piezoelectric transducer. In the hammering test, a high damping effect by the proposed method was confirmed because the damping ratio at excitation of the transducer was approximately 3.4 %. This value is 10 times higher than when the transducer was statically pressed to the object.
This study demonstrates that the damping effect can be estimated by measuring the current flowing in the transducer for each static pressing displacement of the casing device holding the transducer, and suggests the existence of an optimal current to achieve a high damping effect. Additionally, this study considered that the damping effect by the proposed method was triggered by suppressing the transverse oscillation of the transducer by its excitation, and was improved by increasing the impact force generated by the excitation of the transducer. Furthermore, the impact force acting on the transducer during the ultrasonic excitation was measured by stress wave propagation in a long bar. These measurement results clarified that an increase in the impact force due to the vibration of the transducer is a primary factor determining the damping effect.
Thus, the proposed method can be expected to be employed in piezoelectric elements to suppress vibration. Further studies will elucidate the influence of current and a static pressing displacement on the damping effect, varying the elements of the piezoelectric transducer, and will investigate a design method for a vibration damping device including a holding mechanism for the transducer, with an aim toward practical application.
References
Abdeljaber, O., Avci, O. and Inman, D. J., Active vibration control of flexible cantilever plates using piezoelectric materials and artificial neural networks, Journal of Sound and Vibration, Vol.363 (2016), pp.33-53.
Berardengo, M., Manzoni, S. and Conti, A. M., Multi-mode passive piezoelectric shunt damping by means of matrix inequalities, Journal of Sound and Vibration, Vol.405 (2017), pp.287-305.
Bruant, I., Gallimard, L. and Nikoukar, S., Optimal piezoelectric actuator and sensor location for active vibration control, using genetic algorithm, Journal of Sound and Vibration, Vol.329, No.10 (2010), pp.1615-1635.
Goncalves, J. F., De Leon, D. M. and Perondi, E. A., Topology optimization of embedded piezoelectric actuators considering control spillover effects, Journal of Sound and Vibration, Vol.388 (2017), pp.20-41.
Hu, Q., Variable structure maneuvering control with time-varying sliding surface and active vibration damping of flexible spacecraft with input saturation, Acta Astronautica, Vol.64, No.11-12 (2009), pp.1085-1108.
0 2 4 6 8 10
0 0.5 1 1.5 2
Amplitude of impact force [N]
Current flowing in the transducer [A]
Fst= 2.6N
Fst= 2.6N
( Results at frequency shifted resonance one ) Fst= 6.1N
Fst= 6.1N
( Results at frequency shifted resonance one )