DOI: http://dx.doi.org/10.14246/irspsd.3.2_4
Copyright@SPSD Press from 2010, SPSD Press, Kanazawa
Review on the Development of a Sustainability
Indicator System in Agenda 21 for Tourism in Mexico
Tiyao SUI-QUI 1 * and Hong LENG 1
1 School of Architecture, Harbin Institute of Technology
*Corresponding Author, Email: [email protected] Received 3 March, 2014; Accepted 12 August, 2014
Key words: Sustainability; Indicators of Sustainable Development; Agenda 21; Travel Destinations; Mexico.
Abstract: Tourism in Mexico has been boosted as one of the most important economic activities, and is now trying to diversify its market by offering different types of destinations. In the context of sustainability, concern arises for authorities and society in general about the search for balance of the tourist destinations in the country. As a result of the effort and the sum of the will of three levels of government (Federal, State and Municipal), Local Agenda 21 for Tourism in Mexico was born. This instrument presents a Sustainability Indicator System to evaluate tourist destinations in Mexico. Through the evaluation of four major themes: Environment, Socioeconomic Environment, Tourism and Urban Development, the current situation of tourism in Mexico is diagnosed.
This paper analyzes the results of the application of the Sustainable Development Indicators (SDIs), promoted by the Ministry of Tourism (SECTUR) in eighty-four destinations during the period of 2002-2007, from the length and breadth of the country. The best-positioned tourist destinations are categorized as Medium Cities. Paradoxically, coastal tourist destinations are in the middle. The worst condition is found in the tourist destinations of nature. The results show better performance indicators for urban development, while the higher pressure is in the environmental areas.
1. INTRODUCTION
Tourism in Mexico has been boosted as one of the most important economic activities, and is now trying to diversify its market by offering different types of destinations. In the context of sustainability, concern arises for authorities and society in general about the search for balance of the touristic destinations in the country. As a result of the effort and the sum of the will of three levels of government (Federal, State and Municipal), Local Agenda 21 for Tourism in Mexico was born. This instrument presents a Sustainability Indicator System to evaluate tourist destinations in Mexico.
Through the evaluation of four major themes: Environment, Socioeconomic Environment, Tourism and Urban Development, the current situation of tourism in Mexico is diagnosed. This paper analyzes the results of the application of the Sustainable Development Indicators (SDIs), promoted by the Ministry of Tourism (SECTUR) in eighty-four destinations during the period of 2002-2007, from the length and breadth of the country.
The best-positioned tourist destinations were categorized as Medium Cities.
4
Paradoxically, coastal tourist destinations are in the middle. The worst condition was found in the tourist destinations of nature. The results show better performance indicators for urban development, while the higher pressure is in the environmental area.
After being raised that tourism could boost the economy and reduce the poverty in developing countries, many countries, including Mexico, have been areas with opportunities to stimulate economic growth. Currently, tourism in Mexico is wide and is strongly linked to the development policies of the country, as it is the third sector that generates income, after oil sales and foreign remittances (Ruiz, 2008).
Mexico has a great potential for development in its destinations. It thanks to cultural diversity, climate and landscape that have been diversifying the range in beach, cultural destinations, and recently, those linked to ecotourism or adventure.
Yet from this perspective, it becomes clear, for state and society in general, the need to take urgent measures to conserve natural resources and the environment that sustains them, in light of the sustainability required in order to achieve a balanced development that will lead to improving the quality of life of the population.
In Mexico a concrete effort aimed at sustainable development is the program of Agenda 21 for Tourism in Mexico. This instrument presents a methodology to assess, through a system of indicators, the sustainability of the various tourist destinations, which has been applied in eighty-four tourist destinations along the length and breadth of the country between 2002 and 2007.
The paper is organized in four sections. The work is a part of the progress of sustainable development indicators in the world. Thus, in the first part we develop three elements circumscribing the body of the subject, these are: Sustainability, Sustainable Development Indicators and Sustainable Tourism. They all have the common element of Agenda 21 for Tourism in Mexico.
In the second part we presented the methodology. In order to obtain a recent overview of the degree of sustainability of tourism in Mexico, we sought and analyzed official information generated mainly by the Ministry of Tourism (SECTUR) and the Interior Ministry. The sources that were consulted specifically to identify public policies at the national level to strengthen national sustainable development were: National Policy and Strategy for Sustainable Tourism Development, National Development Plan and Tourism Sector Program, for the period 2007 - 2012. Regarding indicators, the Indicator System SECTUR, posed through Agenda 21 for Tourism in Mexico, was revised.
The third part includes the assessment results using sustainable indicators that show a series of tables summarizing the assessments of indicators and variables in four major areas: Environment, Socioeconomic Environment, Tourism and Urban Development. Percentages are offered in priority variables, and variables with favourable assessment of the five types of tourist destination in Mexico. It then establishes the current state of sustainability of tourism destinations.
Finally, it finishes with conclusions and recommendations.
2. PROGRESS OF SUSTAINABILITY INDICATOR SYSTEM
2.1 Sustainable Development
2.1.1 Birth of the idea of Sustainability
It is pertinent to note the evolution of the idea of sustainability in order to understand the current context. The environmental problems caused by societies have existed over time, expressed through multiple forms and consequences (Hughes, 1981).
In 1987 the Brundtland report “Our Common Future” was developed, being the reference to the programs that were aimed at sustainable development. This report of the World Commission on Environment and Development was the first milestone in the international context, which analyzed the socioeconomic consequences of environmental deterioration. It was the first time when the concept of sustainable development was introduced, defined as "the set of strategies to ensure the satisfaction of current needs without compromising the ability of future generations to meet theirs" (Lanza, 1999).
This report sees sustainable development as a multidimensional process that affects the economic, ecological and social levels (Daly et al., 2005).
In order for sustainability to exist, three conditions must be met. First, integrating environmental, social and economic aspects, making more efficient use of energy, minimizing environmental impact, and maximizing social and economic benefits. Then, consider the fundamental role of the institutions in planning sustainable development policies. These policies pose a long-term vision, from good planning and sound strategies (Marbán, 2006).
The next step in the construction of sustainable development was marked by the Rio Conference "Earth Summit" in 1992, which gathered together representatives of over 179 countries in the city of Rio de Janeiro, Brazil.
2.1.2 Agenda 21: features and general principles
Agenda 21 is an action plan of the United Nations for sustainable development in the twenty-first century, adopted by 173 governments at the United Nations Conference on Environment and Development at the Rio Summit in 1992. During this summit, local communities were urged to create their own Local Agenda 21, with specific plans and actions for each location, with reference to the general guidelines of Agenda 21.
Agenda 21 attempts to identify environmental problems and their causes from environmental audits and diagnostics and to set a clear hierarchy to create action programs for environmental, economic and societal conditions (Gonzalez, 2006).
Agenda 21 introduces the concept of national strategies for sustainable development as a means of integrate economic, social and environmental issues in a focused action plan (Ruiz and Martinez, 2007).
2.2 Sustainable Development Indicators
2.2.1 International efforts on Sustainable Development Indicators
The substantive development of sustainability indicators and sustainable development began in the early 80's in Canada and some European countries, but the most important impetus came from the Earth Summit (Rio de Janeiro, Brazil). To monitor progress on Agenda 21, the United Nations Conference on Environment and Development established the Commission on Sustainable Development (CSD).
In 1995, the United Nations Commission on Sustainable Development created a work program aimed at the development of indicators of sustainable development. This work resulted in the publication in 1996 of the "Blue Book" in which appeared in four levels - economic, social, environmental and institutional - a methodological framework, the definition and meaning of a set of indicators considered sustainable development (Duran, 2012).
Of great importance is also the core set of indicators for environmental performance reviews of the OECD, a summary report by the Task Force on the State of the Environment from 1993, and it is mainly because of its methodological approach, which developed the model of Pressure-State- Response (PSR) in describing the interactions between society and the environment, which has been the basis of many of the systems developed later. But so is the variety and specificity of the collected indicators (Urbano, P, 2011).
In Latin America, the United Nations’ Economic Commission for Latin America (ECLAC) prepares, through its Division for Sustainable Development and Human Settlements database, for the evaluation of sustainable development in Latin America and the Caribbean (BADELSALC) (Gallopin, 2003).
Quiroga (2001) proposes the following typology of indicators, based on experience accumulated worldwide:
1. Environmental Sustainability Indicators first generation (1980- present): They are explained as complex phenomenon from a productive sector (health, agriculture and forestry).
2. Sustainable Development Indicators or second generation (1990- present): Made since the multidimensional approach to sustainable development. Its purpose is to advance the design and implementation of SDI systems composed of environmental, social, economic and institutional indicators.
3. Sustainable Development Indicators third generation (to be developed): Designing such indicators is a major challenge, because it means to design binding indicators for understanding the complex linkages between economic, social and environmental issues, in a systemic and transversal way.
2.3 Tourism and Sustainable Development
Parallel, but linked to the sustainable development environment events, premises arise to route tourism towards sustainability, so three years after the Rio Summit, the World Tourism Organization organized the World Conference on Sustainable Tourism in the Canary Islands, Spain in 1995.
In November 2007, in Cartagena de Indias, Colombia, the WTO organized the V Sustainable Tourism Network and. as part of the panel
"Current Challenges of sustainable tourism development: poverty
alleviation, natural heritage management and cultural and climate change".
Mexico presents the progress of Program Agenda 21 for Tourism in Mexico (SECTUR, 2008).
2.3.1 Sustainable Tourism
In the nineties, what discussed and reflected in forums was tourism that showed the effects of rampant tourism development. The initial ideas of the critics had, as its primary focus, socially responsible tourism development that threatened the general ecologist and environmentalist approach of that time (Reyes, 2002).
The WTO defines sustainable tourism based on the following principles:
a) conservation of natural and cultural resources for its continued use in the future, at the same time reporting actual benefits; b) planning and management of tourism development in a way that does not cause serious environmental or socio-cultural problems; c) maintenance and continuous improvement of environmental quality, d) maintaining a high level of visitor satisfaction and therefore strengthening the prestige and commercial potential of the destination; e) benefits perceived by populations generated from tourism’s spill (Troncoso, 1999).
2.3.2 Agenda 21 for Tourism in Mexico
Agenda 21 for Tourism in Mexico has as a base of the National Policy and Strategy for Sustainable Tourism Development document.
Thus, Agenda 21 for Tourism in Mexico is the result of the commitment agreed upon and efforts to contribute to the sustainable development of the country. The work was coordinated by the Ministry of Tourism (SECTUR) and the Ministry of Environment and Natural Resources (SEMARNAP), (SECTUR, 2001).
Currently, Agenda 21 for Tourism in Mexico is part of the National Development Plan 2007-2012 and the Tourism Sector Program 2007-2012.
Agenda 21 for Tourism in Mexico proposes strategies and actions in the short, medium and long terms in order to strengthen the dynamics of the tourist regions and promote sustainable development, strengthening human welfare, respecting the environment and optimizing economic and social benefits of communities (SECTUR, 2008).
This program is designed as a proposal for the three levels of government (federal, state and municipal), tourism entrepreneurs, academia, NGOs and the local community to work in coordination in improving the tourist destinations and living conditions of communities.
In this process, the Federal Government has an important role as promoter and facilitator, and in coordination with the State Governments, tourist destinations and especially local communities, establishing objectives and goals to pursue and achieve (Martínez, 2009).
Meanwhile the Municipal Government has a leading role in implementing the program, acting as a strategic developer to meet local environmental issues and also as a driver of change processes and mediator among the groups that interact in the processes of local economic and social development locally.
The SECTUR proposes a system of sustainable development indicators
(Table 1) on four major themes: Environment, Socioeconomic Environment,
Tourism and Urban Development, which in turn are divided into twelve sub-
themes and sets clear goals.
Table1. Sustainable Indicator System of Agenda 21 for Tourism in Mexico Topic Subtopic Objective
E nv ir onm ent
Energy Air Water Waste Environmental Education
-Promote the sustainable use of natural resources.
-Keep the functioning of ecological systems.
-Protect and conserve natural resources
-Evaluate the interaction between tourism and urban and natural environment of the destination (resource consumption and waste disposal).
S o ci o - eco n o m ic E n vi ro n m en t
Economic benefits Tourism.
Social Impact
-Size the benefits generated in the destination, in order to improve the quality of life of the population.
-Evaluate the impact generated by tourism in the preservation of cultural values and customs of local communities.
T o u ri sm Tourism demand Tourist offer
-Know the visitor profile and its relationship to sustainability.
-Sizing the extent to which tourism establishments respond to sustainable development.
-Promote the conservation of natural and cultural attractions.
U rban D evel o p m en t Plans and
Programs.
Urban-Image.
Urban
Comprehensive Development.
-Evaluate the degree of urban development (infrastructure, equipment and housing of the population).
-Identify planning processes that enable orderly spatial development of the environmental, tourism and urban issues.
3. THE IMPLEMENTATION OF SUSTAINABLE INDICATORS
For decades, internationally, the main recipients of tourism have been France, Spain, the U.S., and just recently, China. In the second level there are Italy, Great Britain, Mexico and Germany. Mexico stands out, along with China and Turkey, as a developing country that is in the list of top ten countries with the highest tourist arrivals in the world (Meixueiro, 2008).
Between 1995 and 2005 the country moved to rise and fall in the range of 20 million international visitors per year and more than 140 million domestic touristy trips (SECTUR, 2007). However, during the first few months of 2011, international visitor arrivals to the country were already at 38.2 million.
Traditionally in Mexico, the most important international sector has been from United States and Canada; however, as a result of diversification efforts and easing immigration, the number of tourists from countries like Russia (59.4%), Peru (42.6%), Brazil (45.6%), Sweden (35.4%), China (33.9%) and Colombia (31.7%), to name the major ones, has increased (SECTUR, 2011).
On the stage of the Mexican economy, tourism presents interesting figures. This sector has taken great relevance in the economy since the eighties, becoming the second largest source of revenue for the country.
Revenues of Mexican tourism have presented an average increase of 6.5%
over the period from 2000 to 2007 (Garcia and Carranco, 2009).
In June 2011, the National Institute of Statistics, Geography and
Informatics (INEGI) presented the results of the Tourism Satellite Account
in Mexico 2005-2009; this reaffirmed the importance of tourism to the
economy’s country, representing 8.9% of the Gross Domestic Product
(GDP) in 2009. During this period, earnings from international visitors in
Mexico totalled 6.179 million dollars (SECTUR, 2011).
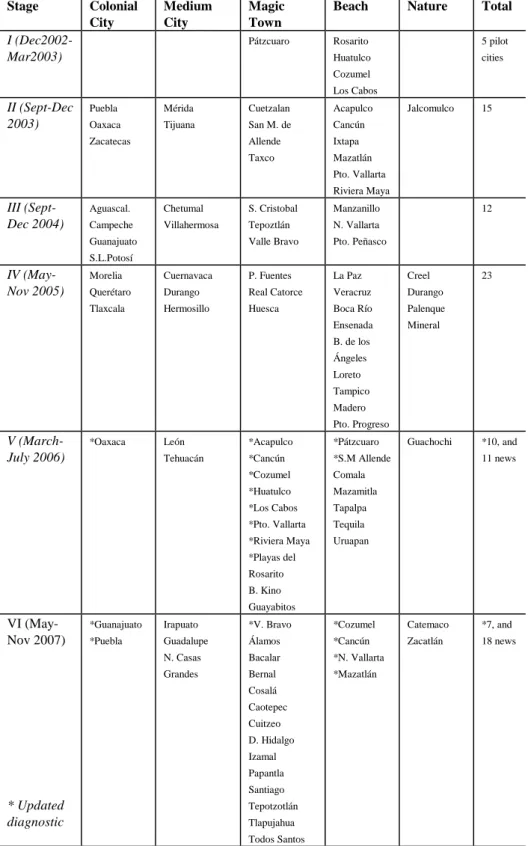
The Ministry of Tourism (SECTUR) produced the diagnostic information that referred to the system of sustainability indicators and employs Agenda 21 for Tourism in Mexico, during five years, in six stages from December 2002 to November 2007. Also, SECTUR classified into five types the touristic destinations: Heritage’s World Cities (Colonial Cities), Medium-sized Cities (Urban Centres), Magic Towns, Beaches and Nature (Adventure), and which together account 84, distributed across the national territory (see Table 2 and Figure 1).
Table 2. Implementation phases’ destinations of the Sustainability Indicator System Stage Colonial
City
Medium City
Magic Town
Beach Nature Total
I (Dec2002- Mar2003)
Pátzcuaro Rosarito Huatulco Cozumel Los Cabos
5 pilot cities
II (Sept-Dec 2003)
Puebla Oaxaca Zacatecas
Mérida Tijuana
Cuetzalan San M. de Allende Taxco
Acapulco Cancún Ixtapa Mazatlán Pto. Vallarta Riviera Maya
Jalcomulco 15
III (Sept- Dec 2004)
Aguascal.
Campeche Guanajuato S.L.Potosí
Chetumal Villahermosa
S. Cristobal Tepoztlán Valle Bravo
Manzanillo N. Vallarta Pto. Peñasco
12
IV (May- Nov 2005)
Morelia Querétaro Tlaxcala
Cuernavaca Durango Hermosillo
P. Fuentes Real Catorce Huesca
La Paz Veracruz Boca Río Ensenada B. de los Ángeles Loreto Tampico Madero Pto. Progreso
Creel Durango Palenque Mineral
23
V (March- July 2006)
*Oaxaca León Tehuacán
*Acapulco
*Cancún
*Cozumel
*Huatulco
*Los Cabos
*Pto. Vallarta
*Riviera Maya
*Playas del Rosarito B. Kino Guayabitos
*Pátzcuaro
*S.M Allende Comala Mazamitla Tapalpa Tequila Uruapan
Guachochi *10, and 11 news
VI (May- Nov 2007)
* Updated diagnostic
*Guanajuato
*Puebla
Irapuato Guadalupe N. Casas Grandes
*V. Bravo Álamos Bacalar Bernal Cosalá Caotepec Cuitzeo D. Hidalgo Izamal Papantla Santiago Tepotzotlán Tlapujahua Todos Santos
*Cozumel
*Cancún
*N. Vallarta
*Mazatlán
Catemaco Zacatlán
*7, and
18 news
Figure 1. Tourist Destinations Assessed by SECTUR (2002-2007)
As mentioned, SECTUR proposes a system of indicators to assess the sustainability of tourism in Mexico, divided into four main areas:
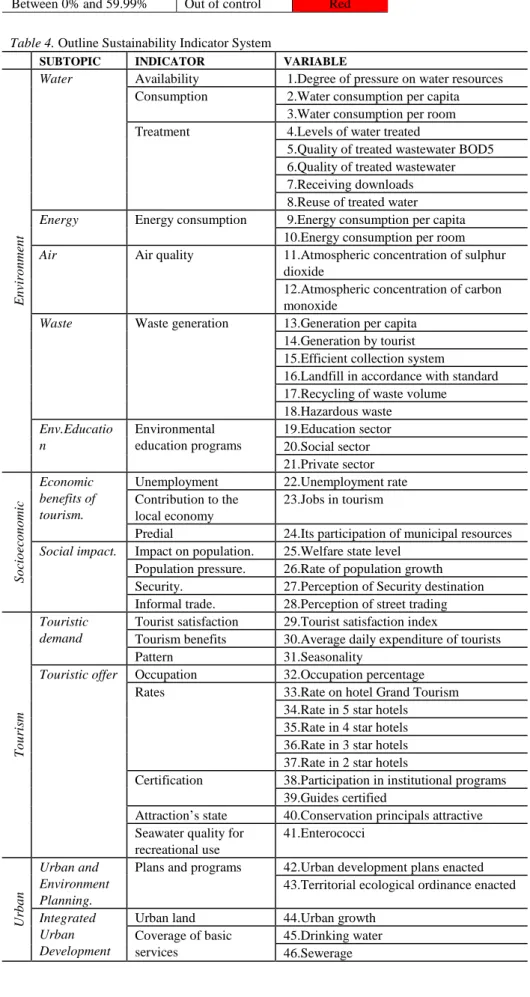
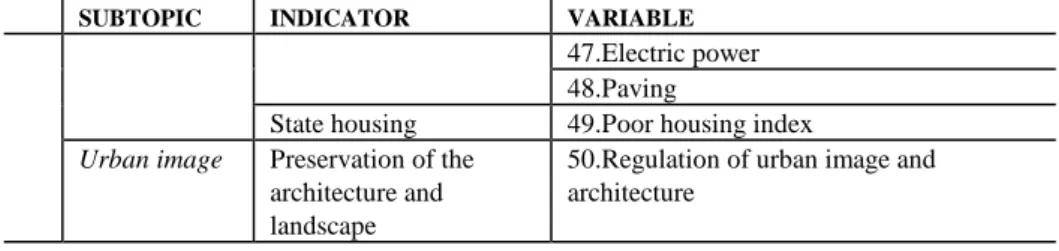
Environment, Socioeconomic Environment, Tourism and Urban Development. These large topics are divided into twelve sub-themes, which give rise to twenty-eight indicators to diagnose finally fifty variables (Table 4).
In this regard, it is noteworthy that the work undertaken by SECTUR becomes possible by the cooperation of various Secretaries of State in the three levels of government (Federal, State and Municipal), largely because it was them which generated the information above.
Some of the agencies that generated information for the area of Environment were the National Agricultural Council (CNA), the National Water Commission (CNA), the Secretariat of Environment and Natural Resources (SEMARNAT), the Federal Electricity Commission (CFE) and the Public Service Municipal’s dependences of different touristic destinations. For the issue of Socio-economic Environment, participation was valuable from the National Institute of Statistics, Geography and Informatics (INEGI) and the National Population Council (CONAPO). For Tourism, the Ministry of Tourism (SECTUR), on which the responsibility for the subject of Tourism practically fell and finally, to the issue of Urban Development, data were obtained from the departments of Planning and Urban Development from the various states and municipalities.
To evaluate the indicators, SECTUR proposes using the Technique of
Semaphore, which seeks to determine the Management Consideration
indicators, which are patterns, evaluation ranges or variables (considered,
efficient, present, existing, quantity, management...) under which one can
know the status indicator. These criteria vary depending on the measure
being evaluated. The Management Considerations permit identification of
the values of which the indicator is, where: Green means that the indicator is
in better shape than the parameters (under control), which is evaluated as a
favourable condition; Yellow describes that the indicator is in good
condition, but not to neglect it, requiring preventive care (in caution); and
finally, Red shows that the indicator presents a problem (out of control) or is
an opportunity area and is associated as a priority (Table 3).
Table 3. Management Considerations for Indicators
Table 4. Outline Sustainability Indicator System
SUBTOPIC INDICATOR VARIABLE
E nv ir onm ent
Water Availability 1.Degree of pressure on water resources Consumption 2.Water consumption per capita
3.Water consumption per room Treatment 4.Levels of water treated
5.Quality of treated wastewater BOD5 6.Quality of treated wastewater 7.Receiving downloads 8.Reuse of treated water Energy Energy consumption 9.Energy consumption per capita
10.Energy consumption per room Air Air quality 11.Atmospheric concentration of sulphur
dioxide
12.Atmospheric concentration of carbon monoxide
Waste Waste generation 13.Generation per capita 14.Generation by tourist 15.Efficient collection system
16.Landfill in accordance with standard 17.Recycling of waste volume
18.Hazardous waste Env.Educatio
n
Environmental education programs
19.Education sector 20.Social sector 21.Private sector
Soc ioe conom ic
Economic benefits of tourism.
Unemployment 22.Unemployment rate Contribution to the
local economy
23.Jobs in tourism
Predial 24.Its participation of municipal resources Social impact. Impact on population. 25.Welfare state level
Population pressure. 26.Rate of population growth Security. 27.Perception of Security destination Informal trade. 28.Perception of street trading
T o u ri sm
Touristic demand
Tourist satisfaction 29.Tourist satisfaction index
Tourism benefits 30.Average daily expenditure of tourists
Pattern 31.Seasonality
Touristic offer Occupation 32.Occupation percentage Rates 33.Rate on hotel Grand Tourism
34.Rate in 5 star hotels 35.Rate in 4 star hotels 36.Rate in 3 star hotels 37.Rate in 2 star hotels
Certification 38.Participation in institutional programs 39.Guides certified
Attraction’s state 40.Conservation principals attractive Seawater quality for
recreational use
41.Enterococci
U rban l
Urban and Environment Planning.
Plans and programs 42.Urban development plans enacted 43.Territorial ecological ordinance enacted Integrated
Urban Development
Urban land 44.Urban growth Coverage of basic
services
45.Drinking water 46.Sewerage RANGE EVALUATION CONDITION/STATUS Above 90% thereafter Under control Green
Between 60% and 89.99% Caution Yellow
Between 0% and 59.99% Out of control Red
SUBTOPIC INDICATOR VARIABLE 47.Electric power 48.Paving
State housing 49.Poor housing index Urban image Preservation of the
architecture and landscape
50.Regulation of urban image and architecture
4. ASSESSMENT RESULTS USING SUSTAINABLE INDICATORS
Table 5, below, has divided Table 4 into four major areas that summarize the topics, subtopics, indicators and variables that evaluate the system of indicators proposed by Agenda 21 for Tourism in Mexico, to visualize and better understand the results. It shows the variables assessed by type of destination through the traffic light system.
So, for the area of Environment, which is related to the use and exploitation of resources, the indicators which should be treated as a priority in most destinations are: the collection and treatment of waste water, and excessive waste generation and its management. It finds that there are not landfills as it is indicated by the standard of sanitation and the recycling of waste is practically null. The management of hazardous waste is presented in two of the five types of destinations as a priority. These items should be included in the priority agenda of the state and municipal governments, as they are conditions that affect the health of individuals and the welfare of the urban centres.
It also becomes clear how little or limited the private sector participation is in environmental education programs, especially in Beach and Nature destinations, which depend almost entirely on the landscape and environmental conditions of the regions where they operate.
Of the indicators that are favourable in most destinations, we can cite the per capita water consumption, the efficient garbage collection system and the educational sector participation in social and environmental education programs.
Table 5. Environmental Assessment
INDICAT. VARIABLE A B C D E
E nv ir onm ent
Availability 1.Degree of pressure on water resources Consumption 2.Water consumption per capita
3.Water consumption per room Treatment 4.Levels of water treated
5.Quality of treated wastewater BOD5 6.Quality of treated wastewater 7.Receiving downloads 8.Reuse of treated water Energy
consumption
9.Energy consumption per capita 10.Energy consumption per room
Air quality 11.Atmospheric concentration of sulphur dioxide 12.Atmospheric of carbon monoxide
Waste generation
13.Generation per capita 14.Generation by tourist 15.Efficient collection system
16.Landfill in accordance with standard 17.Recycling of waste volume
18.Hazardous waste
INDICAT. VARIABLE A B C D E Environmental
education programs
19.Education sector 20.Social sector 21.Private sector
A: Colonial City B: Medium City C: Magic Town D: Beach D: Nature
Table 6 shows the percentages of the evaluation and diagnosis of the variables in the Environmental issue, which are presented with prior attention and in favourable condition.
Table 6. Environment: percentage of indicators in priority and favourable condition ENVIRONMENT
PRIORITY FAVOURABLE CONDITION
CO L O NIA L CIT Y *45% destinations do not treat wastewater.
*73% produces a lot of garbage.
*45% have no landfill in accordance with the standard.
*64% volume of solid waste recycling is low.
*91% waste collection system is efficient.
*64% have programs for hazardous waste management.
*91% social sector promotes environmental education programs.
M E D IU M CIT Y
*64% have no wastewater treatment.
*91% present high garbage generation.
*51% have no landfill in accordance with the standard.
*91% volume of solid waste recycling is low.
*54% have no hazardous waste management program.
*64% water consumption per capita is in favourable condition.
*54% system garbage collection is efficient.
*73% educational, social and private sector promote environmental education programs
M A GI C T OW N
*52% have no wastewater treatment.
*52% discharges without treatment.
*59% generates lots garbage.
*79% have no sanitary landfill in accordance with the standard.
*72% volume of solid waste recycling is low.
*65% have no hazardous waste management program.
*72% water consumption per capita is favourable
*62% the waste collection system is efficient.
*81% social education promotes environmental education programs.
B E A C H
*78% have high garbage generation.
*63% have no landfill in accordance with the standard.
*74% recycling of solid waste volume is low.
*63% have no hazardous waste management program.
*55% private sector has little involvement in environmental education programs.
*59% water consumption per capita is favourable.
*63% water consumption per room is low.
*67% waste collection system is efficient.
*92% education sector promotes environmental education programs.
N A T U R E
*83% have no wastewater treatment.
*67% discharges without treatment.
*75% have no sanitary landfill in accordance with the standard.
*83% private sector has little involvement in environmental education programs
*67% water consumption per capita is favourable.
*50% per capita waste generation is low.
*50% waste collection is efficient.
*67% educational sector promotes environmental education programs.
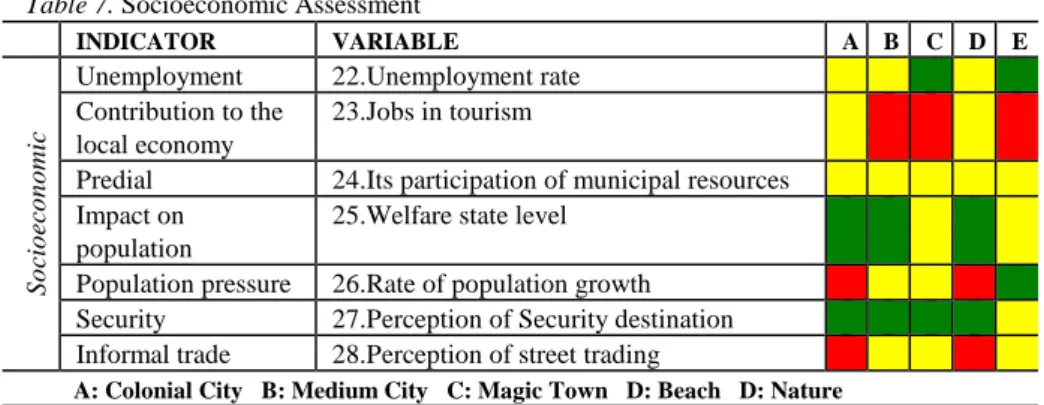
As the results of the Socioeconomic Environment, which assess the benefits of tourism and its social impacts, it was detected as a priority, the employment variable in the tourism sector, particularly in destinations considered like Magical Towns and Nature, which are inserted in a regional or rural framework (Table 7).
In a second priority level (to intervene), it is the rate of population
growth, especially in World Heritage Cities and Beach destinations. The
latter has presented itself in recent decades due to national and foreign migratory population movements, and the prior, in search of better living conditions by moving and settling in these places. The international migrants, being drawn by the rate of its currency (U.S. dollar), by relatively low land prices and weather conditions, reach Mexican lands and usually buy and build on the coast, as in the case of the peninsula of Baja California, where the two states, Baja California and Baja California Sur, compromise to accommodate a large number of Americans.
Finally, it highlights the negative perception about the informal trade in the beach destinations and colonial cities.
The variables that stand in favourable condition are: positive perception about the safety of tourist destinations in Mexico and, in the second and the third place, but closely related, the welfare of the population and the low unemployment. This is because welfare levels in tourist areas have better conditions than the rest of the country. That confirms in practice the benefits that tourism generates.
Table 7. Socioeconomic Assessment
INDICATOR VARIABLE A B C D E
Soc ioe conom ic
Unemployment 22.Unemployment rate Contribution to the
local economy
23.Jobs in tourism
Predial 24.Its participation of municipal resources Impact on
population
25.Welfare state level Population pressure 26.Rate of population growth Security 27.Perception of Security destination Informal trade 28.Perception of street trading
A: Colonial City B: Medium City C: Magic Town D: Beach D: Nature
Table 8 shows the evaluation and diagnosis of socioeconomic variables, indicating the percentages of variables in priority and favourable condition.
Table 8. Socioeconomic percentage of indicators in priority and favourable condition SOCIOECONOMIC
PRIORITY FAVOURABLE CONDITION
COLONIAL CITY
*45% have high population growth.
*45% have informal trade problems.
*91% has a good welfare in the population.
*91% security is favourable for locals and tourists.
MEDIUM CITY
*73% has a low level of employment in the tourism sector
*82% have good welfare.
*82% the security is favourable.
MAGIC TOWN
*52% has low level of employee training.
*79% has low unemployment.
*93% is safe for residents and tourists.
BEACH *70% has a high population growth.
*33% presents informal trade problems.
*81% have good welfare.
*74% present safe conditions.
NATURE *67% employment in tourism is low. *92% have low unemployment.
*58% population growth is low.
*92% security is favourable.
First, an aspect given priority in the area of Tourism was the certification
indicator in its two variables: business participation in institutional programs
and tourist guides certified in the five types of destinations. Second, it
highlights the low percentage of hotel occupancy in Colonial Cities,
Medium Cities and Magic Towns. The Magic Towns and Nature destinations are affected by the activity seasonality, see Table 9.
Meanwhile beach destinations are best positioned, this may represent tourist preference for them.
Only the indicators of state and conservation of the main attractions, like water quality for recreational use, obtained favourable assessment in the five types of destinations.
Table 9. Tourism Assessment
INDICATOR VARIABLE A B C D E
To u ri sm
Tourist satisfaction 29.Tourist satisfaction index
Tourism benefits 30.Average daily expenditure of tourists
Pattern 31.Seasonality
Occupation 32.Occupation percentage Rates 33.Rate on hotel Grand Tourism
34.Rate in 5 star hotels 35.Rate in 4 star hotels 36.Rate in 3 star hotels 37.Rate in 2 star hotels
Certification 38.Participation in institutional programs 39.Guides certified
Attraction’s state 40.Conservation principals attractive Seawater quality for
recreational use
41.Enterococci
A: Colonial City B: Medium City C: Magic Town D: Beach D: Nature
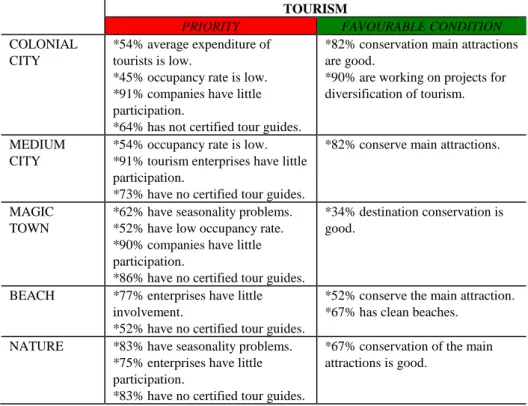
Table 10 condenses the results of the evaluation and diagnosis of the different tourism destinations and shows the percentages of the variables that were of priority and in favourable condition.
Table 10. Tourism percentage of indicators in priority and favourable condition TOURISM
PRIORITY FAVOURABLE CONDITION
COLONIAL CITY
*54% average expenditure of tourists is low.
*45% occupancy rate is low.
*91% companies have little participation.
*64% has not certified tour guides.
*82% conservation main attractions are good.
*90% are working on projects for diversification of tourism.
MEDIUM CITY
*54% occupancy rate is low.
*91% tourism enterprises have little participation.
*73% have no certified tour guides.
*82% conserve main attractions.
MAGIC TOWN
*62% have seasonality problems.
*52% have low occupancy rate.
*90% companies have little participation.
*86% have no certified tour guides.
*34% destination conservation is good.
BEACH *77% enterprises have little involvement.
*52% have no certified tour guides.
*52% conserve the main attraction.
*67% has clean beaches.
NATURE *83% have seasonality problems.
*75% enterprises have little participation.
*83% have no certified tour guides.
*67% conservation of the main attractions is good.
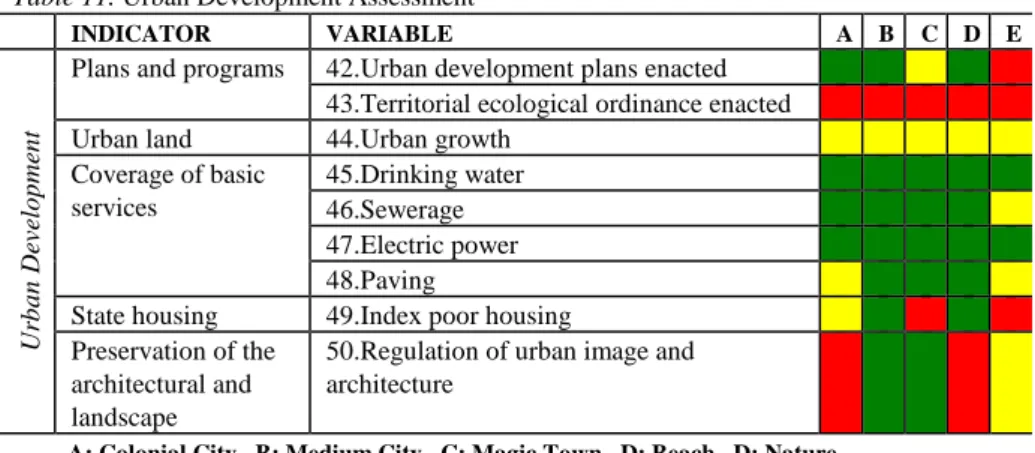
The assessment of Urban Development (Table 11), in the system that
integrates the sustainable development indicators of Agenda 21 for Tourism
in Mexico, is the one which obtained the best results. Five of nine variables
resulted in favourable conditions, including the basic service indicators, such as potable water and electricity, are covered in the five type destinations. Sewer and paving variables of basic service indicators fall under the preventive status, that is, in order not to be neglected, in the Nature and Colonial destinations respectively.
The variable of Urban Development Plans Declared, which is referred in the indicator of Plans and Programs on the sub-theme of Urban and Environmental Planning, was evaluated as favourable condition in three destinations: Colonial Cities, Medium Cities and Beach. In addition was the result of preventive status for the Magical Town destinations and, as a priority, the Nature destinations.
Note that in the five destination types, the variable of urban growth resulted in preventive care which means it should not be neglected and should be included as a priority in state and local agendas, who should consider programs that include the construction and improvement of the existing infrastructure in urban centres, such as hospitals, schools and streets, to name a few.
For its part, the variable that considers the Ecological Land Planning emerging from the sub-theme Urban and Environmental Planning, appearing as a status of priority. It is clear for the effort that should be required in this regard, to have instruments of political and territorial planning, essential for the proper land use and resource management.
The variable on Regulations of Urban and Architectural Image is also presented in an unfavourable situation in the Colonial City and Beach destinations. These tools are essential for the conservation and protection of many colonial cities in Mexico. The absence of these brings into risk their history of richness.
The precarious housing index variable, which is from the sub-theme Urban Development Integrated, appears as a priority in two kinds of touristic destination: Magic Towns and Nature. Note that these destinations are more limited in a rural context than the others.
Table 11. Urban Development Assessment
INDICATOR VARIABLE A B C D E
U rban D ev el opm ent
Plans and programs 42.Urban development plans enacted 43.Territorial ecological ordinance enacted Urban land 44.Urban growth
Coverage of basic services
45.Drinking water 46.Sewerage 47.Electric power 48.Paving
State housing 49.Index poor housing Preservation of the
architectural and landscape
50.Regulation of urban image and architecture
A: Colonial City B: Medium City C: Magic Town D: Beach D: Nature
Table 12 includes the diagnosis of the Urban Development issue, conducted through SECTUR's evaluation of tourist destinations. Shown are the percentages of the variables that were of priority and in favourable condition.
Table 12. Urban Development percentage of indicators in priority and favourable condition URBAN DEVELOPEMENT
PRIORITY FAVOURABLE CONDITION
URBAN DEVELOPEMENT
PRIORITY FAVOURABLE CONDITION
COLONIAL CITY
*64% have no program of ecological land planning.
*54% lacks urban image regulation.
*91% have declared urban development plans.
*91% has covered drinking water, sewerage and electricity.
MEDIUM CITY
*82% have no program of ecological land planning.
*91% urban development plans are enacted.
*82% has covered the basic water, sewerage and electricity.
*82% precarious housing index is low.
*73%, with regulation of urban image.
MAGIC TOWN
*72% have no ecological land- planning program.
*55% poor housing index is high.
*83% has covered drinking water, sewerage and electricity.
*65% has a policy of urban image.
BEACH *74% do not have programs of ecological planning.
*59% have no urban image regulation.
*78% has declared urban development plan.
*70% has covered water supply, sewerage and electricity.
*59% rate of poor housing is low.
NATURE *75% have no declared urban development plans.
*83% have no ecological land- planning program.
*83% rate of poor housing is high.
*67% has covered drinking water and electricity.
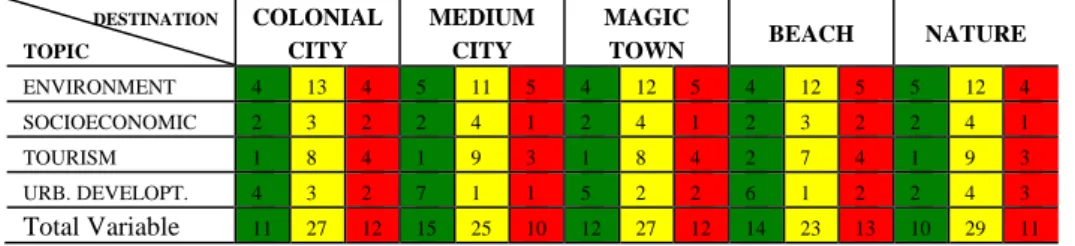
Table 13 shows a summary of the evaluation of the destinations and the total number of variables in priority, preventive and favourable statuses.
Overall, after analyzing the results of the application of the indicator system of Agenda 21 for Tourism in Mexico, Medium-sized Cities have a greater degree of sustainability. From a total of fifty variables, ten are in a priority status, half of them on the environmental issue, then on the area of tourism mainly. Fifteen variables over fifty were evaluated in a favourable condition, most of these are included in the theme of Urban Development.
Twenty-five variables were evaluated in preventive care, signally not to neglect them, but improve them.
Tourist destinations of Nature (Adventure) obtained the second best result in terms of sustainability, just after Medium Cities, following the framework proposed by SECTUR. Eleven variables of a total of fifty were in a condition to be treated as a priority. Considering those found in preventive care (twenty) and those in favourable condition (ten), that would add to thirty-nine. The issue that is most problematic is referred to in Urban Development; however, its profile is typical of features developed in rural areas of Mexico.
To be considered in middle sustainability are Magic Towns and Colonial Cities. Both exhibit practically the same results, although both present contrasts because they have the same number of variables in priority and in favourable condition (with twelve variables for each case). Priority variables are more on the subjects of Environment and Tourism (with five and four variables, respectively). The best results are in the area of Environment and Urban Development (four to five variables). There are a total of twenty- seven preventive variables, which must be addressed to improve the current condition.
Finally, on one hand, the Beach destinations, which also present
contrasts. On the one hand, there are more priority variables, thirteen of
fifty. But also, it is the second kind of destination (after Medium Cities), which presents the largest number of favourable variables (fourteen of fifty).
The summary table shows that the biggest challenges are related to the Environmental aspect and the best conditions are in the area of Urban Development.
Table 13. Summary: Diagnosis of Sustainability in the touristic destinations of Mexico
DESTINATION