• 検索結果がありません。

THE EFFECTS OF THE REQUIRED PROCESSING OF STIMULI ON SELECTIVE LETTER IDENTIFICATION

N/A
N/A
Protected

Academic year: 2021

シェア "THE EFFECTS OF THE REQUIRED PROCESSING OF STIMULI ON SELECTIVE LETTER IDENTIFICATION"

Copied!
7
0
0

読み込み中.... (全文を見る)

全文

(1)

THE EFFECTS OF THE REQUIRED PROCESSING OF STIMULI ON SELECTIVE LETTER IDENTIFICATION

Isao WATANABE*

Kinki University, Japan

Eight undergraduate students participated in an experiment which was designed to explain the time lag effects proposed by Watanabe (1986): It takes a longer time to identify a target letter from a visual display consisting of multiple letters when the letters requiring a different response are similar than when they are dissimilar.

The reaction time of pressing buttons to the target letter was measured as a function of the noises in the display. The reaction time was longer in the condition which contained noise letters than in the condition which did not. The time lag effects were not affected by the similarity of the elements in the display to the letters which result in the opposite response to the target. The results suggest that the effects are caused by the long processing required for the target and noise letters until late in the human visual information processing system.

The students of human visual information processing are interested in how man can select particular information from multiple information and then process it suc cessfully. For the study, they use a selective letter identification task. In the task, subjects are required to identify a target letter from a visual display of letters arranged on an imaginary circle centered on a fixation point.

According to the data of accuracy and reaction time, noise letters in the display exerted their interfering effects on target identification (Eriksen, & Hoffman, 1972a, 1972b; Eriksen, & Rohrbaugh, 1970). The effects have been explained by two hypotheses. A processing level hypothesis ascribed the interfering effects to the pro cessing level in a human visual information processing system. It maintained that noise letters cause the effects by delaying the processing of the target owing to competi tion for a processing unit such as a feature analyzer with the target (Estes, 1972). A response level hypothesis ascribed the effects to the response level. It maintained that noise letters cause the effects by requiring a response incompatible with the target after having received processing in parallel with the target (Colegate, Hoffman, & Eriksen,

1973; Eriksen, & Hoffman, 1973).

Watanabe (1986) measured the correct reaction time from the onset of the visual display to the subject's pressing of response buttons. Noise letters was varied under crossed-assigned (CA) and uncrossed-assigned (UCA) conditions. The letters which resulted in a different response were similar in CA condition, while they were dissimilar in UCA condition. The results supported the response hypothesis.

Furthermore, Watanabe (1986) obtained the results that reaction time in either

* Requests for reprints should be sent to Isao Watanabe, Department of Industrial Design, Kinki University in Kyushu, Iizuka, Fukuoka 820, Japan.

242

(2)

condition of noise letters was over 100 ms longer under CA condition than that under UCA condition. He proposed two possible explanations for such time lag effects under CA condition. One explanation ascribed the time lag effects to the late deter mination of the response to the target in the human visual information processing system. This was because CA condition required complex analysis of a target before the determination of the response owing to the similarity between the two sets of letters requiring a different response. The other explanation ascribed the time lag effects to the interference from the elements in the display since the elements were similar to the letters which resulted in the opposite response to the target. According to this explana tion, there is the possibility that not only the noise letters the same as the target but also the target itself had exerted its interfering effects on target identification. This was because the target letter was similar to the letters which resulted in the opposite response to the target under CA condition. In spite of these tentative explanations, Watanabe (1986) did not present a decisive explanation for the time lag effects.

The present study examined the mechanism by which man identifies a letter selec tively from a visual display consisting of letters and figures by performing an experi ment using a method similar to Watanabe (1986). The correct reaction time was measured from the onset of the visual display to the subject's pressing of buttons under the CA condition only. This is because the main purpose of the study was to ex plain the cause of the time lag effects under CA condition. The other purpose of the study was to explain the mechanism by which the noises in the display exert their in terfering effects on selective letter identification.

A variable of noises was introduced. The noises arranged together with the target were: the letters which were the same as the target in same-as-target (ST) condi tion; those which resulted in the response opposite to the target in response-incompati ble (RI) condition; those which were indifferent to the response of the target in neutral letters (NL) condition; the solid regular triangles which were indifferent to the response of the target in neutral figure (NF) condition. In addition to the above, single (S) condition which contained the target alone was prepared. RI condition was further divided into Rl-a and Rl-b conditions. The noises were similar to the target in Rl-a condition, while they were not so in Rl-b condition. The division was in troduced to test whether the difference was found in the interfering effects between RI- a and Rl-b conditions since the noises were similar to the target in Rl-a condition.

Examples are shown in Fig. 1.

The data of reaction time are predicted as follows. First, the response level

hypothesis predicts the longest reaction time in RI condition of all the conditions of

noises. The processing level hypothesis predicts the longest reaction time for ST and

Rl-a conditions. These predictions are concerned with the interfering effects from the

noises. Next, the cause of the time lag effects presented by Watanabe (1986) will be

elucidated by the comparisons of the reaction time among S, ST, NL, and NF condi

tions. The explanation by the late determination predicts no difference among the

four conditions. This is because, in this case, the time lag effects are decided by the

target alone; therefore, there will be no difference in the effects among the four condi-

(3)

tions. The explanation by the interference predicts longer reaction time in ST condi tion than in S, NL, and NF conditions and no difference in reaction time among S, NL, and NF conditions. This is because, in this case, the time lag effects are partly decided by the noises, and the effects will increase to the extent that the noises are similar to the letters requiring the opposite response to the target. Test stimuli con tain the noises similar to the letters requiring the opposite response to the target in ST condition, but not S, NL, and NF condition.

Method

Subjects: The subjects were (7 male and 1 female) undergraduates from Kyushu Institute of Design. All had normal or corrected-to-normal vision.

Apparatus and stimuli: Stimuli were displayed with a two-field tachistoscope, which consisted of Kodak slide projectors, Ralph Gerbrands Company G-l 166 shutters, and a translucent rear projection screen. The pro jection screen was 110 cm distant from the subject who sat at a table with his head located on a chin-rest.

The projection field was masked by black flockpaper in a circle of about 5° 12' of visual angle in diameter.

The masked field was centered on a fixation cross. A fixation cross 30' of visual angle in height was presented on one field, while the test stimulus was presented on the other field. The luminance of both fields was maintained at about 80 cd/m2. The time schedule of stimulus presentation was controlled by a 3- channel digital timer. Reaction times were measured in ms using an electronic time counter from the onset of the test stimulus to the subject's button pressing.

The test stimulus consisted of the capital letters C, E, F, O, X and a solid regular triangle. According to the study of similarity of capital letters by Gibson (1969) and Podgorny and Garner (1979), two pairs of letters (C, O; E, F) were similar within a pair but dissimilar between the pairs. X was similar to neither of the pairs. Either of C, E, F and O was used as a target. In single-letter (S) condition, a target letter was

ST R'-a Rl-b

c oo

x x x x

C C C F

NL NF

I

c ▲

X X

x x

A

Eig. 1. Examples of the stimulus displays for six conditions of noises: single (S), same-as-

target (ST), response-incompatible (RI), neutral letters (NL), and neutral figures

(NF). RI condition was further divided into two conditions: Rl-a, in which the

noise letters were similar to a target, and Rl-b, in which they were not.

(4)

arranged in one of 12 clock positions of 1, 2, 3, 4, 5, 6, 7, 8, 9, 10, 11 and 12 o'clock on an imaginary circle 2°24' of visual angle in diameter centered on a fixation cross as shown in Fig. 1. In target-and-noise (ST, RI, NL, and NF) condition, a target letter and two characters were arranged in either three clock positions of 2, 6 and 10 o'clock, or 4, 8 and 12 o'clock on a similar circle.

Each of the characters subtended 12' of visual angle in height. A test stimulus was accompanied by a line indicator 32' of visual angle which indicated a target. It was placed 24' of visual angle from the target on an extension of an imaginary radius from the center of the test stimulus through the target. Each charac ter was separated from the other by 1°48' of visual angle intercontour distance.

A total of 60 test stimuli were prepared for practice trials with 12 stimuli for each condition of noises, in addition to 240 stimuli for main trials with 48 stimuli for each condition of noises. Special care was taken that the four kinds of target letters should appear equally frequently on an imaginary circle.

Procedure: The subject got ready for a trial with the thumb of each hand resting on one of the two response buttons. An experimenter vocally urged the subject to focus on the screen. When the fixation cross ap peared in good focus, the subject started each trial by stepping on a footswitch. One second later, a test stimulus was presented for 2 sec. The subject was instructed to push the right (left) button if the target was C or E, and the left (right) button if the target was F or O. The assignment of the letters to the response buttons was counterbalanced across subjects.

The subject was tested individually in the dark room in three sessions. The first session consisted of three blocks of 60 practice trials. Each of the second and third sessions consisted of two blocks of 8 warm-up and 60 main trials. Three repetitions of 60 practice test stimuli were used for practice trials and the last eight test stimuli of each block were used for warm-up trials. A five minutes' rest was given between blocks. The subject was instructed to respond as quickly as possible while avoiding error. Two minutes were given for dark adaptation before each session. The order effect of noises was counterbalanced within each subject and across subjects. Error trials were rerun together following each block.

Results

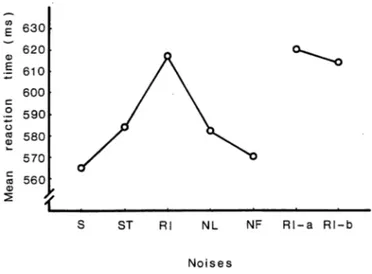
Correct reaction times were used as data after being averaged for each subject through 48 (24 each in Rl-a and Rl-b conditions) main trials in each condition. Fig. 2 shows the mean reaction times averaged for 8 subjects in each condition of noises. As is seen in Fig. 2, the reaction time is the longest in RI condition and the

g 630

~ 620

| 610

600

2 590 S 580

570

5 560

0

ST RI NL NF Rl-a Rl-b

Noises

Fig. 2. Mean reaction times for each condition of noises.

(5)

shortest in S and NF conditions of all the conditions of noises. The reaction time is longer in ST and NL conditions than in S and NF conditions.

Since the /-test found no significance between the reaction times in Rl-a and Rl-b conditions (/(7) = .52), the reaction time averaged across these two conditions was used as data for RI condition from then on. A two-way analysis of variance (noises and subjects) found significant effects of the main factor of noises (F(4, 28) = 27.36, p < .001). The lower test found significance between each pair of noise conditions ex cept between S and NF conditions, and between ST and NL conditions (LSD= 13.57, /K.02).

Discussion

One of the purposes of the present study was to examine the mechanism by which the noises in the display exert their interfering effects on selective letter identification.

The reaction time was the longest in RI condition of all the conditions of noises. The results support the response level hypothesis, since the largest interference was found in RI condition which required the response opposite to the target.

The main purpose of the present study was to explain the reaction time lag be tween the CA and UCA conditions. Watanabe (1986) proposed two possible explana tions for the time lag effects under CA condition. The explanation by the late deter mination ascribed the effects to the late determination of the response to the target owing to the complex analysis of the target letter required under CA condition. The explanation by the interference ascribed the effects to the interference from the ele ments in the display owing to the similarity of the elements to the letters which resulted in the opposite response to the target under CA condition.

The results obtained were as follows. There was a difference in reaction time among S, ST, NL and NF conditions. The reaction time was longer in ST and NL conditions than in S and NF conditions. There was no difference in the reaction time between ST and NL conditions and in that between S and NF conditions. The results support neither the explanation by the late determination nor the explanation by the interference.

The explanation by the interference supposes that there are large interfering effects from the noises in the display when the noises are similar to the letters which result in the opposite response to the target. The explanation applies to ST condition, since ST condition contains the noises similar to the letters requiring the opposite response to the target. But the explanation does not apply to NL condition, since NL condition does not contain such noises. The letter X, the noise contained in NL con dition, was originally selected as a neutral letter which is dissimilar to C, E, F, and O according to the studies by Gibson (1969) and Podgorny and Garner (1979). In addi tion, Watanabe (1987) has recently showed the dissimilarity of X to either of C, E, F, and O. Anyway, the difference obtained among the conditions of noises is incompati ble with the prediction from the explanation by the interference.

A new explanation of the time lag effects should be studied on the basis of the new

(6)

results obtained. Fig. 1 shows that the stimulus displays in S and NF conditions do not contain any other letter than the target, while those in ST and NL condition con tain two letters in addition to the target. The results suggest that the longer reaction times in ST and NL conditions than in S and NF conditions were caused by the fact that the displays in the former conditions contain letters in addition to the target.

The students of human visual information processing have maintained that the visual stimuli are processed in several stages in the hierarchical visual information pro cessing system, from the earlier stage to the later one. The earlier stage involves a global, parallel processing based on sensory analysis of the stimuli, while the later one involves a detailed, serial processing based on meaningful analysis of the stimuli. In the task which requires selection, the noises in the display share fewer processing units with the target when the selection is performed in the earlier stage, while they share more processing units when the selection is performed in the later stage. The dif ference in the number of the processing units shared among the elements causes the dif ference in the efficiency of the task which requires the selection from such elements (Eriksen, & Hoffman, 1972b; Hoffman, 1975; Keren, 1976; Neisser, 1967).

Therefore in the present selective task, the subjects were able to stop processing the noises early in the visual information processing system in NF condition, since the subjects knew in advance that only an alphabet letter could be a target in advance and the display in the condition contained no other letters than the target. The subjects had to process no noises in S condition, since the display contained no noises other than the target. On the other hand, the subjects had to continue processing the noises until late in the system in ST and NL conditions, since the displays in these conditions contained letters in addition to the target. This is the reason why the efficiency of the present experimental task was impaired less in S and NF conditions than in ST and NL conditions. The results obtained in the present study are, therefore, compatible with the view of human visual information processing.

The present study found a difference between S and ST condition, while the studies by Hoffman (1975) and Watanabe (1987) found no difference between S condi tion and the condition comparable to ST condition with replicas of the target letter.

The difference between the studies is in the relation of the target letter to the response. The letters which result in a different response are similar in the present study, while they were not so in the studies by Hoffman (1975) and Watanabe (1987). For this reason, the subjects had to continue processing the stimuli until late in the human visual information processing system in the present study, while they were able to stop doing so early in the system in the studies by Hoffman (1975) and Watanabe (1987). The different results reflect the difference in the required proces sing of the stimuli.

The time lag effects have been explained partly, but not completely. If the time lag effects can be converted into the reaction time, the effects explained hitherto are, for example, about 20 ms of difference between S and ST conditions in reaction time.

Similarly, the time lag effects obtained in Watanabe (1986) were in ST condition

about 110 ms of difference in reaction time between CA and UCA conditions. The

(7)

difference in the reaction time lag effects between the two studies is too large to ignore, even considering the difference in subjects and the experimental settings.

How will the rest of the time lag effects be explained? The difference in the reac tion time between the conditions of noises has been explained by the processing of the noise letters in the display. From now on, there is no difference between the condi tions of noises, since the difference ascribed to the noises has been excluded. The results obtained, therefore, came to be compatible with the prediction using the ex planation of late determination. The explanation ascribed the time lag effects to the required processing of the target until late in the visual information processing system, and did not predict the effects due to processing the noises in the display. And the ex planation was rejected previously, since the results showed the effects due to proces sing the noises. The reason for the discrepancy between the prediction and the results obtained was that the explanation did not consider the processing of all the elements in the display including the noises.

In conclusion, the time lag effects proposed by Watanabe (1986) were found to be caused by the long processing required of the target and noise letters until late in the human visual information system. The effects are peculiar to the situation where the letters which result in a different response are similar as in the present study. Hence, the results suggest that the selective letter identification task is affected by the proces sing of the stimuli required by the task in the human visual information processing

system.

REFERENCES

Colegate, R. L., Hoffman, J. E., & Eriksen, C. W. 1973. Selective encoding from multielement visual displays. Perception and Psychophysics, 14, 217-224.

Eriksen, C. W., & Hoffman, J. E. 1972a. Some characteristics of selective attention in visual perception determined by vocal reaction time. Perception and Psychophysics, 11, 169-171.

Eriksen, C. W., & Hoffman, J. E. 1972b. Temporal and spatial characteristics of selective encoding from visual displays. Perception and Psychophysics, 12, 201-204.

Eriksen, C. W., & Hoffman, J. E. 1973. The extent of processing of noise elements during selective en coding from visual displays. Perception and Psychophysics, 14, 155—160.

Eriksen, C. W., & Rohrbaugh, J. W. 1970. Some factors determining efficiency of selective attention.

American Journal of Psychology, 83, 330-342.

Estes, W. K. 1972. Interaction of signal and background variables in visual processing. Perception and Psychophysics, 12, 278-286.

Gibson, E. J. 1969. Principles of perceptual learning and development. New York: Appleton-Century-Crofts.

pp. 86-91.

Hoffman, J. E. 1975. Hierarchical stages in the processing of visual information. Perception and Psychophysics, 18, 348-354.

Keren, G. 1976. Levels of perceptual processing as a function of stimulus material and spatial location.

Perception and Psychophysics, 20, 37-41.

Neisser, U. 1967. Cognitive psychology. Prentice-Hall, Inc., pp. 86-104.

Podgorny, P., & Garner, W. R. 1979. Reaction time as a measure of inter- and intraobject visual similar ity: Letters of the alphabet. Perception and Psychophysics, 26, 37-52.

Watanabe, I. 1986. Effects of kind of noise letters and their relation to response on selective letter iden tification. Psychologia, 29, 247-253.

Watanabe, I. 1987. Effects of added noises on selective identification of letters. Reports of the Faculty of Engineering, Kinki University in Kyushu, 16, 28-33 (In Japanese).

(Manuscript received November 7, 1989)

Fig. 2. Mean reaction times for each condition of noises.

参照

関連したドキュメント

Several equivalent conditions are given showing their particular role influence on the connection between the sub-Gaussian estimates, parabolic and elliptic Harnack

Furuta, Log majorization via an order preserving operator inequality, Linear Algebra Appl.. Furuta, Operator functions on chaotic order involving order preserving operator

Let X be a smooth projective variety defined over an algebraically closed field k of positive characteristic.. By our assumption the image of f contains

In solving equations in which the unknown was represented by a letter, students explicitly explored the concept of equation and used two solving methods.. The analysis of

Keywords: continuous time random walk, Brownian motion, collision time, skew Young tableaux, tandem queue.. AMS 2000 Subject Classification: Primary:

Section 4 will be devoted to approximation results which allow us to overcome the difficulties which arise on time derivatives while in Section 5, we look at, as an application of

This paper presents an investigation into the mechanics of this specific problem and develops an analytical approach that accounts for the effects of geometrical and material data on

While conducting an experiment regarding fetal move- ments as a result of Pulsed Wave Doppler (PWD) ultrasound, [8] we encountered the severe artifacts in the acquired image2.