Research Article
The Spectral-Domain Optical Coherence
Tomography Findings Associated with the Morphological and Electrophysiological Changes in a Rat Model of
Retinal Degeneration, Rhodopsin S334ter-4 Rats
Kodai Yamauchi,
1Reiko Tanabu,
1Natsuki Monai,
1Takayuki Gonome,
1Yuting Xie,
1Shizuka Takahashi,
1Sei-ichi Ishiguro,
2and Mitsuru Nakazawa
11Department of Ophthalmology, Hirosaki University Graduate School of Medicine, Hirosaki, Japan
2Department of Ophthalmology, Tohoku University Graduate School of Medicine, Sendai, Japan
Correspondence should be addressed to Mitsuru Nakazawa; [email protected] Received 7 July 2018; Accepted 31 October 2018; Published 15 November 2018 Academic Editor:Atsushi Mizota
Copyright © 2018 Kodai Yamauchi et al. This is an open access article distributed under the Creative CommonsAttribution License, which permits unrestricted use, distribution, and reproduction in anymedium, provided the original work is properlycited.
Purpose. To characterize the spectral-domain optical coherence tomography (SD-OCT) findings of the rhodopsin S334ter transgenic rats (line 4) in relation to the morphologic and electroretinographic features.Materials and Methods.Rhodopsin S334ter transgenic rats (line 4) were employed as a model of retinal degeneration. The Sprague-Dawley(SD) rats were used as a wild-type control. SD-OCT (Micron IV;PhoenixResearch Labs,Pleasanton, CA, USA) was performed on the S334ter rats (line 4) from postnatal days (P) 13−110. The longitudinal changes of the SD-OCT images were analyzed both qualitativelyand quantitativelyin comparison to those of SD rats. The SD-OCT images were also compared to the histological and electron microscopic findings from examination performed onP22, 36, and 61. Full field combined rod and cone electroretinography(ERG) was performed and the relationship between the thickness of the retinal sublayers and the amplitudes of the a- and b-waves was further analyzed.Results.
The photoreceptor inner and outer segment layer became diffuselyhyperreflective in the SD-OCT images of the S334ter rats; these findings were not observed in the SD rats. This hyperreflective change corresponded to the degenerated inner and outer segments and the accumulation of the extracellularvesicles in the interphotoreceptor matrix. Quantitatively, the retinal outer sublayer and the photoreceptor sublayer in the S334ter rats became progressivelythinner in comparison to those in the SD rats; the difference was statisticallysignificant. The amplitudes of both the a- and b-waves on ERG were severelydeteriorated in the S334ter rats.
Discussion.The SD-OCT images in the S334ter rats noninvasivelyprovided information regarding the pathological changes in the photoreceptors and the longitudinal changes of both qualitative and quantitative changes during retinal degeneration in the S334ter rats (line 4). The pathological features of the photoreceptor inner and outer segments can be detected on SD-OCT as diffuse hyperreflective changes in the photoreceptor layer.
1. Introduction
Retinitis pigmentosa (RP) is the most common hereditary condition to cause retinal degeneration; it occurs in approx- imately 1 in 4,000 people worldwide [1]. RP is character- ized by the primary progressive degeneration of the rod photoreceptors and the subsequent consecutive decline of the cone photoreceptors. Although the phenotypic features are heterogeneous, night blindness and photophobia are the
typical initial symptoms and the progressive constriction of the visual field and decreased visual acuity are eventually follow.
The molecular genetic background of RP is heteroge- neous. To date, more than 80 causative genes (RetNet:
Disease Table: https://sph.uth.edu/retnet/disease.htm) have been identified forRP.Among these, the rhodopsin gene is the most common causative gene of the autosomal-dominant form of RP(ADRP). Mutations in the rhodopsin gene are
Volume 2018, Article ID 5174986, 10 pages https://doi.org/10.1155/2018/5174986
detected in 25-30% of patients with ADRP [1, 2]. Even in patients with ADRP associated with mutations in the rhodopsin gene, the phenotypic features are variable; they roughly depend on the location of the mutation in the gene. Mutations are traditionallyclassified bythe intradiscal, transmembrane, and cytoplasmic domains of the rhodopsin molecule [3].Of these, mutations in the cytoplasmic domain (Class 1) are associated with more severe phenotypes in com- parison to the other two domains [3, 4]. The Class 1 group consists of mutations causing defects in the C-terminal-end portion of the rhodopsin molecule, which possesses traffick- ing and quenching signals. Thus, the mechanisms of photore- ceptor cell death account for (1) mislocalization of the rhodo- psin molecule to the outer segment and (2) the constitutive activation of phototransduction [5, 6].
In the clinical field of ophthalmology, the recent devel- opment of spectral-domain optical coherence tomography (SD-OCT), a noninvasive imaging modality, has provided information of the fine structure of the retina. We previ- ouslyreported the characteristic SD-OCT findings of retinal degeneration inRoyal College of Surgeon’s (RCS) rats with mertk gene mutations [7] and the rhodopsinP23H (line 2) transgenic rats [8]. In addition, the SD-OCT findings of the retinal degeneration that occurs in rhodopsin knockout mice [9], rats with rhodopsin P23H (line 1) mutation (Class 2) [10, 11], rd10 mice [12], arrestin knockout mice [13], andRCS rats [14] were reported previously. Because the mechanisms of cell death are highlyheterogeneous and depend on the causative mutations [15], it is important to investigate the characteristics of photoreceptor degeneration associated with each causative gene mutation. We hypothesized that the SD-OCT findings of the retinal degeneration caused by different gene mutations maybe different. To the best of our knowledge, there have been no reports on the SD-OCT char- acteristics of retinal degeneration caused bythe rhodopsin Class 1 mutations.Although Thomas et al. reported the time domainOCT (TD-OCT) findings of transgenic S334ter rats (line 3) [16], the quality of the TD-OCT images was not enough to provide fine structure of the degenerated retina.
In the present study, we attempted to characterize the SD- OCT findings of retinal degeneration in transgenic rhodopsin S334ter rats (line 4) [17], a typical Class 1 mutant, to seek any particular characteristics in theOCT findings in relation to the morphological and electrophysiological features.
2. Materials and Methods
2.1. Experimental Animals. The experimental procedures performed in this studyconformed to the Association for Research in Vision andOphthalmology(ARVO) Statement for the Use ofAnimals inOphthalmic and VisionResearch and were approved bythe institutional Committee of Ethics for animal experiments (Approval Number: M11026).
The homozygous rhodopsin S334ter transgenic rats (line 4) were generously provided by Dr. Mathew M LaVail of the Universityof California. Sprague-Dawley(SD) rats were used as wild type (wt) control rats and were purchased from Clea Japan (Tokyo,Japan). The rats were maintained at the Hirosaki University Graduate School of Medicine Animal
Care Service facilityunder a cycle of 12 h of light (50 lx illu- mination) and 12 h of darkness (<10 lx environmental illumi- nation) in an air-conditioning atmosphere. Care was taken not to cause light-induced photoreceptor damage. The ani- mals hadad libitumaccess to food and water.
2.2. SD-OCT Examinations. SD-OCT was performed according to previouslyreported methods [8]. In brief, SD- OCT was carried out at 8 time points from postnatal day(P)13 toP110 for S334ter rats and at 6 points fromP19 untilP134 for SD rats. Three or four rats (six to eight eyes) were examined at each time point. Number of rats for each measurement is shown in Table 1.Rats were anesthetized with an intraperi- toneal injection of a mixture of medetomidine hydrochloride (0.315mg/kg), midazolam (2.0mg/kg), and butorphanol tartrate (2.5mg/kg) after the induction of analgesia bythe inhalation of 80% carbon dioxide and 20% oxygen. Using a MicronIV (PhoenixResearch Labs,Pleasanton, CA, USA), SD-OCT images were obtained from a position set horizon- tally at 1 disc diameter superior to the optic disc under simultaneous ocular fundus monitoring. The pupils were di- lated with the instillation of eye drops containing a mixture of 0.5% tropicamide and 0.5% phenylephrine hydrochloride.
The corneal surface was protected using a 1.5% hydroxyethyl- cellulose solution. Fiftyimages were averaged to eliminate the projection artifacts. The acquired SD-OCT images were quantitativelyanalyzed using the InSightsoftware program (PhoenixResearch Labs) after segmentation of each sublayer was manually performed bythe researchers (KY,RT, NM, and MN). During all experimental procedures, the physical condition of the rats was frequentlymonitored byinspection and gentle palpation bythe researchers.
2.3. The Analysis of the Retinal Layer Thickness (Segmenta- tion). We measured the thickness of the inner (A), the outer (B), and the photoreceptor (C) sublayers of the neural retina and the combined retinal pigment epithelium (RPE) and choroid layers (D, Figure 1(a), S 1). The definition of each layer was in line with previous reports [7, 8]. In brief, the inner layerAconsisted of the retinal nerve fiber layer (NFL), the ganglion cell layer (GCL), the inner plexiform layer (IPL), and the inner nuclear layer (INL); the outer layer B includes the outer plexiform layer (OPL) and outer nuclear layer (ONL);
and the photoreceptor rod and cone layer C consists of the photoreceptor inner segment (IS) and outer segment (OS) layers (Supplementaryimage 1).
As described in the previous section, the borderlines between each retinal sublayer were manuallyidentified and segmented by the researchers. The average distance (𝜇m) between each borderline was then calculated using the raw data summarized from the InSightsoftware program. We used the averagevalue of the data obtained from both eyes of the same animal and counted it as one observation. The overall average retinal layer thickness was presented as the mean ± standard error. The number of rats used in each measurement is described in Table 1 and Figure 4.
2.4. Histological Examination. Histological examinations were performed using eyes enucleated from S334ter rats on
A B
C D
EZ
EZ IZ
IZ
(a)
A B
DC
(b)
(c) (d)
(e)
(f) (g)
(h) (i)
(j)
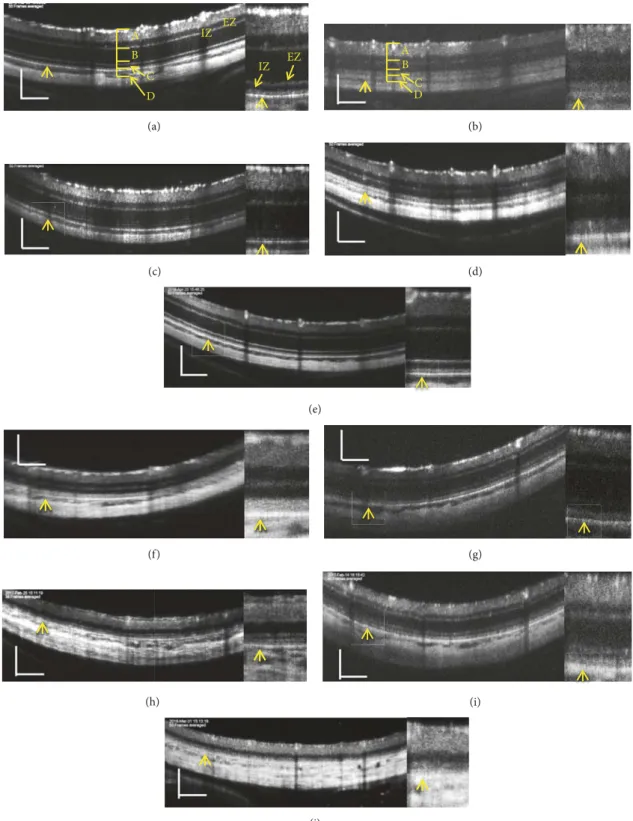
Figure 1:Representative pictures of spectral domain optical coherence tomography(SD-OCT) images of SD rats (a, c, e, g, and i) and S334ter rats (b, d, f, h, and j). (a)An SD rat onP19. (b)An S334ter rat onP19. (c)An SD rat onP22. (d)An S334ter rat onP21. (e)An SD rat onP33.
(f)An S334ter rat onP34. (g)An SD rat onP82. (h)An S334ter rat onP87. (i)An SD rat onP134. (j)An S334ter rat onP110. The right side panel of each picture is a magnified image.Abbreviations:A, retinal inner layer; B, retinal outer layer; C, photoreceptor rod and cone layer; D, combined retinal pigment epithelium (RPE) and choroid layers; EZ, inner segment ellipsoid zone; IZ, interdigitation zone.Arrows indicate theRPE layer. Bar indicates 100𝜇m.
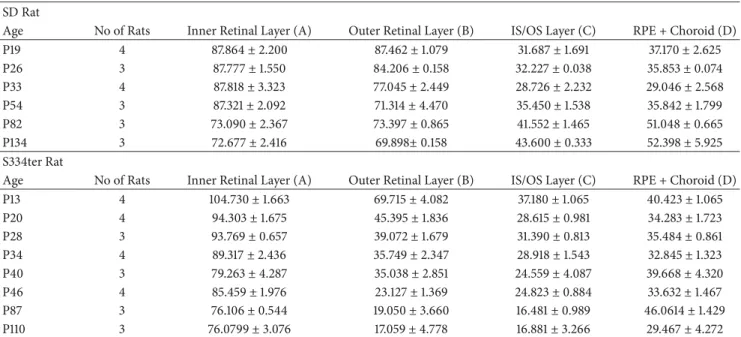
Table 1:Retinal layer thickness (𝜇m) of SD and S334ter rats.
SDRat
Age No ofRats InnerRetinal Layer (A) OuterRetinal Layer (B) IS/OS Layer (C) RPE + Choroid (D)
P19 4 87.864±2.200 87.462±1.079 31.687±1.691 37.170±2.625
P26 3 87.777±1.550 84.206±0.158 32.227±0.038 35.853±0.074
P33 4 87.818±3.323 77.045±2.449 28.726±2.232 29.046±2.568
P54 3 87.321±2.092 71.314±4.470 35.450±1.538 35.842±1.799
P82 3 73.090±2.367 73.397±0.865 41.552±1.465 51.048±0.665
P134 3 72.677±2.416 69.898±0.158 43.600±0.333 52.398±5.925
S334terRat
Age No ofRats InnerRetinal Layer (A) OuterRetinal Layer (B) IS/OS Layer (C) RPE + Choroid (D)
P13 4 104.730±1.663 69.715±4.082 37.180±1.065 40.423±1.065
P20 4 94.303±1.675 45.395±1.836 28.615±0.981 34.283±1.723
P28 3 93.769±0.657 39.072±1.679 31.390±0.813 35.484±0.861
P34 4 89.317±2.436 35.749±2.347 28.918±1.543 32.845±1.323
P40 3 79.263±4.287 35.038±2.851 24.559±4.087 39.668±4.320
P46 4 85.459±1.976 23.127±1.369 24.823±0.884 33.632±1.467
P87 3 76.106±0.544 19.050±3.660 16.481±0.989 46.0614±1.429
P110 3 76.0799±3.076 17.059±4.778 16.881±3.266 29.467±4.272
Values indicate mean±standard error.
No, number.
P22, P36, and P61 and SD rats on P69. Immediately after euthanasia by inhalation of 100% carbon dioxide, the eyes were excised under a microscope. To prevent the possi- bility of artificial retinal detachment occurring during fur- ther processing, an aliquot of 2% glutaraldehyde and 2%
paraformaldehyde solution at pH 7.4 was injected into the anterior chamber through the corneal limbus.After fixation in the same solution for 2 h at room temperature, the eyeballs were refixed in 4% paraformaldehyde solution at pH 7.0 for 24 h at 4∘C.Paraffin embedding, sectioning, and staining with hematoxylin and eosin (HE) were performed as previously described [7, 8]. The HE sections were photographed under a light microscope (DP-71, Olympus, Tokyo, Japan). The histological findings were compared to the corresponding findings from SD-OCT images.
2.5. Electron Microscopy. Electron microscopy was per- formed using eyes enucleated from S334ter rats onP22,P36, andP61 and from SD rats onP69 according to a previously described method [7, 8]. The eye contralateral to that used for histological examination was examined under an electron microscopy. Immediately after enucleation, the eyes were fixed with 2.5% glutaraldehyde and 2% paraformaldehyde solution at pH 7.4 for 24 h at 4∘C. Similarlyto the histological processing, an aliquot of the same fixation solution that was used for the histological studywas injected into the anterior chamber. The retina and choroid were dissected out, postfixed in phosphate buffered 1% osmium tetroxide at pH 7.4 for 3 h at 4∘C, dehydrated in an ascending series of ethanol series (50%-100%), and embedded in epoxyresin. Thin sections (80-90 nm) were stained in uranyl and lead salt solutions.
The sections were photographed bya transmission electron microscope (H-7600, Hitachi, Tokyo,Japan) at 100 kV.
2.6. Electroretinography (ERG). ERG was performed using a MicronGanzfeld ERG system (PhoenixResearch Labs) according to the manufacturer’s instructions, with some modifications. In brief, the light stimulus was fixed at 3.0 cd.s/m2, after the stimulus-dependent manner in responses was confirmed bychanging the stimulation from 3.0 to 30.0 cd.s/m2 in a group of control rats according to the ICEV standard [18]. ERG was recorded at 5 time points starting fromP17 toP110 for S334ter rats and at 6 time points fromP19 toP112 for SD rats. The rats were dark-adapted for at least 24 h and then anesthetized bythe same method for the SD-OCT examination.Areference electrode was placed in the center of the scalp, and a ground electrode was placed in the proximal portion of the tail skin. During the measurement, the body temperature was maintained at 37∘C, using a bodywarmer.
The pupils were dilated byeye drops containing a mixture of 0.5% tropicamide and 0.5% phenylephrine hydrochlo- ride.After the corneal surface was anesthetized using 0.4%
oxybuprocaine hydrochloride eye drops, a contact-lens elec- trode (Micron Ganzfeld ERG; Phoenix Research Labs) was applied directlyto the corneal surface. We defined the negative wave just after light stimulation as the a-wave and the most positive peak of the oscillatorypotentials as the b- wave. The averages of twentyresponses (stimulus interval = 10 s) of both a- and b-waves were used for further analyses.
Similarlyto the SD-OCT segmentation analysis, we evaluated three or four rats and used the averagevalue of both eyes of the same rat as one observation. The number of rats used in each measurement is described in Table 2 and Figure 5.
2.7. Statistical Analyses. All of the statistical analyses were performed using the SPSS software program (version 25, StatisticalPackage for the Social Sciences, Chicago, IL, USA).
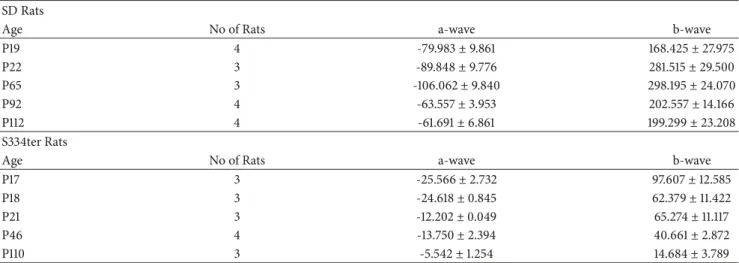
Table 2: ERG amplitudes (𝜇V) of SD and S334ter rats.
SDRats
Age No ofRats a-wave b-wave
P19 4 -79.983±9.861 168.425±27.975
P22 3 -89.848±9.776 281.515±29.500
P65 3 -106.062±9.840 298.195±24.070
P92 4 -63.557±3.953 202.557±14.166
P112 4 -61.691±6.861 199.299±23.208
S334terRats
Age No ofRats a-wave b-wave
P17 3 -25.566±2.732 97.607±12.585
P18 3 -24.618±0.845 62.379±11.422
P21 3 -12.202±0.049 65.274±11.117
P46 4 -13.750±2.394 40.661±2.872
P110 3 -5.542±1.254 14.684±3.789
Values indicate mean±standard error.
No, number.
The segmentation data from the two groups were compared using a two-way repeated analysis of variance (two-way repeated ANOVA) after the normalityand equalityof each distribution were confirmed by the Shapiro-Wilk test and Levene’s test, respectively. Similar post hoc analyses using Tukey’s t-test were performed between similar age-groups (S334tervs. SD:P19vs.P19,P28vs.P26,P34vs.P33,P46vs.
P54,P87vs.P82, andP110vs.P134, respectively) for SD-OCT segmentation. Similarpost hocanalyses using Turkey’st-test were performed to compare the a- and b-wave amplitudes and the implicit times of a-waves between the two groups (three pairs of age-matched rat groups; S334tervs SD:P18vs P19,P21vsP22, andP110vsP112, respectively).Pvalues<0.05 were considered to indicate statistical significance.
3. Results
3.1. The SD-OCT Findings in SD Rats. The typical SD-OCT findings in SD rats are shown in Figures 1(a), 1(c), 1(e), 1(g), and 1(i). The retinal sublayersA−D and the zones equivalent to the photoreceptor inner segment ellipsoid zone (EZ) and the interdigitation zone (IZ) in human SD-OCT [18] were clearly identified in these pictures (S 1, 2, 3). These basic structures consistentlyappeared in the SD-OCT images from SD rats fromP19 toP134.
3.2. The Qualitative Analyses of the SD-OCT Findings in rela- tion to the Photoreceptor Structure in the Rhodopsin S334ter Transgenic Rats (Line 4). We analyzed the SD-OCT images of the S334ter rats (line 4) to qualitatively characterize the SD-OCT findings in S334ter rats. Typical SD-OCT findings obtained fromP19 toP110 are shown in Figures 1(b), 1(d), 1(f), 1(h), and 1(j). In S334ter rats, the retinal sublayer C corresponding to the photoreceptor inner and outer segments became diffuselyhyperreflective and did not show a distinc- tive EZ or IZ, even onP19 (Figure 1(b), S 4). This tendency was consistent from at leastP19 toP110 (Figures 1(b), 1(d), 1(f), 1(h), and 1(j); S 4, 5). In addition, the retinal sublayer
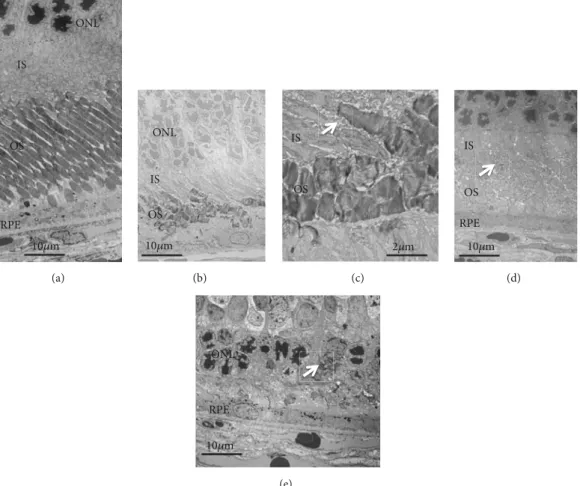
B, namely, the outer nuclear layer, became progressively thinner and was recognized as a dark linear zone on the SD-OCT images obtained on P87 and P110 (Figures 1(h) and 1(j); S 4, 5). Conversely, the retinal sublayer A (inner layer) appeared to be consistent throughout the observation periods. On comparing these findings to the histological findings obtained from the S334ter rats onP22,P36, andP61 and from SD rats on P69 (Figure 2), despite the regularly arranged appearance of the photoreceptor inner and outer segments observed in the SD rat (Figure 2(a)), over time, their regularity was gradually lost in the S334ter rats, and the photoreceptor layer became progressively degenerated (Figures 2(b), 2(c), 2(d), and 2(e)). Moreover, there were some areas in which the chromatin densitybecame weak and in which aggregation was observed in the outer nuclear layer, suggesting the gradual progression of cell death mechanisms (Figure 2(c)). Electron microscopyrevealed that although the photoreceptor inner and outer segments appeared regularly arranged in the SD rat (Figure 3(a)), the structure of the outer segment was severely deteriorated, even on P22, and that the photoreceptor layer became thin (Figures 3(b) and 3(c)).
In Figures 3(b) and 3(c), the length of the outer segment became extremely short in comparison to that in the SD rats (Figure 3(a)) and each outer segment was disoriented, despite the fact that the discs were relativelywell-packed. In addition, there were numerous granule-like materials in the interphotoreceptor matrix (extracellularvesicles, Figure 3(c), arrow). This tendencywas also observed in the image from P36 (Figure 3(d), arrow). Furthermore, the basic structure of the inner and outer segments almost disappeared until P61, and granular materials with a high electron density were observed in the photoreceptor cells (Figure 3(e), arrow).
These degenerative changes that occurred in the photorecep- tor inner and outer segment layer seemed to contribute to the diffuse hyperreflective changes and the loss of EZ and IZ seen in the SD-OCT images of the S334ter (line 4) rats.
3.3. The Quantitative Analyses of the SD-OCT Findings from the S334ter Transgenic Rats (Line 4). The longitudinal
50m 1
2 3 4 5 6
7 8
(a)
50m
(b)
20m
(c)
50m
(d)
50m
(e)
Figure 2: The histological findings of the SD and S334ter rats (hematoxylin and eosin staining). (a)An SD rat onP69. (b)An S334ter rat onP22. (c) The same rat as panel B (high magnification).Arrow indicates an area of reduced chromatin density. (d) The S334ter rat onP36.
The S334ter rat onP61. The numeral indicates each retinal layer: 1, nerve fiber layer; 2, ganglion cell layer; 3, inner plexiform layer; 4, inner nuclear layer; 5, outer plexiform layer; 6, outer nuclear layer; 7, photoreceptor rod and cone layer; 8, retinal pigment epithelium and choroid.
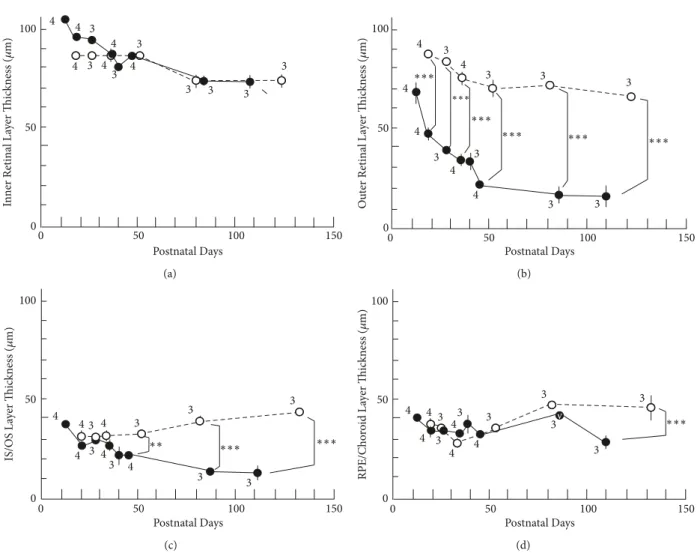
changes in the thickness of the retinal sublayer are shown in Table 1 and Figure 4. There was no statisticallysignificant difference in the thickness of the sublayer A between the S334ter and SD rats at any point (Figure 4(a)). However, there were statistically significant differences in the thick- ness of sublayer B between the two groups throughout the observation periods fromP19 (Figure 4(b)).On comparing this finding to the SD-OCT images, the rapid decrease in the thickness of the outer nuclear layer contributed to the phenomenon (Figure 2). In sublayer C, the thickness of the photoreceptor inner and outer segments of the S334ter rats became significantly thinner in comparison to the SD rats afterP45 (Figure 4(c)). This tendencycorresponded to what we observed in the historical and ultrastructural findings (Figures 2 and 3). In addition, a statistically significant difference was observed in the thickness of sublayer D of the S334ter rats onlyonP110 (Figure 4(d)).AfterP110, when the photoreceptor inner and outer segments had alreadybecome severelydegenerated in the S334ter rats, the thickness of the combinedRPE and choroid became significantlythinner in comparison to the SD rats.
3.4. The Relationship between the SD-OCT Findings and the ERG Findings in the S334ter Transgenic Rats (Line 4). The longitudinal changes in the amplitudes of both the a- and b- waves on ERG are presented in Table 2 and Figure 5. In the a- wave of S334ter rats, the amplitude was significantlyreduced in comparison to SD rats at all points afterP19 (Figure 5(a)).
Similarly, the amplitude of the b-wave in S334ter rats was significantly decreased after P22; however, the difference on P19 was not statistically significant (Figure 5(b)). The deterioration in the a-wave appeared to start earlier than the rapid reduction in the thickness of the sublayer B (Figures
4(b) and 5(a)). On the contrary, the implicit times of a- waves were relatively well maintained up toP46 (Table 2).
There was no statistical significance in the implicit times of a-waves between S334ter and SD rats at P18 vs P19 (P = 1.000),P21vsP22 (P= 1.000), andP46vsP65 (P= 0.993), re- spectively, although there was significant difference between S334ter and SD rats atP110vsP112 (P<0.001, Turkeyt-test).
Representative ERG findings are presented in Figure 6. While the waveforms of the SD rats were consistent throughout the observation periods, those in the S334ter rats progressively deteriorated and finallydisappeared onP110 (Figure 6; S 6, 7).
4. Discussion
In the present study, we characterized the SD-OCT findings observed during the processes of retinal degeneration in rhodopsin S334ter transgenic rats (line 4) in relation to the histological, ultrastructural, and ERG features.Although the SD-OCT findings related to retinal degeneration in rhodopsin P23H transgenic rats (lines 1 and 2) were pre- viouslyreported [8, 10, 11], there have been no reports on retinal degeneration in S334ter rats except for the TD-OCT findings of S334ter rats (line 3) [16]. Because the molecular mechanisms of the photoreceptor cell death are reportedly different between theP23H (Class 2) and the S334ter (Class 1) rhodopsin mutations [19, 20], it is interesting to determine whether there are any differences in the SD-OCT findings and their relationships with morphological and electrophysi- ological features during the processes of retinal degeneration between these two mutations. In the Class 2 rhodopsin muta- tions, because the mutations are located in the N-terminal (intradiscal) portion, proper molecular folding is impaired
10m IS
OS
ONL
RPE
(a)
10m IS OS
ONL
(b)
2m IS
OS
(c)
10m IS
OS RPE
(d)
10m ONL
RPE
(e)
Figure 3: The electron microscopic findings of SD and S334ter rats. (a)An SD rat onP69. (b)An S334ter rat onP22. (c) The same rat as panel (b) (high magnification).Arrows in (c) and (d) indicate extracellular granules. (d) The S334ter rat onP36. (e) The S334ter rayonP61. The arrow in (e) indicates an area of intracellular granule accumulation.Abbreviations,ONL, outer nuclear layer; IS, inner segment;OS, outer segment;RPE, retinal pigment epithelium.
during translation and, consequently, unfolded rhodopsin molecules accumulated in the endoplasmic reticulum (ER), resulting in severe ERstress [21]. In contrast, in Class 1 muta- tions, because of the defective trafficking signals in the C- terminal portion, rhodopsin mutants show defective integra- tion into the disc membrane, which resulted in the accumula- tion of mislocalized rhodopsin mutants in the inner segment, outer nuclear layer, and synaptic terminus, findings that were reported from studies using several models of Class 1 mutants [5, 22, 23]. Although the accumulated rhodopsin mutant molecules are excreted into the interphotoreceptor matrix as extracellularvesicles, retinal photoreceptor cell death rapidly occurs [5, 23, 24]. In addition, because photoreceptor degen- eration proceeded, even under without light stimulation, the intra- and extracellular accumulation of the rhodopsin mutants mayplayroles in cell death [24].
In a previous studyusingP23H rats, SD-OCT was sensi- tive enough to detect even slight disarrangement of the disc structures in the outer segments [8]. Because photoreceptor degeneration progresses much faster and more severelyin S334ter rats than inP23H rats, we concluded that the changes occurred in the photoreceptor layer of S334ter rats; i.e., the
disoriented and short outer segments and aggregated extra- cellularvesicles were detected on SD-OCT images as a diffuse hyperreflective zone without any obvious EZ or IZ struc- tures (Figure 1). However, contraryto our expectations, be- cause the abnormal SD-OCT findings in the photoreceptor layer were common between theP23H and the S334ter rats, we could not differentiate between the retinal degeneration caused by P23H or S334ter based on SD-OCT images alone.
In addition, because we previouslyreported that the SD-OCT images of retinal degeneration in RCS rats were also char- acterized bya diffuse hyperreflective zone in the inner and outer segment layer [7], we concluded that the degenerative changes in the inner and/or outer segments were associated with a loss of optical uniformityand, consequently, caused scattering and hyperreflection which were detected bySD- OCT; these SD-OCT findings maybe observed withvarious causative gene mutations.
In ERG, the amplitudes of both the a- and b-waves were severelydeteriorated in the S334ter rats (Figure 6). This sever- itydid not correspond with the SD-OCT findings, because the thickness of the sublayer B in the S334ter rats was reduced byan average of 51.903% in comparison to SD rats onP20
0 50 100 150 Postnatal Days
100
50
Inner Retinal Layer Thickness (m)
0 4
4 4
4 4
4 3
3 3
3
3 3 3
3
(a)
0 50 100 150
Postnatal Days 100
50
Outer Retinal Layer Thickness (m)
0 4
4
4
4 4 4
3 3
3 3
3
3 3 3
∗∗∗ ∗∗∗
∗∗∗
∗∗∗
∗∗∗
∗∗∗
(b)
4 4 4 4 4
3 3
3 3 3
3 3 3
IS/OS Layer Thickness (m) 4 100
50
00 50
Postnatal Days
100 150
∗∗ ∗∗∗ ∗∗∗
(c)
0 50 100 150
Postnatal Days 100
50
RPE/Choroid Layer Thickness (m)
v
0
4 4 4 4 4 4
3
3 3 3
3 3
3 3
∗∗∗
(d)
Figure 4: The longitudinal changes in the thicknesses of retinal sublayers.Open circles, SD rats; closed circles, S334ter rats. (a) Thickness changes in the inner retinal sublayer. (b) The thickness of the outer retinal sublayer. (c) The thickness of the photoreceptor inner and outer (IS/OS) sublayer. (d) The thickness of the combinedRPE and choroid sublayer. Statistical significance:∗∗,P<0.01;∗ ∗ ∗,P<0.001 (Turkey’s t-test). Bars indicate standard error. The numeral alongside each circle indicates the number of rats used for each measurement.
0 50 100 150
Postnatal Days
−100
−50
a-wave amplitude (V)
0
4 4
4 4
3
3
3 3
3 3
∗∗∗
∗∗∗
∗∗∗
v
(a)
0 50 100 150
Postnatal Days 200
100
b-wave amplitude (V)
300
v v
v v v NS
0 4
4
4 4
3
3 3
3
3 3
∗∗∗
∗∗∗
(b)
Figure 5: Longitudinal changes in the amplitudes of the a- and b-waves on ERG.Open circles, SD rats; closed circles, S334ter rats. (a) The longitudinal changes in the a-wave. (b) The longitudinal changes in the b-wave. Statistical significance: NS, not significant,∗ ∗ ∗,P<0.001 (Turkey’st-test). Bars indicate standard error. The numeral alongside each circle indicates the number of rats used for each measurement.
SD P22 SD P65 SD P112
S334ter P21 S334ter P46 S334ter P110
100V 100V 100V
100V 100V 100V
a a a
a
a a
b b b
b b
b
Figure 6:Representative ERG waveforms of the SD and S334ter rats. The upper panels show ERG waveforms of SD rats onP22,P65, andP112, respectively. The lower panels show ERG waveform of S334ter rats onP21,P46, andP110, respectively.Abbreviations: a, a-wave; b, b-wave.
while there was no significant difference in the thicknesses of the sublayer C (Figure 4). In contrast, the amplitudes of the a-wave in the S334ter rats onP19 had alreadydecreased byan average of 35.566% in comparison to that observed in the SD rats (Figure 5). This result in the S334ter rats was different from what we previouslyobserved inP23H rats (line 2), in which the thickness of the sublayer B was correlated with the amplitudes of both the a- and b-waves [8]. These observations suggest that the functional damage of the photoreceptors in the S334ter rats is more severe than what can be estimated from measuring the thickness of the retinal sublayers and that the pathological and qualitative damages in the photore- ceptors should be considered. As for the implicit times of a-waves, theywere relativelymaintained in the S334ter rats untilP46 and theybecame deteriorated towardP110.Previ- ously, we found similar longitudinal changes of ERG in the P23H (line 2) rats [8]. It is possible that the relative preserva- tion of the implicit times of a-waves is one of characteristics of the retinal degeneration associated with mutations in the rhodopsin genes.
In conclusion, the SD-OCT assessments of S334ter trans- genic rats (line 4) demonstrate the qualitative abnormalities in photoreceptor degeneration as the diffuse hyperreflective changes in the inner and outer segment layer and the loss of the EZ and IZ; these changes indicate the deterioration of the inner and outer segments and the accumulated extracellular vesicles. In addition, the OCT examinations provide quan- titative information that demonstrates the progressive thin- ning of the outer nuclear layer, the inner and outer segment layer, and theRPE and choroid layer. The functional aspect should be estimated bythe combination of both quantitative and qualitative changes in the retinal components. The results
obtained in the present studycan be applied in the clinical field when the pathologic stage needs to be estimated in patients withRPassociated with mutations in the rhodopsin gene.
Data Availability
The data used to support the findings of this studyare avail- able from the corresponding author upon request.
Conflicts of Interest
The authors declare that theyhave no conflicts of interest.
Acknowledgments
The present studywas supported, in part, bythe Grant-in- Aid for ScientificResearch (C-16K11313, Mitsuru Nakazawa) and the Grant-in-Aids for Young Scientists (B-17K16954, Natsuki Monai, and B-17K16955, Shizuka Takahashi) from Japan Societyfor thePromotion of Science (Tokyo,Japan).
The authors thank Mr. Brian Quinn for his English editing.
Supplementary Materials
Supplementaryimage 1 (S 1): definition of retinal sublayers A, B, C, and D, ELM, EZ, and IZ, and comparison be- tween a representative SD-OCT image and histological find- ings.Abbreviations: ELM, external limiting membrane; EZ, inner segment ellipsoid zone; IZ, interdigitation zone. Sup- plementaryimage 2 (S 2): representativeOCT images of four eyes of SD rats atP19,P26, andP33, respectively. Bars indicate
100𝜇m. Supplementary image 3 (S 3): representative OCT images of four eyes of SD rats atP54,P82, andP134, respec- tively. Bars indicate 100𝜇m. Supplementary image 4 (S 4):
representativeOCT images of four eyes of S334ter transgenic rats at P13, P20, P28, and P34, respectively. Bars indicate 100𝜇m. Supplementary image 5 (S 5): representative OCT images of four eyes of S334ter transgenic rats atP40,P46,P87, andP110, respectively. Bars indicate 100𝜇m. Supplementary image 6 (S 6): representative ERG waves of three eyes of SD rats atP19,P22,P65,P92, andP112, respectively.Arrows indicate the time point of light stimulation. Bars indicate 100ms. The y-axis shows amplitude in 𝜇V. Supplementary image 7 (S 7): representative ERG waves of three eyes of S334ter transgenic rats atP17,P18,P21,P46, andP110, respec- tively. Arrows indicate the time point of light stimulation.
Bars indicate 100ms. The y-axis shows amplitude in 𝜇V.
(Supplementary Materials)
References
[1] D. T. Hartong, E. L. Berson, and T.P. Dryja, “Retinitis pigmen- tosa,”The Lancet,vol. 368, no. 9549, pp. 1795–1809, 2006.
[2] M.Oishi,A.Oishi, N. Gotoh et al., “Comprehensive molecular diagnosis of a large cohort ofJapanese retinitis pigmentosa and Usher syndrome patients bynext-generation sequencing,”In- vestigative Ophthalmology & Visual Science,vol. 55, no. 11, pp.
7369–7375, 2014.
[3] M.A. Sandberg, C. Weigel-DiFranco, T.P. Dryja, and E. L. Ber- son, “Clinical expression correlates with location of rhodop- sin mutation in dominant retinitis pigmentosa,”Investigative Ophthalmology & Visual Science,vol. 36, no. 9, pp. 1934–1942, 1995.
[4] E. L. Berson, B.Rosner, C. Weigel-DiFranco, T.P. Dryja, and M.
A. Sandberg, “Disease progression in patients with dominant retinitis pigmentosa and rhodopsin mutations,” Investigative Ophthalmology & Visual Science,vol. 43, no. 9, pp. 3027–3036, 2002.
[5] I. Nemet,P.Ropelewski, and Y. Imanishi, “Rhodopsin traffick- ing and mistrafficking: Signals, molecular components, and me- chanisms,” Progress in Molecular Biology and Translational Science,vol. 132, pp. 39–71, 2015.
[6] E. S. Green, M. D. Menz, M. M. LaVail, and J. G. Flannery,
“Characterization of rhodopsin mis-sorting and constitutive activation in a transgenic rat model of retinitis pigmentosa,”
Investigative Ophthalmology & Visual Science,vol. 41, no. 6, pp.
1546–1553, 2000.
[7] K.Adachi, S. Takahashi, K. Yamauchi et al., “Optical Coherence TomographyofRetinal Degeneration inRoyal College of Sur- geons Rats and Its Correlation with Morphology and Elec- troretinography,”PLoS ONE,vol. 11, no. 9, 2016.
[8] N. Monai, K. Yamauchi,R. Tanabu et al., “Characterization of photoreceptor degeneration in the rhodopsinP23H transgenic rat line 2 using optical coherence tomography,”PLoS ONE,vol.
13, no. 3, 2018.
[9] A. Berger, S. Cavallero, E. Dominguez et al., “Spectral-Domain Optical Coherence Tomographyof theRodent Eye: Highlight- ing Layers of the OuterRetina Using Signal Averaging and Comparison with Histology,”PLoS ONE,vol. 9, no. 5, p. e96494, 2014.
[10] N. Cuenca, L. Fem´andez-S´anchez, Y. Sauv´e et al., “Correlation between SD-OCT, immunocytochemistryand functional find- ings in an animal model of retinal degeneration,”Frontiers in Neuroanatomy,vol. 8, no. 151, 2014.
[11] E. Orhan, D. Dalkara, M. Neuill´e et al., “Genotypic and Phenotypic Characterization ofP23H Line 1Rat Model,”PLoS ONE,vol. 10, no. 5, 2015.
[12] H.O. Ikeda, N. Sasaoka, M. Koike et al., “Novel VCPmodulators mitigate major pathologies of rd10, a mouse model of retinitis pigmentosa,”Scientific Reports,vol. 4, 2014.
[13] E. S. Levine,A. Zam,P. Zhang et al., “Rapid light-induced acti- vation of retinal microglia in mice lackingArrestin-1,”Vision Research,vol. 102, pp. 71–79, 2014.
[14] R. C.Ryals, M. D.Andrews, S. Datta et al., “Long-term charac- terization of retinal degeneration in royal college of surgeons rats using spectral-domain optical coherence tomography,”
Investigative Ophthalmology & Visual Science,vol. 58, no. 3, pp.
1378–1386, 2017.
[15] B.Arango-Gonzalez, D. Trifunovi´c,A. Sahaboglu et al., “Iden- tification of a Common Non-Apoptotic Cell Death Mechanism in Hereditary Retinal Degeneration,”PLoS ONE,vol. 9, no. 11, 2014.
[16] B. B. Thomas, S.Arai, Y. Ikai et al., “Retinal transplants evaluated byoptical coherence tomographyin photoreceptor degenerate rats,”Journal of Neuroscience Methods,vol. 151, no. 2, pp. 186–
193, 2006.
[17] M. E.Pennesi, S. Nishikawa, M. T. Matthes, D. Yasumura, and M. M. LaVail, “The relationship of photoreceptor degeneration to retinalvascular development and loss in mutant rhodopsin transgenic andRCS rats,”Experimental Eye Research,vol. 87, no.
6, pp. 561–570, 2008.
[18] M. F. Marmor,A. B. Fulton, G. E. Holder, Y. Miyake, M. Bri- gell, and M. Bach, “ISCEV Standard for full-field clinical elec- troretinography(2008 update),”Documenta Ophthalmologica, vol. 118, no. 1, pp. 69–77, 2009.
[19] J. Kaur, S. Mencl,A. Sahaboglu et al., “Calpain andPARP Activa- tion during Photoreceptor Cell Death in P23H and S334ter Rhodopsin MutantRats,”PLoS ONE,vol. 6, no. 7, 2011.
[20] M. Nakazawa, “Therapy options for retinitis pigmentosa,”
Expert Opinion on Orphan Drugs,vol. 2, no. 1, pp. 37–52, 2014.
[21] H. F. Mendes, J. Van Der Spuy, J. P. Chapple, and M. E.
Cheetham, “Mechanisms of cell death in rhodopsin retinitis pigmentosa: Implications for therapy,” Trends in Molecular Medicine,vol. 11, no. 4, pp. 177–185, 2005.
[22] K. H. Lodowski,R. Lee,P.Ropelewski, I. Nemet, G. Tian, and Y.
Imanishi, “Signals governing the trafficking and mistrafficking of a ciliaryGPCR, rhodopsin,”The Journal of Neuroscience,vol.
33, no. 34, pp. 13621–13638, 2013.
[23] T. Li, W. K. Snyder,J. E.Olsson, and T.P. Dryja, “Transgenic mice carrying the dominant rhodopsin mutationP347S: Evi- dence for defectivevectorial transport of rhodopsin to the outer segments,”Proceedings of the National Acadamy of Sciences of the United States of America,vol. 93, no. 24, pp. 14176–14181, 1996.
[24] F. Concepcion andJ. Chen, “Q334ter mutation causes mislocali- zationof rhodopsin molecules that are catalytically active:A mouse model of Q344ter-induced retinal degeneration,”PLoS One,vol. 5, 2015.
Stem Cells International
Hindawi
www.hindawi.com Volume 2018
Hindawi
www.hindawi.com Volume 2018
INFLAMMATION
Endocrinology
International Journal of
Hindawi
www.hindawi.com Volume 2018
Hindawi
www.hindawi.com Volume 2018
Disease Markers
Hindawi
www.hindawi.com Volume 2018
BioMed
Research International
Oncology
Journal of
Hindawi
www.hindawi.com Volume 2013
Hindawi
www.hindawi.com Volume 2018
Oxidative Medicine and Cellular Longevity
Hindawi
www.hindawi.com Volume 2018
PPAR Research
Hindawi Publishing Corporation
http://www.hindawi.com Volume 2013
Hindawi www.hindawi.com
The Scientific World Journal
Volume 2018
Immunology Research
Hindawi
www.hindawi.com Volume 2018
Journal of
Obesity
Journal of
Hindawi
www.hindawi.com Volume 2018
Hindawi
www.hindawi.com Volume 2018
Computational and Mathematical Methods in Medicine
Hindawi
www.hindawi.com Volume 2018
Behavioural Neurology Ophthalmology
Journal of
Hindawi
www.hindawi.com Volume 2018
Diabetes Research
Journal of
Hindawi
www.hindawi.com Volume 2018
Hindawi
www.hindawi.com Volume 2018
Research and Treatment
AIDS
Hindawi
www.hindawi.com Volume 2018
Gastroenterology Research and Practice
Hindawi
www.hindawi.com Volume 2018
Parkinson’s Disease
Evidence-Based Complementary and Alternative Medicine
Volume 2018 Hindawi
www.hindawi.com