GEOGRAPHICAL REPORTS
OF TOKYO METROPOLITAN UNIVERSITY 53 (2018) 1-11
AMOUNT OF WINTERTIME NOCTURNAL AIR HEATING OVER THE TOKYO METROPOLITAN AREA
Ko NAKAJIMA and Hideo TAKAHASHI
Abstract The amount of excessive nocturnal atmospheric heat in winter in a central urban area of the Tokyo metropolis was estimated from the vertical potential temperature distribution at the Tokyo Tower in the Minato Ward in the central Tokyo metropolis and Sky Tower West Tokyo in Nishi-Tokyo city in the western suburb of Tokyo. Approximately 60% of the clear and weak wind nights exhibited a coincident point approximately 120 m above ground level (AGL) at which the non-urban potential temperatures were equal to the urban potential temperatures. Based on the heat budget analysis of the air column moving from the non-urban to urban areas via nocturnal land breezes, it was estimated that the heating by the downward sensible heat flux due to vertical mixing is larger than the upward sensible heat flux from the urban surface. This result based on the observation data suggests that the contribution of vertical mixing is more important than that of heating from the urban surface on the formation of the nocturnal urban heat island of the Tokyo metropolis in winter.
Key words: surface layer, potential temperature, heat flux, vertical mixing
1. Introduction
Urban heat islands (UHI) are known to be a local scale atmospheric phenomenon where the surface level temperature in an urban area is higher than that of the surrounding non-urban areas.
UHIs, in general, develop more markedly during nighttime than daytime (Oke and Maxwell 1975) . The nighttime temperature difference between urban and non-urban areas decreases with height, and the temperature in urban areas becomes lower than that in non-urban areas above the so-called coincident point. This phenomenon is known as a crossover (Bornstein 1968).
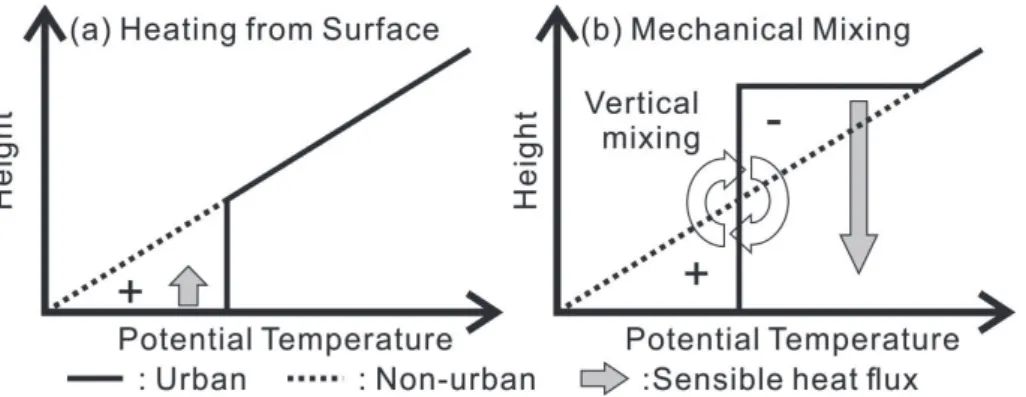
From the viewpoint of the atmospheric structure of the near surface layer, the formation process of the nighttime UHI has been discussed in terms of the vertical sensible heat flux or the vertical temperature profile as follows (Fig. 1): 1) the upward sensible heat flux from the urban surface from which the nocturnal temperature decreases is suppressed due to the existence of anthropogenic heat, weak radiative cooling (a small sky view factor), and the release of stored heat in surface constructs (Oke 1982), and 2) the occurrence of downward sensible heat flux is caused by vertical mixing of the surface inversion layer due to the large urban roughness (Tamiya and Ohyama 1981). Even though the potential temperatures are expected to increase in the near surface layer in both processes, the decrease in the potential temperature in the upper layer occurs corresponding to the lower layer temperature increase, i.e., the occurrence of downward sensible heat flux, in the process of
- 1 -
mechanical mixing due to the preservation of the amount of heat in the mixing layer. Both factors should affect the vertical potential temperature profiles. Observational studies conducted in some small- or middle-scale cities have suggested that mechanical vertical mixing contributes to nighttime UHI more conspicuously than does heating from the urban surface (e.g., Sakakibara 2001). However, it is not clear how much each factor contributes to the formation of UHIs of large-scale cities.
Fig. 1 Schematic illustration of the vertical potential temperature profiles over urban and non-urban areas for the cases of (a) heating from the surface and (b) mechanical mixing.
The symbol + (−) in the figure indicates that the potential temperature in the urban area is higher (lower) than that in the non-urban area.
The amount of excessive heat (Ԛ) below the coincident point (H) can be described as in eq. (1):
(1)
Where θu, z and θr, z are the potential temperature at z (m AGL) over the urban and rural areas, respectively, ρ is the mean air density (1.1 kg/m3) between the surface level and H, and Cp is the specific heat capacity of air at constant pressure (1004 J/kg/K).
The Tokyo metropolitan area is one of the most intensively urbanized areas in the world with the Tokyo Bay and the Kanto mountains located to the south and west of the area, respectively. Moreover, local scale circulations such as land–sea breezes frequently develop under clear and weak wind conditions. Several studies have estimated the amount of heat in the air column in this area during daytime in summer (e.g., Yoshikado et al. 2014; Sugawara et al. 2015). However, there are few studies that estimate the amount of excessive heat in the urban area compared to the non-urban areas during the night. In general, the depth of the mixing layer over an urban area at night is shallower than that during the day. The nocturnal boundary layer is more susceptible to heating from the surface and mechanical mixing than is the daytime layer (Bohnenstengel et al. 2011).
Temperature observations at multiple altitudes up to 250 m AGL on the Tokyo Tower (TT) have been conducted since the 1960's by the Tokyo Metropolitan Government. These observations are expected to map the vertical temperature profile below the coincident point of the urban area because the coincident point in Tokyo has been observed to be at approximately 200–300 m during nighttime (Saito 1977).
Q=ρCp∫0H (θu,z−θr,z) dz,
- 2 -
The purpose of this study is to estimate the amount of excessive nocturnal heat in the Tokyo metropolitan area compared to non-urban areas based on observation data. Furthermore, the contributions of heating from the urban surface and mechanical vertical mixing of the lower level inversion layer to the temperature increase in the urban area are examined.
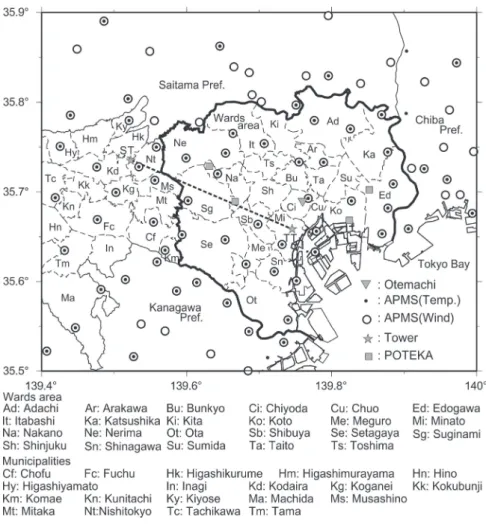
Fig. 2 Index map showing the target area and the distribution of observatories.
The thick line indicates the boundary of the Tokyo Wards area.
The section ST–TT corresponds to the horizontal axis in Fig. 6.
2. Data and Methods
To obtain the vertical temperature profile in a non-urban area, temperature data loggers (T&D Co.
Ltd., TR-52) with natural ventilation radiation shields were installed at multiple altitudes (10 m, 20 m, 40 m, 60 m, 90 m, and 125 m AGL) on the Sky Tower West Tokyo (ST) located approximately 20 km northwest of TT. Observations were carried out from November 17, 2016, to February 28, 2017.
- 3 -
In these observations, the temperatures were measured every 10 min. Moreover, two temperature data loggers with a time lag of 5 min were installed at each height to obtain temporally smoother values.
The average values of three data points at intervals of 5 min were used for the analysis. After the middle of December 2016, however, such 5-min interval data were no longer available at a few heights due to a thermometer malfunction; therefore, the average values of three data points at intervals of 10 min were used. Further, the data at a height of 60 m were missing after this date. In addition, to determine the wind speed below the coincident point, the wind speeds at ST (45 m, 80 m, 115 m, and 151 m AGL) measured every 10 min by Tanashi Tower Co., Ltd. were used. The temperatures at TT (4 m, 64 m, 103 m, 169 m, 205 m, and 250 m AGL) of the Air Pollution Monitoring Stations (APMS) were used to map the vertical temperature profile in the urban area. The air temperatures at TT were corrected using the same method proposed by Nakajima et al. (2018) using strong wind cases during the fiscal years of 2014 and 2015. The altitudes of the ST and the TT are 63 m and 21.5 m above sea level (ASL), respectively. In this study, the potential temperature was defined as the temperature of an air parcel that is brought to the ground surface at the TT via the dry adiabatic lapse rate (Γd = 0.976°C/100 m). The vertical potential temperature profiles at TT and ST were considered to be representative of the atmospheric conditions at the urban center and non-urban areas, respectively.
To calculate the difference in the potential temperature between the TT and the ST at the same height, the potential temperature was interpolated or extrapolated as follows. First, the potential temperature was interpolated at intervals of 10 m using the potential temperature of the two adjacent heights. The potential temperature at 0 m was then extrapolated using the two lowest heights. At midnight, the potential temperature linearly increased from near the ground to 125 m at the ST on clear and weak wind nights. Therefore, the potential temperature at the ST was extrapolated to 250 m assuming that the potential temperature gradient of the two highest heights was maintained up to 250 m. The precipitation, wind speed, and cloud amount data at the Tokyo Meteorological Station (Otemachi) of the Japan Meteorological Agency (JMA) were used to select cases of clear and weak wind nights. To determine the distribution of the air temperature and wind system, the temperature at 4 stations of POTEKA (Meisei Electric Co. Ltd.) and 64 stations of APMS and the wind speed and direction at 85 stations of APMS were employed. In this study, hourly values were used for the data analysis except for the 3-hourly data of the cloud amount. Figure 2 shows the distribution of the observatories mentioned above.
3. Results
Selection of clear and weak wind nights
Cases of clear and weak wind nights during the observation period were selected according to the weather conditions at Otemachi based on Nakajima et al. (2018). First, the cases with an accumulated precipitation from 1800 JST to 0800 JST (Japan Standard Time) of ≤ 0.0 mm and an average cloud amount at 1800 JST, 2100 JST, 0300 JST, and 0600 JST of ≤ 2.0 were selected as clear nights.
Second, the cases with an average scalar wind speed from 1800 JST to 0800 JST of ≤ 2.7 m/s were selected as weak wind nights. Finally, the cases where the number of hours where the wind direction was W–N (clockwise) from 2400 JST to 0600 JST was more than 3 hours were selected as nights
- 4 -
when the TT was located on the leeward side of the ST. As a result, 18 cases were selected as clear and weak wind nights (Table 1).
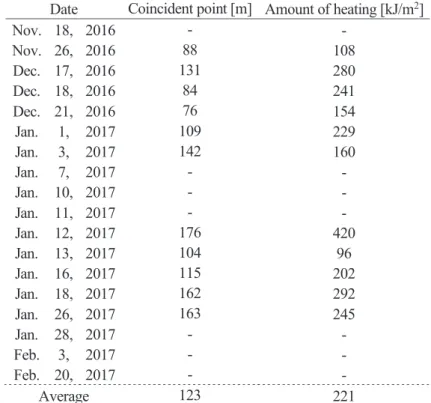
Table 1 Cases of clear and weak wind nights and a summary of the heights of the coincident points and the amounts of heating
Date Coincident point [m] Amount of heating [kJ/m2]
Nov. 18, 2016 - -
Nov. 26, 2016 88 108
Dec. 17, 2016 131 280
Dec. 18, 2016 84 241
Dec. 21, 2016 76 154
Jan. 1, 2017 109 229
Jan. 3, 2017 142 160
Jan. 7, 2017 - -
Jan. 10, 2017 - -
Jan. 11, 2017 - -
Jan. 12, 2017 176 420
Jan. 13, 2017 104 96
Jan. 16, 2017 115 202
Jan. 18, 2017 162 292
Jan. 26, 2017 163 245
Jan. 28, 2017 - -
Feb. 3, 2017 - -
Feb. 20, 2017 - -
Average 123 221
The date for each clear and weak wind night is the date after midnight.
“-” denotes cases in which the coincident point did not appear below 250 m.
Vertical potential temperature profiles over urban and rural areas and the amount of heat Figure 3 indicates the average potential temperature profiles at TT and ST from 0400 JST to 0600 JST on January 1, 2017. The difference in the potential temperature between the TT and the ST was approximately 3.5°C at the surface level. A strong inversion layer with a potential temperature gradient of approximately 4.1°C/100 m was present at the ST. Conversely, a strongly stable layer (3.1°C/100 m) from 205 m to the upper layer and a weakly stable layer (0.9°C/100 m) below 205 m were found at the TT. The potential temperatures at the TT and the ST were equal at approximately 100 m (the coincident point), and a crossover formed above this height. A coincident point below 250 m was observed in approximately 58% of the clear and weak wind nights (11 of 18 nights).
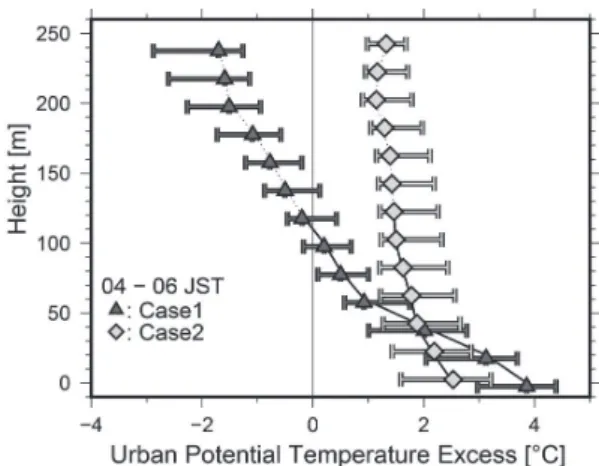
The vertical variation in the potential temperature difference between the TT and the ST averaged from 0400 JST to 0600 JST in the cases when the coincident point was found below 250 m (Case 1;
triangle) and the other cases (Case 2; diamond) are shown in Fig. 4. Because the potential temperature from 130 m to 250 m at the ST are extrapolated values, the potential temperature differences lower than 120 m and higher than 130 m are shown by the full and dashed lines, respectively. In Case 1, the
- 5 -
curves show a nearly linear decrease in the mean urban potential temperature excess from 4°C at the surface to zero at 120 m.
According to Bornstein (1968), a crossover was observed in New York City for more than two-thirds of the analyzed cases in which the summer season observations were included. In addition, the height of the coincident point was approximately 300 m on average. In Tokyo, Saito (1977) reported that a coincident point was observed at 200 m for the averaged vertical distribution of the potential temperature difference between urban (Otemachi) and non-urban (Machida and Koganei) areas in November 1974. Therefore, the frequency of crossover phenomena in this study is consistent that of other large cities (e.g., New York City) and its height is roughly in agreement with that observed in Tokyo in 1974.
Fig. 3 Vertical potential temperature profiles at the TT and the ST averaged from 0400 JST to 0600 JST on January 1, 2017.
Fig. 4 Vertical variation in the potential temperature difference between the urban (TT) and non-urban (ST) areas (the heat island intensity) averaged from 0400 JST to 0600 JST for the cases when
the coincident point was found below 250 m (Case 1) and the other cases (Case 2).
Symbols indicate the 50th percentile. Error bars indicate the 25th and 75th percentiles.
- 6 -
The height of a coincident point is one of the essential parameters needed to calculate the amount of excessive heat in an urban area, Q (eq. 1). Focusing on Case 1 (11 cases), Qwas calculated using the averaged vertical potential temperature profile from 0400 JST to 0600 JST at TT and ST. The average coincident point height and Q for the 11 cases were 123 m and 221 kJ/m2, respectively (Table 1).
Wind system and air temperature distribution under clear and weak wind conditions Figure 5 shows a composite map of the temperature deviation from the spatial average temperature (contour) and the wind system (barb) for Case 1 in the Tokyo Wards and its surrounding areas averaged from 0400 JST to 0600 JST. In Fig. 5, the dashed, solid, and thick lines indicate negative, positive, and zero temperature deviations, respectively.
Fig. 5 Composite map of the temperature deviation from the spatial average temperature and the wind system in and around the Tokyo Wards area averaged from 2400 JST to 0600 JST for Case 1.
Fig. 6 Horizontal profiles of the temperature deviation from the spatial average temperature for the respective cases (gray) and the average (black) along the section ST–TT (Fig. 2) for Case 1.
Dotted lines indicate the boundaries between the Suginami Ward (Sg) and the Nakano Ward (Na) and between the Na and the Shibuya Ward (Sb).
- 7 -
Northwesterly winds dominated over the target area. Temperature deviation contour lines of 0 (thick line) appeared from the northern part of the Tokyo Wards area (the Itabashi and Adachi Wards) to the southwestern (the Setagaya Ward) and southeastern (the Koto Ward) parts. The basic features of the nighttime temperature distribution shown in Fig. 5 are consistent with those of previous studies (e.g., Takahashi et al. 2014). Figure 6 shows the horizontal profile of the temperature deviation from the spatial temperature along section ST–TT (Fig. 2). Note that the change in the air temperature from the ST to the western periphery of the Tokyo Wards area (e.g., the Suginami Ward) was very small and that the temperature begins to rise in the western part of the Tokyo Wards area (the Nakano Ward) then it increases gradually toward the TT.
4. The Heat Budget of the Air Column Moving from the ST to TT
According to Figs. 5 and 6, a northwesterly wind prevailed in the study area; therefore, the TT was located on the leeward side of the ST. The horizontal temperature gradient was small from the ST to the Suginami Ward, and the temperature increased from the Suginami Ward to the TT. Therefore, to estimate the heating rate of the air column, we assumed that the air column moved from the ST to the TT and that the column was heated from the Suginami Ward to the TT.
The wind speed belonging to the average coincident point (123 m) at the ST from 0100 JST to 0600 JST was approximately 4.0 m/s (Table 2). Because the distance in which the temperature increased between the Suginami Ward and the TT was approximately 9.5 km (Fig. 6), and assuming that the air column moved at this wind speed, it took approximately 0.6 hours (2375 s) for the air column to move from the Suginami Ward to the TT. The heating rate of the air column of 93 W/m2 was obtained by dividing the average amount of heating (221 kJ/m2) by the total travel time between the Suginami Ward and the TT (2375 s).
Table 2 Wind speed statistics at the ST averaged from 0100 JST to 0600 JST for clear and weak wind nights
Height (m) 45 80 115 151 Average (m/s) 3.5 4.3 4.2 4.8 Standard deviation (m/s) 2.0 2.3 2.5 2.5
The heating rate of a sea breeze during daytime in summer in Tokyo has been estimated to be approximately 600 W/m2 (Yoshikado et al. 2014). The heating rate of the air column during nighttime in winter is approximately 15% that during daytime in summer.
There are two methods to calculate the heat budget for an air column: 1) an Eulerian method (Sugawara et al. 2015) and 2) a Lagrangian method (Yoshikado et al. 2014). The heating rate Qs of an air column on a clear and weak wind night can be described by the Lagrangian method such that
Qs = QH + Qe + Qrad + Qant (2)
- 8 -
Where QH, Qe, Qrad, and Qant are the sensible heat flux from the surface, the downward sensible heat flux due to mechanical mixing, radiation heating, and the anthropogenic heat supply, respectively.
Positive values indicate that heat is added to the considered air volume.
Here, the contribution of each term to the nighttime heating rate of the air column is estimated.
Christen and Vogt (2004) observed the heat balance in the city of Basel, Switzerland. They found a QH of approximately 20 W/m2 during the nighttime and a Qant of 20 W/m2 without taking time variations into account. Kusaka and Kimura (2004) estimated the surface energy balance at an urban site using an urban canopy model to which anthropogenic heat was added. They found a sensible heat flux of 10–20 W/m2 at midnight. In the present study, 20 W/m2 was regarded as a typical value of QH
in urban areas at night. Qant was estimated to be 5–20 W/m2 in central Tokyo for summer mornings (e.g., JMA 2005). By substituting Qs (93 W/m2), QH (20 W/m2), and Qant (5–20 W/m2) into eq. (2), we can obtain a (Qe + Qrad) of 53–68 W/m2 for the residual.
Sugawara et al. (2015) estimated the Qrad in summer daytime to be from −3 W/m2 to 22 W/m2 using radiosonde measurements. We were not able to obtain the humidity profiles required for to estimate Qrad. However, considering the weather condition of nocturnal clear and weak wind in winter, it is assumed that the Qrad should be negative (radiative cooling). Therefore, it can be concluded that Qe is greater than 53–68 W/m2, that is, the Qe should be roughly three times as large as QH and larger than (QH + Qant).
Even though this result is a preliminary rough estimation using the reported values of other urban areas, it is suggested that the contribution of downward sensible heat flux due to the vertical mixing of the surface inversion layer should be considerably larger than that of the sensible heat flux from the urban surface as a factor influencing the temperature difference between the urban and non-urban areas of the Tokyo metropolis.
5. Summary
The amount of excessive heat in an urban area compared to a non-urban area during nighttime in winter was estimated from the vertical potential temperature distribution at towers located in central Tokyo (TT) and an upwind non-urban area (ST). The heat balance of the air column moving from the ST to the TT was estimated.
On approximately 60% of the clear and weak wind nights, a coincident point where the potential temperature at the non-urban area was equal to that at the urban area was observed and its average height was approximately 120 m AGL. The height and frequency were nearly the same as the observational results found in Tokyo in 1974 and in another large city.
The amount of excessive heat below the coincident point in the central urban area of Tokyo compared to the windward non-urban area on the clear and weak wind nights in winter before sunrise was estimated to be 221 kJ/m2.
Based on the heat balance of the air column moving from the non-urban area to the urban area, it was estimated that the downward heat flux via vertical mixing is greater than the sensible heat flux from the urban surface. This result suggests that the influence of vertical mixing on the formation of the nighttime urban heat island in winter is more important in the Tokyo metropolis than the influence of surface heating.
- 9 -
Acknowledgements
The observational data by Japan Meteorological Agency and Air Pollution Monitoring System were used in this study. The observation at Sky Tower West Tokyo was conducted under the cooperation of Tanashi Tower Co., Ltd. This study was supported financially by Grants-in-Aid for Scientific Research (No. 17H00838) from Japan Society for the Promotion of Science.
References
Bohnenstengel, S. I., Evans, S., Clark, P. A., and Belcher, S. E. 2011. Simulations of the London urban heat island. Quarterly Journal of the Royal Meteorological Society 137: 1625–1640.
Bornstein, R. D. 1968. Observations of the urban heat island effect in New York City. Journal of Applied Meteorology 7: 575–582.
Christen, A., and Vogt, R. 2004. Energy and radiation balance of a Central European City.
International Journal of Climatology 24: 1395–1421.
Japan Meteorological Agency 2005. Heat Island Kanshi Houkokou (Urban Heat Island Monitoring Report), 2003.*
Kusaka, H., and Kimura, F. 2004. Coupling a single-layer urban canopy model with a simple atmospheric model: impact on urban heat island simulation for an idealized case. Journal of the Meteorological Society of Japan 82: 67–80.
Nakajima, K., Takahashi, H., Yokoyama, H., and Tsunematsu, N. 2018. Vertical structures of nocturnal potential temperature under clear and weak wind conditions in the central urban area of Tokyo, Japan: Statistical analysis using observation data at Tokyo Tower.
Geographical Review of Japan 91: 24–42.**
Oke, T. R., and Maxwell, G. B. 1975. Urban heat island dynamics in Montereal and Vancouver.
Atmospheric Environment 9: 191–200.
Oke, T. R. 1982. The energetic basis of the urban heat island. Quarterly Journal of the Royal Meteorological Society 108: 1–24.
Saito, N. 1977. Temperature and wind field in the atmospheric boundary layer on the southern Kanto plains. Tenki 24: 432–448.*
Sakakibara, Y. 2001. Comparison between the effect of heating from urban surface and that of mechanical mixing of urban atmosphere to heat island. Tenki 48: 305–311.**
Sugawara, H., Aiso, H., Oda, R., and Seino, N. 2015. Comparison of daytime air heating amount between city and surrounding areas. Journal of Heat Island Institute International 10: 8–12.**
Takahashi, H., Shimizu, S., Yamato, H., Seto, Y., and Yokoyama, H. 2014. Wintertime nocturnal temperature distribution based on spatially high density observation data in the Tokyo Metropolitan area under clear sky and weak wind conditions. Journal of Geography (Chigaku Zasshi) 123: 189–210.**
Tamiya, H., and Ohyama, H. 1981. Nocturnal heat island of small town, its manifestation and mechanism. Geographical Review of Japan 54: 1–21.**
Yoshikado, H., Nakajima, K., Kawamoto, Y., and Ooka, R. 2014. Heat budget of sea breezes passing through urbanized areas of Tokyo. Tenki 61: 541–548.**
- 10 -
(*: in Japanese, **: in Japanese with English abstract)
- 11 -