RE-ANALYSIS OF THE NINETEENTH CENTURY HYDROLOGY AND SEDIMENT LOAD DATA FOR THE
AYEYARWADY RIVER, MYANMAR
Nay Win OO*, R. A. J. ROBINSON**, M. I. BIRD**, T. B. HOEY***, Maung Maung AYE****, David HIGGITT*****, Xi Xi LU****,
Aung SWE****** and Tin TUN*******
Abstract: The Ayeyarwady (Irrawaddy) River of Myanmar (formerly Burma) is generally though to have the 5th largest suspended load of any world river, and the 4th highest total dissolved load. From these flux estimates, the combined systems of the Ayeyarwady and Thanlwin (Salween) rivers are regarded as contributing 20% of the total flux of material from the Himalayan-Tibetan orogen and deliver it over a short length of coastline into the Gulf of Martaban in the eastern Indian Ocean. The estimates for the Ayeyarwady are taken from published quotes of a 19th Century dataset (Gordon 1885) and there are no available published data for the Thanlwin. We present a re-analysis of the Ayeyarwady data from the original 550 page report of Gordon (1879) covering ten years of discharge (1869-1879) and one year of sediment concentration measurements (1877) and demonstrate that the commonly cited values of sediment loads (and therefore chemical fluxes) are in error. Taken at face value, the sediment flux estimates are conservatively assessed as being underestimated by 18%, and possibly as much as 38%, due to omission of the fine particulate load. However, an early 20th Century Ayeyarwady River engineer criticised Gordon’s discharge measuring methods, suggesting they lead to over-estimation of both water and sediment fluxes. These two opposing uncertainties require careful review. We describe the approaches employed, evaluate Gordon’s measurements, calculations, and subsequent adjustments and present our revised interpretation of daily and annual discharges and sediment fluxes along with an estimate of uncertainty. Our re-evaluation suggests that the annual sediment flux from the Ayeyarwady-Thanlwin system may be significant for ocean geochemistry and estimation of denudation rates. The new values suggest that the Ayeyarwady and Thanlwin rivers contribute half the present day Ganges-Brahmaputra flux to the Indian Ocean. The catchments of the Ayeyarwady and Thanlwin are
* Department of Geography, University of Pyay
** School of Geography & Geosciences, University of St Andrews
*** Department of Geographical and Earth Sciences, University of Glasgow
**** Yangon University of Distance Education
***** Department of Geography, National University of Singapore
****** Department of Geography, University of Yangon
******* Department of Geography, University of Mawlamyine
affected by ongoing land-use change, and our recently collected water and sediment flux data suggest that modern sediment loads are lower than those in the late19th Century.
Key words: Irrawaddy (Ayeyarwady), Salween (Thanlwin), sediment flux, discharge, denudation
1. Intoduction
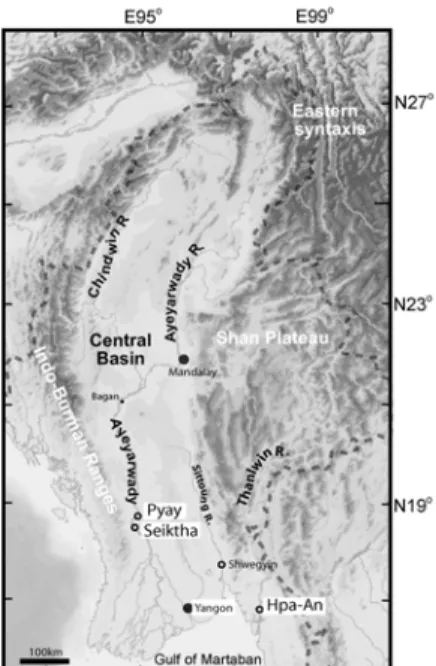
The eastern syntaxis of the Himalayas and Tibetan Plateau contains the most tectonically complex geology in Asia (Socquet and Pubellier 2005). This region is drained by the Red, Mekong, Thanlwin, Ayeyarwady, Ganges and Brahmaputra rivers, and two of these systems, the Ganges/Brahmaputra (G-B) and the Ayeyarwady/Thanlwin (A-T), debouch into the Indian Ocean. We consider the Ayerawady and Thanlwin together because their catchments are adjacent and both debouche into the Gulf of Martaban (Fig. 1) along a similar length of coastline to the Ganges-Brahmaputra river system.
The headwaters of the A-T are undergoing some of the highest rates of landscape adjustment in this region of active orogenesis (Zeitler et al. 2001).
Collision, uplift and shear zone development since the early Tertiary has resulted in a complex pattern of river capture involving all of the Ayeyarwady, Thanlwin, Red, Yangtze, Mekong and Brahmaputra Rivers through the late Tertiary (Clark et al. 2004). These large rivers deliver material from the Himalayas to the ocean and knowledge of the magnitude of fluxes, as well as the mineralogical and chemical characteristics of the transported material, is a pre-requisite for understanding the impact of Himalayan uplift on global biogeochemical cycles (Raymo et al. 1988) and the impact of human activities on recent-modern sediment yields (Wilkinson 2005). An understanding
Fig. 1 Map of Myanmar and sampling locations.
of denudation rates in areas of active tectonism is critical in assessing the extent to which climate-driven erosion influences large-scale tectonic behaviour (Zeitler et al. 2001).
Together, the G-B and A-T are thought to deliver close to half of the current total flux of water, sediment and dissolved load from the Himalayas and Tibet to the ocean, with ~20% of this attributed to the A-T (Milliman and Meade 1983). The Ayeyarwady River ranks 5th in the world in terms of suspended load (261 MT year-1) and 4th in terms of dissolved load (Milliman and Meade 1983; Table 1), but while the sediment and water fluxes are derived from a 19th Century dataset (Gordon 1885), an extensive search has failed to reveal the source of the measurements on which the dissolved load estimates are based. Stamp (1940) states that 48 MT year-1 should be added as dissolved load for the Ayeyarwady but gives no source for this estimate. Milliman and Meade (1983) estimate that the combined A-T transports an annual average of 697 km3 of water, 365 MT of suspended and 127 MT of dissolved material. Although figures for these rivers are widely quoted, there do not appear to have been any actual measurements made for the Thanlwin, and the basis upon which the estimates have been derived is unclear.
We have re-analysed the original 19th Century Ayeyarwady data and subsequent early 20th Century engineering reports that identify problems with the data collection. In their seminal paper, Milliman and Meade (1983) use the Ayeyarwady as an example of the potential error that can arise when compiling global sediment budgets using data recycled from previous reports rather than the original, often inaccessible, data.
Given the very significant contribution of the Ayeyarwady River to global sediment budgets and, additionally, to make this important historical dataset accessible, we have re-analysed the original 19th Century water and sediment data and compared the results with our own field measurements collected during the onset of the 2005 and 2006 monsoon season.
2. Study Area and Methods
The Ayeyarwady and Thanlwin rivers are ~2000 km and ~2800 km long, with drainage areas of 415,700 km2 and 116,608 km2 respectively (Bender 1983). The Ayeyarwady catchment rock types includes the Cretaceous to mid-Cenozoic flysch of the western Indo-Burman Ranges, Eocene-Miocene and Quaternary sediments of the Myanmar Central Basin, and the Late Precambrian and Cretaceous-Eocene metamorphic, basic and ultrabasic rocks of the eastern syntaxis. The Thanlwin and eastern tributaries of the Ayeyarwady drain the Precambrian, Oligocene-Tertiary sedimentary, acidic, and metamorphic rocks of the eastern Shan Plateau (Bender 1983; Curray 2005; Najman et al. 2005;
Socquet and Pubellier 2005).
Gordon (1885) presented monthly discharge data collected between 1869 and 1879, and one year of sediment load data (1877-1878), to the Royal Geographical Society without details of his field methods or sampling locations. Gordon’s original report,containing his full daily discharge, rainfall and sediment load dataset, survey maps, channel cross-sections and a detailed description of sampling
techniques (Gordon 1879), was located in the archives of the Royal Geographical Society (RGS) in 2005. These data have been digitally reconstructed using OCR software and every number has been checked against the original report. The data are of remarkable quality, particularly since there are a full range of flows, including monsoon peak discharge, and sediment loads were measured from three water depths, including the lower part of the water column. Milliman and Meade (1983) note that inadequate sampling at peak flows and from throughout the water column are amongst the most important sources of error in sediment load data.
Robert Gordon, a civil engineer in charge of river works in Burma during the late 19th Century, investigated the magnitude and duration of flood events on the Ayeyarwady for the Government of India, in order to calculate the required size and height of flood embankments. Gordon selected Seiktha (Fig. 1) as the main measurement site for velocity and sediment concentration because it is the furthest downstream, site above the delta to be constrained by bedrock highs on both its western and eastern banks. Seiktha is 16 miles upstream of Myanaung (Fig. 1), where daily stage was also recorded from 1869-1879, but where the width of the river made multiple cross-sectional measurements of sediment load, velocity and depth too difficult.
3. Nineteenth Century Cross-sectional Area and Flow Velocity Measurements
Gordon’s hydrological sampling strategy was based on the work of Caleb Goldsmith Forshey who constructed a hydrological station on the Mississippi River at Carrollton in 1848 and measured the flow from 1848-1855 as part of the US federal government's Mississippi Delta Survey (Forshey 1850).
Gordon made daily measurements of flow velocity and depth, and recorded stage during 1872-1873 and again in 1875, missing only Sundays, holidays and days of very bad weather. Channel width at Seiktha ranges from c.700 m at low flow to c.1600 m at peak flow. Flow depth was measured along a line normal to the main flow from a boat using a lead and line, and the boat position was surveyed from the bank with theodolites. Flow velocity was estimated from the time taken for floats to travel between two cross-channel baselines spaced about 60 m apart, with theodolites at the end of each baseline used to track float trajectories. The starting and final positions of the floats were drafted on scaled drawings, the downstream component of velocity being resolved trigonometrically from the time of travel.
Surface floats, suspended up to ~1 m below the surface to avoid wind and waves, were used initially. Gordon recognised the need for vertical velocity profiles and so sunk floats on increasing lengths of line in ~1m intervals down through the water column; the depth of the river at Seitkha never exceeded 25 m (Gordon 1879). Reported velocity measurements are usually the average of 2 or 3 readings. The float (called a double float) was a solid cylinder of wood (1ft (30 cm) in height and 6 inches (15 cm) in diameter) with a 4 icnches by 4 inches (10 x 10 cm) hole on the outside into which the amount of wet clay ballast needed to sink the cylinder to the required depth was inserted (Gordon 1879).
Floats were suspended from a thin cord (1/16th inches (c. 1.5 mm) diameter) attached to a smaller wooden cylinder (6 inches (15 cm) diameter and 1 inch (25 mm) thick) that floated just below the water
surface. Gordon grouped similar surface velocity values together to divide the channel cross-section into 10 sub-sections (the sections were altered slightly for the overbank floods of 1875) and calculated the area of each sub-section. He calculated the arithmetic mean velocity for each vertical profile across the channel and mean surface velocity for each sub-section. Some sub-sections had more than one vertical velocity profile (and some appear to have none) and, for days of continuous stage height, he calculated the mean of the average vertical velocities for each profile. Gordon (1879) notes that his measurements at any location remained the same on consecutive days with constant stage (and differed with stage), and varied both within a sub-section if there were multiple profiles, and across the whole cross-section.
About 10,000 vertical profiles of float velocity were recorded by the end of 1875 and each channel cross-section (one day of measurements) was covered by about 10 profiles (Gordon 1879). He then calculated discharge by summing the velocity-area product of each sub-section. He used two years of daily data (excluding Sundays and holidays) and the stage readings to develop stage-discharge rating relationships for rising and falling flows at Seitkha (Fig. 2); he presented both the measured and predicted discharge values and states that in only a very few cases do the differences exceed 10%
(Gordon 1879: 22).
In addition to daily sampling at Seithka for the periods mentioned above, Gordon used a simple transfer function to match the Myanaung stage record to that at Seitkha, and then calculated daily discharge for the remaining years between 1869-1879 at Seitkha from the Myanaung stage measurements. Gordon used the Myanaung record instead of the Seiktha stage record because a sand bar developed downstream of Seiktha between 1873 and 1875, which raised the water level at the gauging location, and because Myanaung had the longer stage record. Gordon (1879) states that the difference between the two stage records was about 33 inches and that this value did not vary throughout a range of flows (page reference).
Gordon (1879) discussed possible errors with the double float method, including drag associated
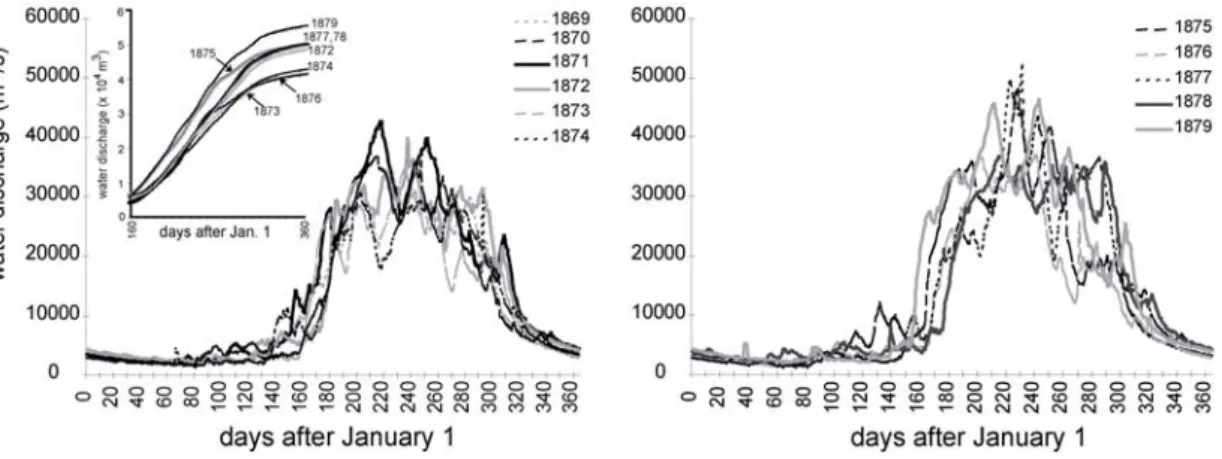
Fig. 2 Annual hydrographs at Seiktha, using Gordon’s original data including his correction to allow for over-estimation of near-bed velocities. Although superficially consistent, the timing, duration and peak flow of the monsoon are all variable leading to total annual discharge varying by +/- 20% from the mean (inset).
with the cord, the accuracy of calculated time over the short distance and eye fatigue of the observers. In 1882 Gordon cross-checked the double float method with an electrical Deacon current meter and found that the water velocities from lower parts of the water column were less than his first float measurements and that the difference increased with flood level. He consequently suggested reducing his calculated discharges (Gordon 1879) by 10%, 5%, and 0% for high, medium and low discharge ranges, respectively, and applied these corrections to the entire discharge dataset presented to the RGS in 1885.
Subsequent engineers, who took over the Embankment Division in 1913, re-evaluated Gordon’s data. Samuelson noted several problems with Gordon’s data, in particular: 1) the double float method over-estimates velocities lower in the water column and therefore over-estimates discharge; 2) surface velocity readings were not always taken on the same days as the vertical velocity readings; 3) that not enough channel cross sections were measured; and 4) that the Myanaung and Seithka stage records varied with changing channel geometry at Myanaung producing systematic errors in the transfer function between the two locations. One of the features of the Gordon’s dataset (Fig. 2) is an apparent increase in discharge for the years after 1875. We further discuss these sources of error in a later section.
4. Nineteenth Century Sediment Load Measurements
Gordon measured sediment load for six days each week (excluding Sundays, holidays and storms) for the year of 1877-1878 (52 weeks) at three positions across the river: ~90 m from the right bank, in mid-stream and ~1220 m from the right bank. At the first two positions, samples were taken at three depths – surface (~1 m depth), mid depth and lower (~1 m from riverbed); the left bank position has only surface and lower measurements due to the shallow water depths there. Gordon collected water using a hollow barrel (1 ft (30 cm) long and 6 inches (15 cm) diameter) loaded with lead rings to make it sink. The barrel had two large valves on the top and bottom with freely opening lids made of leather and lead; as the barrel descended through the water column, the lids remained open and water entered and passed through it, but the lids closed once the barrel was being lifted out of the water. It thus collected water from the lowest depth to which the barrel descended. The water was transferred to bottles, after shaking the barrel. Gordon combined 100 g from each bottle for each of the six days at each depth to produce 52 weekly measurements of sediment load at each depth. He filtered the combined samples (600 g of water) through a double thickness of weighed filter paper. Gordon does not mention the quality or grade of paper, but it seems highly unlikely that it was a fine mesh size as measurement of such large volumes of water and sediment would have been extremely slow. The dried filter papers and sediment were weighed carefully using a Fortin balance then the filter paper alone was re-weighed, compared to its original weight, and the sediment mass was calculated. Only the combined weekly loads for each depth are reported by Gordon (1879). Measurements are reported in grams of sediment per 100 g of water (1 g/100 g being equivalent to 104 mg/L) for each depth and week of measurement. The data consistently show that surface concentrations (CS) are ~80% of those measured
at mid–depth (CM), and that those recorded at the lower depths (CB) are between two and four times higher than in the upper parts of the water column and are more variable (Fig. 3). Sediment load calculations (Gordon 1879) used the average concentrations from all water depths (his Table 16).
Gordon presents a concentration-discharge relationship for the 1877-78 data but does not discuss how this was calculated. This relationship was then combined with the 1869-1879 stage-discharge relationship to calculate annual sediment loads that range from 248-352 MT year-1; the directly measured load for the year of measurement (1877-78) is 340 MT year-1. Gordon (1879) originally reported the average sediment load for 1869-1879 as 286 MT year-1; this is close to the number initially quoted in Milliman and Meade (1983). However, as discussed earlier, by 1885 Gordon had reduced the discharge measurements for the monsoon months and the most frequently quoted annual sediment load value of 261 MT year-1 (i.e., Milliman and Syvitski 1992; Stamp 1940) comes from the 1885 paper presented to the RGS (Gordon’s (1885) Table 1); this load is calculated from an average of sediment concentrations from surface, mid and lower water samples.
Fig. 3 A: Ten years of daily discharge estimates re-calculated from the original tables of Gordon (1879) and based on velocity and water depth profiles. Inset diagrams are the hydrograph and re-calculated sediment concentration data for 1877-1878 based on an average of the surface, mid and bottom depth concentrations.
B: Our preliminary sediment-discharge rating curve for Gordon’s data. CF is a bias conversion factor used on least squares regressions, with log-normally distributed residuals, and accounts for known underestimation of predicted sediment concentrations.
For the Gordon dataset, CF is 1.09.
5. Modern Discharge and Sediment Load Mesurements
In June 2005, data were collected at Gordon’s original site at Seiktha, including ten bathymetric cross-profiles, ten vertical velocity profiles (measured using a Valeport velocimeter), and eighteen suspended sediment load samples collected using a 2 L Van Dorn water sampler. We used a similar
sediment sampling protocol to Gordon(1879), involving collection of water and sediment from surface and mid depths (but not bottom depth) and then settling sediment from 2 L of water for 24 hours. We decanted the water and passed it through a 0.45 µm nucleopore filter to determine the likely recovery efficiency of Gordon’s protocol. Separate quantification of the settled and filtered components suggest that 15-21% of the sediment load remains suspended after settling and is recovered with a 0.45 µm filter.
Using average velocities and bathymetry for each of our profiles, the velocity-area method gives a discharge of 5058 m3 s-1 on June 26th, 2005 carrying 252 mg /l of suspended sediments with a median grain-size of 10.5 µm.
In May 2006, we re-measured discharge with an Acoustic Doppler Current Profiler (ADCP) and collected water and sediment samples using the same protocol as in 2005, including sediment sampling about 0.5-1 m above the riverbed, from Seiktha, Pyay (40 miles upstream) and at Hpa-An on the Thanlwin. Measurements of water discharge (and sediment concentration) made between May 23rd and May 30th 2006 were 5370 m3 s-1 (271±16 mg l-1) at Seiktha, 5030m3 s-1 (210±9 mg l-1) at Pyay and 2270 m3 s-1 (127±11 mg l-1) at Hpa-An. Our total sediment concentrations (settled and filtered fractions) for June 2005 and May 2006 are plotted together with Gordon’s data in Fig. 4. Our sediment concentrations, including the filtered fraction, are somewhat lower than the 19th Century values for the onset of monsoon (Fig. 3).
6. Re-analysis of Gordon’s Original Data
We have re-calculated Gordon’s discharge (Fig. 2) and suspended sediment concentration data (Fig.
3; Table 1). Our 10-year average of discharge (440±48 km3 year-1) is reduced to 404± 49 km3 year-1 after decreasing the monsoon discharges in a manner similar to Gordon (1879, 1885); Gordon (1885) published a 10 year average discharge value of 428 km3 year-1 which also includes his reductions to the original discharge measurements. Gordon does not discuss exactly how he adjusted his discharge measurements and the data are not complete enough to allow a correction factor to be calculated. He states that high, medium and low flow measurements were reduced by 10%, 5% and 0% and by comparing the 1879 and 1885 publications, it is clear he applied those reductions to the months of June-November. To be consistent with Gordon’s reduction, we define low flows as below 10,000m3 s-1, medium flows to be in the range 10,001 to 30,000 m3 s-1, and high flows as greater than 30,000 m3 s-1. This reduces our calculation of mean annual water flux by 8.2% (from 440±48 km3 year-1 to 404±49 km3 year-1) (Table 1). We intend to quantify the error that should be attributed to Gordon’s double float method with velocimeter and ADCP measurements in future field seasons in order to objectively correct the original 19th Century values.
The daily concentration measurements are presented as an average of surface, mid and bottom depth concentrations (CSMB) and also as individual surface (CS), mid depth (CM) and bottom depth measurements (CB) (Fig. 3). For comparison, we also present the average of surface and mid depth concentrations in Table 1 and the ratios of CSM/CB for the 1877-78 measurements. Gordon suspected
that some of his measurements of CB were over-estimated because of bed disturbance. Our small dataset collected in May 2006 during the onset of monsoon (days 144-151) has ratios of CSM/CB in the range 0.86 - 1.1 which may suggest that Gordon’s CB measurements are too high (Fig. 4A). However, Gordon’s dataset also shows that the ratio of CSM/CB approach 1 during the onset of monsoon (May-June) which is when we sampled (Fig. 4B). Therefore, in the absence of a modern sediment concentration dataset that covers the full range of flows, CSM can be accepted as a lower bound on the mean sediment concentration and CSMB as an upper limit. It is worthwhile repeating here that the quoted Gordon (1885) sediment load values are based on averaging the three depth concentration measurements.
We have calculated new sediment rating curves for the adjusted discharge and sediment concentration values for 1877-78 (Fig. 5) based on a regression of the log-log plot of discharge and sediment concentration and including a bias correction factor to account for the poor fit of the regression to sediment concentrations at low discharges (Ferguson 1986). The sediment-discharge relationships are different for early and late monsoon periods; the former exhibits “first flush” positive hysteresis behaviour with a steeper rating curve, whilst negative hysteresis is displayed for late monsoon periods (Fig. 5B). We compared sediment concentrations calculated using one annual rating curve (Fig. 5A) with those calculated from two seasonal curves (Fig. 5C). Despite the clear differences in the sediment yield behaviour between early and late monsoon periods, a seasonal (two curve) relationship over-predicts sediment concentrations for both CSM and CSMB compared to the measured values (Fig.
5C). We have therefore used the annual curve to calculate sediment concentrations for the remaining 9 years of the discharge records.
Our filtered sediment concentration data from 2005 and 2006 suggest that the concentrations calculated by Gordon did not include the very fine particulate fraction (>0.45 µm fraction); although we do not know the efficiency of Gordon’s filters, it is unlikely that he used a mesh size as small as 0.45 µm because of the absense of such materials at the time and the immense volume of water they were processing. We therefore use an increase of 17.5% derived from our dataset as an estimated increase to sediment load (a fine-grained correction). The raw and adjusted Gordon data, using both CSM and CSMB
are presented in Table 1. With no correction for the missing fine particulate fraction, the Ayeyarwady transported 404 ± 49 km3 yr-1 of water and 331±49 MT year-1 of sediment load (10 year averages). With our 17.5% increase for the missing fine particulate fraction, the sediment load becomes 389±58 MT year-1.
In summary, the re-calculated sediment load data differ from Gordon (1885) values because i) there were arithmetic errors in 19th Century calculations; ii) our sediment rating curves increase the predicted sediment loads by 3.2% above the predicted values of Gordon (1885); and, iii) our fine-grained correction that needs to be applied to the Gordon concentration measurements increases the loads by 17.5%.
Table 1 Comparison of the average of surface and mid depth concentrations and the ratiosof CSM/CB for the 1877-78 measurements.
Drainage Area (x 106 km2)
Drainage Length (km)
Water Flux (km3/year)
Suspended Sediment Flux (x 106 t/year) Av. Surface and
mid depth
Av. Surface, mid and bottom Milliman & Meade (1983) –
Ayeyarwady
0.43 - - 428 -- 285 (261†)
Re-analysis of Ayeyarwady (A) data‡
0. 42* 1985 440±48
10 year average 1 std
-- ---
Reduction due to velocity over-estimate by Gordon
- - - - 404±49
10 year average 1 std
206±49 331±49
Addition due to unmeasured fine fraction (17.5%)
- - - - - - 243±57 389±58
Scaling for Thanlwin (T) 0.16* 2800 202 92 (61)** 148 (97)**
Scaling by drainage area for the Sittoung, Bago, Bilin
0.05* - - 47 29 46
Total for A-T system 0.63 - - 605 364 (332) 583 (532)
Ganges/Brahmaputra system 1.59† 2700 971 1060† 1060†
Percentage of estimated A-T relative to G-B
40% - - 62% 34 (31)% 55 (50)%
†From Gordon (1885) and Milliman and Syvitski (1992)
* Drainage areas and lengths from Bender (1983)
‡ From Gordon (1879)
** Thanlwin estimates are based on two end member values – by proportional drainage area and, in brackets, a scaling of 25% of the Ayeyarwady values based on our small Thanlwin dataset.
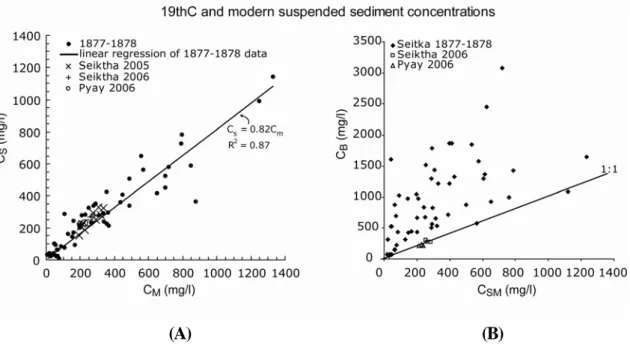
(A) (B)
Fig. 4 A: Relationship between sediment concentration in surface (CS) and mid depth (CM) levels of the water column from 1877-78 compared to our data from 2005 and 2006. B: Average of CS and CM (CSM) compared to bottom level concentration (CB) compared to our 2006 dataset.
Fig. 5 Sediment rating curves for 1877-1878 measurements.
A: Regression of data derived from log-log plot using CSMB (average of surface, mid and bottom depths).
B: Linear plot showing qualitative interpretation of positive hysteresis for early monsoon period and negative hysteresis for late monsoon period.
C: Cumulative annual and seasonal rating curves for two depth (CSM) and three depth (CSMB) averages compared to measured values. Modeled rating curve values of sediment concentration deviate from measured values for the late monsoon period. The annual rating curve best fits the measured values (CSM and CSMB).
7. Review of Potential Sources of Error
There are four sources of potential uncertainty Gordon’s Ayeyarwady dataset: 1) the velocity measurement technique; 2) the missing fine particulate fraction in the sediment concentration data; 3) the merging of a stage-discharge relationship developed at one location to a stage record at another location; and, 4) the contribution of the CB to the daily cross-section average values. We have adjusted the raw discharge values to account for 1) the uncertainty due to the velocity measurement technique (8.2% reduction in discharge) and 2) the missing fine particulate fraction (17.5% increase). Our analysis suggests that the merging of two stage records has a presently unclear effect on the discharge and sediment load data. Finally, it is possible that some of the bottom sediment measured by Gordon was disturbed bed material and not part of the suspended load (or bedload) but we intend to address this question in future field work and sampling campaigns.
8. Implications
Our 2006 measurements for the Thanlwin suggest that both water discharge and sediment concentration are about 50% of the Ayeyarwady values at Seiktha; a second way to estimate the Thanlwin sediment load values is to scale the Ayeyarwady values by relative drainage basin size. If we apply these scalings to the Ayeyarwady values, the Thanlwin may transport an additional 61-148 MT of sediment (Table 1). The Sittoung and two smaller rivers also debouch into the Gulf of Martaban (Fig. 1) and if we scale their discharge and sediment contribution to drainage basin area (Table 1), the total annual flux to the eastern Indian Ocean for the Ayeyarwady-Thanlwin-Sittoung system rises is 332-583 MT; the upper value of 583 MT year-1 represents sediment load calculated from three depths (average of CS, CM, CB) and a drainage area scaling for the Thanlwin and Sittoung rivers, and is 55% of the modern Ganges-Brahmaputra sediment flux. In comparison, sediment concentration averaged over just two depths represents 50% of the G-B flux; we interpret the lowest possible contribution of the A-T system to the Indian Ocean to have been 31% of the G-B, calculated using sediment concentration averaged over two depths and with the Thanlwin representing 25% of the Ayeyarwady sediment flux.
Over the past century or more many rivers worldwide have undergone substantial declines in sediment export as a result of damming and irrigation, but the results of Syvitski et al. (2005) suggest that the Ayeyarwady has undergone the largest relative increase in sediment delivery to the ocean of any major river as a result of land-use and population changes and the absence of dams on its mainstem or major tributaries. However, our admittedly limited field data from 2005-2006 (Fig. 4) suggest that modern sediment concentrations are below the values recorded in the late 19th Century at the onset of monsoon even though our measurements include the fine particulate fraction that was excluded from Gordon’s measurements.
The majority of the Ayeyarwady load is thought (Stamp 1940) to be derived from below Mandalay in the unconsolidated and rapidly eroding ‘dry zone’ (<800 mm annual rainfall) of the Central Basin of
Myanmar (Fig. 1), where recent population and agricultural changes have produced significant land-use changes. It is unclear at present how sediment loads have changed over the last century and we are beginning to develop methods for hindcasting sediment loads to address this lack of knowledge. The sparsely inhabited nature of the Thanlwin catchment means that land-use change has had less impact on this river, but the Chinese plan to dam the river in its upper reaches which will have a significant effect on future sediment flux. Measuring the value of its pre-dam sediment load at the present time is critical.
9. Conclusions
The existing sediment flux data for the Ayeyarwady River, one of six major systems draining the eastern Himalaya, come from a comprehensive 19th Century hydrological study but these original data have not been re-evaluated since recognition of the significance of these river systems to global climate change and Himalayan landscape development. To date, only recycled values from early 20th Century summaries of the work have been incorporated in global river sediment load and discharge databases.
We have re-analysed the original data and sampling strategies have re-calculated discharges and sediment loads and compared them to the values typically cited in recent publications and find that the quoted values are under-estimated.
We therefore believe that the significance of the A-T contribution to ‘natural’ Himalayan denudation and land-ocean fluxes has not been fully appreciated because: (i) re-analysis of the original 19th century data (Gordon 1879) for the Ayeyarwady suggests that the oft-quoted flux of 261MT yr-1 may be a significant under-estimate with the true value as high as 389MT yr-1; and, (ii) the A-T system may contribute 55% of the Ganges-Brahmaputra load (583MT yr-1).
Refferences
Bender, F. 1983. The geology of Burma. In Beitrage zur Regionalen Geologie der Erde, ed. F.
Bender, V. Jacobshagen, J. D. de Jong, and G. Luttig, Berlin: Gebr. Borntraeger.
Clark, M. K., Schoenbohm, L. M., Royden, L. H., Whipple, K. X., Burchfiel, B. C., Zhang, X., Tang, W., Wang, E., and Chen, L. 2004. Surface uplift, tectonics, and erosion of eastern Tibet from large-scale drainage patterns. Tectonics 23: TC1006, doi:10.1029/2002TC001402.
Curray, J. R. 2005, Tectonics and history of the Andaman Sea region. Journal of Asian Earth Sciences 25 (1): 187-232
Ferguson, R. I. 1986. River loads underestimated by rating curves. Water Resources Research 22:
74-76.
Forshey, C. G. 1850. Memoir on the physics of the Mississippi River, and certain internal improvements in the state of Louisiana (Series of Making of America/University of Michigan).
New Orleans: The office of Bee.
Gordon, R. 1879. Report on the Irawadi river. Rangoon: P.W. Secretar Press.
Gordon, R. 1885. The Irawadi river. Proceedings of the Royal Geographical Society 7: 229-231.
Milliman, J. D., and Meade, R. H. 1983. Worldwide delivery of river sediments to ocean. Journal of Geology 91: 1-19.
Milliman, J.D., and Syvitski, J.P.M.1992. Geomorphic/tectonic control of sediment discharge to the ocean; the importance of small mountainous rivers. Journal of Geology 100: 525-544.
Najman, Y., Carter, A., Grahame O., and Eduardo, G. 2005. Provenance of Eocene foreland basin sediments, Nepal: Constraints to the timing and diachroneity of early Himalayan orogenesis.
Geological Society of America (GSA) 33 (4): 309-312.
Raymo, M. E., Ruddiman, W. F., and Froelich, P. N. 1988. Influence of late Cenozoic mountain building on ocean geochemical cycles. Geology 16: 649–653.
Socquet, A., and Pubellier, M. 2005. Cenozoic deformation in western Yunnan (China-Myanmar border): Journal of Asian Earth Sciences 24: 495–515.
Stamp, L. D. 1940. The Irrawaddy River. The Geographical Journal 95: 329-56.
Syvitski, J. P. M., Vörösmarty, C. J., Kettner, A. J., and Green, P. 2005. Impact of Humans on the Flux of Terrestrial Sediment to the Global Coastal Ocean. Science 308: 376-380.
Wilkinson, B. H. 2005. Humans as geologic agents: A deep-time perspective. Geology 33(3):
161–164.
Zeitler, P. K., Melzer, A. S., Koons, P. O., Craw, D., Hallet, B., Chamberlain, C. P., Kidd, W. S. F., Park, S. K., Seeber, L., Bishop, M. P., and Shroder, J. F. 2001. Erosion, Himalayan tectonics and the geomorphology of metamorphism. GSA Today 11: 4-8.