著者 Hatori Yoshihiko journal or
publication title
Kansai University review of business and commerce
volume 9
page range 1‑17
year 2007‑03
URL http://hdl.handle.net/10112/12109
Increasing Reserve Assets
Yoshihiko Hatori Abstract
Ample reserve assets used to be a symbol of a rich country. However, what is going on at present has posed a major question to this way of thinking. Countries with ample foreign exchanges are not developed countries excluding Japan, but are developing countries including China as the greatest reserve assets holder, and Japan. A common factor of the structures of balance of payments of China and Japan is that they are based on a large amount of the surplus in their current accounts. Furthermore, the rapid increase in reserves was also the result of an additional factor of the surplus in the capital and financial account centering on direct investment in the case of China, and a decrease in the deficit in the capital and financial account in the case of Japan. It seems to be that increasing reserve assets are becoming a part of the absorption system of world savings by the USA.
Key words: reserve assets, balance of payments, globalization, absorption of world savings
Introduction
Increases in the reserve assets of China, etc. have attracted attention in recent years. The rapid increase in China, which started after the year 2000, is now estimated to exceed these of Japan sooner or later, which the Japanese have had some reputation as the greatest reserve holder in the world, or to have already exceeded them by now(1>. This phenomenon, however, did not occur under the circumstances where Japan did not increase too much, or reduce them. It is therefore necessary to note the point that China achieved this rather at a far greater pace than that of Japan, while Japan itself
has also rapidly increased them as will be mentioned later. Hitherto, two greatest foreign reserve holders have emerged in East Asia.
In this paper, we will examine various factors which have brought about such a situation, and would like to clarify its economic implication. Firstly, let us examine the change in the state of the allocation of reserve assets in the world today.
1. Allocation of Reserve Assets in the World
Let's look at the state of reserve holdings in the world as at the end of 2005. As Figure I shows, today's major reserve holders are China and Japan. The total of the two countries exceeds 40% in the world. In addition, if "other Asian countries" are added to this, more than 60% is indeed concentrated in this region. This means that the share of advanced countries including Japan between 30 and 40%. In the past, Figure 1 The shares of reserve assets by main countries and regions in the world (at the end of 2005, the total amount is 2,997.6 billion SDR)
Japan
Other developing countries (24.3%)
Germany (1.2%)
(6.3%) Other Asia
(21.3%)
China (22.3%)
[Source] IMF, International Financial Statistics (hereinafter referred to as IFS), April 2006,
pp. 38‑40
[Note] (1) Valuation of gold was made at 35 SDR per ounce.
(2) Chinese figures are the total of mainland China, Hong Kong and Macao.
Figure 2 The trend of total reserve assets in the world and shares of main countries and regions (at each yearend)
inmillionSDR 3,500 3,000
70疇 I暉
1 1 1 1 1 1 1 1 1 1 1 1 言
%
60‑+‑
50‑+‑
20十 / ,終̲,,,̲ ̲
, , , ?
10
Advance countries Japan
USA Euro region
‑ E r Developing countries Asia (excluding China)
China
● total world reserve assets
゜
1990 2000[Source] IFS, Yearbook 2002, pp. 72‑77, Yearbook 2004, pp.42‑44, April 2006, pp.38‑40.
[Note] The same as before.
there was a tendency that advanced countries had ample reserves and developing countries tended to be short of them. The present situation appears to be that the whole picture has been reversed, apart from the circumstances of individual countries. The features of the recent state of reserves in the world can be said to be that developing countries have been relatively rich in foreign exchanges especially in the Asian region, and that Japan being an advanced country and China showing very rapid growth are now major holders. The trend of the allocation ratios of the reserves in the world after
1990 shows that a dramatic change has occurred in the last ten to fifteen years. As Figure 2 shows, in 1990 developed countries had more than 60% of・all in the world, and the share of developing countries was less than 40% in contrast. The present situation, however, is largely in reverse, as already mentioned above. Japan and China rapidly increased their shares. "Other Asian countries"
have also done, but the recent trend is towards a slight leveling‑off.
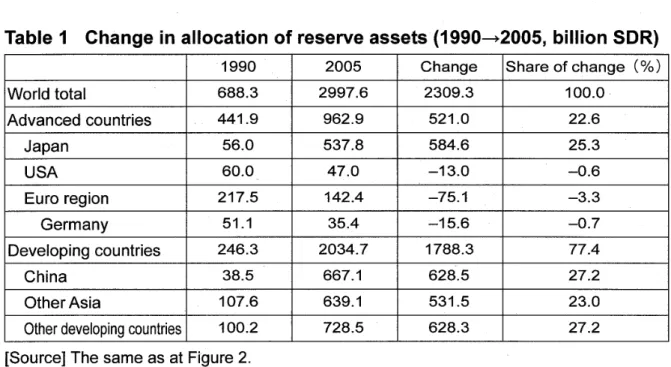
Table 1 Change in allocation of reserve assets (1990→ 2005, billion SDR)
1990 2005 Change Share of change (%) World total 688.3 2997.6 2309.3 100.0
Advanced countries 441.9 962.9 521.0 22.6
Japan 56.0 537.8 584.6 25.3
USA 60.0 47.0 —13.0 —0.6
Euro region 217.5 142.4 —75.1 ー3.3 Germany 51.1 35.4 ー15.6 —0.7 Developing countries 246.3 2034.7 1788.3 77.4
China 38.5 667.1 628.5 27.2 Other Asia 107.6 639.1 531.5 23.0 Other developing countries 100.2 728.5 628.3 27.2 [Source] The same as at Figure 2.
[Note] The Figures for Euro region in 1990 are the total reserves of the present member countries. Other notes are the same as those for Figure 1.
Table 2 Change in the amount of reserves at the end of the year divided by the amount of average monthly goods import
[Source] IFS, April 2006 [Note] The amounts of import
are CIF figures.
,~~u ~UUb
World total 2.3 3.4 Advanced countries 2.0 1.8 Japan 2.8 13.5 Other advanced countries 2.0 0.8 Developing countries 3.1 6.0 China 3.3 8.2 Other Asia 3.9 6.4 Other developing countries 2.4 4.6
On the other hand, the shares of the Euro region and the USA have tended to decline, and the Euro region especially shows a major change(2).
Additionally, what should attract greater attention in this Figure is that the total reserves in the world have also largely expanded as shown on the top part. Let's look at data further from the viewpoint of which countries and regions contributed to such increases, although what is
described above can be deduced to some extent. As Table I shows, the increase in the whole world was as rapid as approximately 4.4 times from 688.3 to 2,997.6 billion SOR. Firstly, almost all the increase in advanced countries (22.6% of the total increase) was that of Japan, while even absolute figures decreased in the USA and Euro region. Nearly two thirds of the share of the increase of developing countries, which is 77 .4%, is by Asian region (i.e. China and "other Asian countries"). China and Japan, which are today's two largest foreign holding countries, acquired more than half of the increase in the world. The corresponding number in the whole of Asia including these two countries exceeded a remarkable number, that is, three quarters<3>. Ample reserve assets used to be one of the standards of rich countries, and its scarcity was a symbol of the poverty that developing countries must get out of<4>̲ However, today the state which may change such a concept has occurred in a very short period. Under such circumstances, China and Japan have made a rapid increase. In the case of China, this could be an evidence of its economic progress.
Then, what was the reason in the case of Japan, which has been struggling in an stubborn economic slump?
2. Balance of Payments of China and Japan
Apart from gold and the IMF reserve position, needless to say, foreign exchanges, which are foreign currency denominated assets, increase as a result of an increase in income arising from asset management such as interest. It is, however, reasonable to consider that rapid increases in Japan and China as seen in the preceding paragraph were made by major market interventions of selling one's own national currency and buying foreign currencies in the foreign exchange markets.
Accordingly, this problem is closely related to the structure of balance of payments as well. Now, let's examine the structures of China and Japan in the following paragraphs.
Firstly, we would like to have a look at the balance of payments of
Figure 3 The trend of main items of balance of payments of mainland China
60
50 Current account 40 Balance on goods 30 Balance on service 20 Balance on income 10
• • • • • .. Capital and financial account
゜
‑10 Errors and omissions
‑20 Change in reserve assets
‑30 ‑e‑ Direct investment
‑40 ● Securities investment
‑50 .. Other financial account
40 20
‑40
‑60 會
. .
. . 参 ・
‑80 脅
● ヽ争︐ ゜参
‑100
‑120
1990 95 2000
[Source] IFS, Yearbook 2002, p. 357, Yearbook 2004, p.237, April 2006, p. 239. [Note] On the change of
reserve assets, the plus mark means negative and the minus mark dose positive (The same shall apply hereinafter).
China, it's recent economic development of which has attracted attention worldwide. Data of balance of payments of Hong Kong have been published by IFS only since・1998. Then we will take up the figures of only mainland China, because those of Macao are considered too small to distort.
From Figure 3, there is no doubt that the consistent surplus in the current account since the middle of 1990 has been the basis of the rapid increase in reserve assets. We, however, consider it clear that the net capital inflow from abroad contributed as a major factor, as it coincided with the increase in the surplus in the capital and financial account in the middle of the 1990s and the several years of this century. As the upper graph in Figure 3 shows, the core of this capital inflow is the flow of direct investment.
Figure 4 The trend of main items of balance of payments of Japan
一 Currentaccount
in trillion yen 20
15
10
5 i
. . .
9ネ0 •も`
≪
●
0 ら
芯々・只t2
゜
‑5
‑10
‑15
‑20
゜
Balance on goods
Capital and financial account Direct investment
Change in reserve assets Errors and omissions
‑25
[Source] Bank of Japan, Monthly Report of Balance of Payments Statistics
Figure 4 shows the state of the balance of payments of Japan. From this, it can be seen that a major change started to take place in the balance of payment structure of Japan from the beginning of this century. It's balance of payments used to be typical of capital exporting countries where the surplus in the current account absorbs the deficit in the capital and financial account. The deficit in the capital and financial account, however, started to diminish at the end of the preceding century, and the figures tended to turn into the black in 2003 and 2004. Accordingly, Japan became a net capital importing country in terms of the private sector in those two years. As Figure 4 shows, direct investment during the period ‑although its scale has been reduced, compared to that in early 1990s ‑remained in the red. It is therefore necessary to consider that such a reverse was caused by the domain of indirect investment. The rapid increase in reserves largely offsets the surplus in the accounts including the current account.
The summary of the above is that it can be said that in the case of China, the background of the rapid increase in reserve assets was a surplus in the capital and financial account centering on direct
investment in addition to the surplus in the current account, while in the case of Japan, the background was the surplus in the current account and a drastic change in indirect investment (turning from deficit to surplus). What is interesting here is that a similar pattern is envisaged behind the background relating to the current account with respect to the rapid increase in their reserves both in China and Japan. However, the fact is that there is a considerable difference between the contents of the capital and financial account of China and those of Japan. Then, let's observe the capital movement of Japan, noting indirect investment in particular.
3. Capital and Financial Account of Japan
The capital and financial account mostly comprise the financial account. It is therefore sufficient to see this for the time beingC5>̲ As Figure 5 shows, the financial account, which makes a shape contrary Figure 5 The current account and main items of the financial account of
Japan
in 10 trillion yen 25
20
15
10
5 ゜
‑5
‑10
‑15
‑20
0 Current account Financial account Direct investment Securities investment
̲. F. manc1al derivatives .... " .. ・Other financial account
[Source] the same as in Figure 4.
1995 2000