TheJbPaneseJouraatefPsychenemicScience
2009,Vol.2S,Nn.1,35-43
Original
Artiele
Hemodynamic
changes
A
study
withinresponse
to
the
stimulated
visual
quadrants
24-channel
near-infrared
spectroscopy
Shuichiro
TAyA*,
Goro
MAEHARA*2,
andHaruyuki
KoJiMA*3
Universit):
of Surrey*,McCill
Uitiversdy,*2
and KanazawaU)ziverisly*3
Near-infrared
spectroscopy(NIRS)
is
attracting grewinginterest
as a powerful toolfor
monitQring cortical activation associated with various psychological phenomena.Many
NIRS
studies have aimed toexplore brainfunctions
associated with visual perception. However, howNIRS
can rnonitor hemodynamic responses inthe visual cortex corresponding tostirnulation ofeach visual quadrant
is
not wellknown.
Here
we measured changesin
concentration ofoxygen-ated hernoglobin and
deoxygenated
hemoglebin
'in
the
human
visual certex with a 24-chNIRS
instrumcnt.
Through
individual
stimulatjon of visual quadrants we found that NIRS coulddifferentiallymonitor activation of theleftand right hemisphere when the Lower visual fieldwas
stimulated,
but
hardly
detected
activation ofboth
hemispheres when the upper visual fieldwas stimulated.The
result offMRI
scans using the same stimuli suggeststhat
thedifferent
measure-ment responses toupper- and lower visual fieldstimulation are caused by the differencesinthedepth
from
the sca]p of the region representing each visual fieid.On
thebasis
of the present resu]ts, wediscuss
thelimitations
and potential ofNIRS
measurements.Key
words:near-infrared spectroscopy, visual cortex,retinotopy,fMRJ,
brain
imaging
Introduction
Near-infrared spectroscopy
(NIRS)
isa relativelynew
brain
imaging
technique, which measuresrela-tivechanges inthe hemoglobin concentratjon
(for
a review, see VMringer & Chance, 1997; Strangman,Boas,
&
Sutton,
2002},
The
use ofNIRS
has
scveraldisti,nct
ad vantages compared with other brainimag-ining
techniques. such asfunctional
magneticreso-nance
irnaging
(iMRI)
and positron emissiontomo-graphy
(PET),
Firstly,NIRS can separately rneasurethe changes
in
the concentration of oxygenatedhe-moglobin
(oxy-Hb)
and deoxygenated hemoglobin{deoxy-Hb),
whereasfMRI
andPET
cannotdistin-guish between thesetwo indices.Secondty, the NIRS
* Department of
Psychology,
University
ofSurrey, Guildford,
Surrey
GU2 7XH, UK s.taya@surrey.ac.uk
*2 McGM Vision Research, McGi]t University,
MontreaL
Quebec
II3A IAI, Canada, goro.maehara@rnai].mcgilLca
*3 Department of Psychology,
Kanazawa
sity, Kanazawa, Ishikawa 920-1192,
Japan,
hkojima@kenroku,kanazawa-u.ac.jp
equipment isrelatively compact and
its
measure-mentis
relatively non-invasive, which enab]es moni-toring of human cortical activity in a variety of experimentai tasks,such as those requiringbodily
movement or with participants who mjght not be
applicable forother imaging techniques, sueh as
in-fants
or people withdevelopmental
disordcrs.
These
advantages might encourage psychologists to
con-duct
experiments usingNIRS,
possibly combinedwith psychophysical methods. Those researchers
could
be
interested in the measurement ofbrain
functioning
associated with visual perception, The scope of thjsarticle istoprovide them with practica]data
ofNIRS
measurementsin
response to visual stimulation.A number of studies have used NIRS to monitor
braln activation of the visual cortex of adults
{Kato,
KameL Takashima, & Ozaki, 1993;Takahashi, Ogata,
Atsumi, Yamamoto, Shiotsuka, Maki, Yamashita,
Ya-mamoto,
Koizumi,
Hirasawa,
&
Igawa,
2000;
Colier,
Quareslma,
Wenzel,
vander
Sluijs,
Oeseburg,
Fer-rari,
&
Villringer,
2eOl; Maehara, Taya,&
Kojima,
NII-Electronic Library Service
36
The
Japanese
Journal
of Psychonomic Science VoL 28,No, 12005; Schroctgr. Bttcheler,MUIIer, Uludag,
Obrig,
Lohrnann,
Tittgemeyer,
Villringer,
&
vonCramon,
2004) and infants
CMeek,
Elwell,
Khan,Romaya,
Wyatt, Delpy,
&
ZekL 1995; Taga, Asakawa, Maki,Konishi,
&
KoizumL
2003).
These
studies were mainly concerned with the temporal characteristics ofNIRS
measurementsin
the occipital region. Ithasbeen
reported that oxy-Hbincreases
anddieoxy-Hb
decreases
with alag
of2-4
safter theonset of visual stLmulation(Colier,
et al. 2001; Schroeter,et al,,2004;Taga, et al.
2003].
Spatial
characteristics of NIRSmeasurement
in
the occipital corLex,however,
arelesswe!1 understood. The retinotopic organization, L
e. the point-to-pointmapping of thc visual
'field
ontothe cortex,
is
one of thefundamental
features
of thevisual cortex and
has
been
vastly examined withfMRI
and PET(DeYoe,
Carman,
BandettinLGIick-man,
Wieser,
Cox,
Miller,&
Neitz,1996; Dougherty,Kock,
Brewcr,Fischer,
Modersitzki,&
Wandell,
2003;
EngeL
GIover,
& WandelL 1997; Shipp, Watson,Frackowiak,
&
Zeki,
1995),
The goal of the present study isto clarify the
mea$urable and immeasurable area
in
thevisualcor-tex with NIRS.
The
measurable cortical depth withNIRS depends on the distance between the
near-jnfrared
(NR)
light emitting-optode and detecting-optode; i.e.the larger the interoptodc distance,thedeeper the measurable
clepth.
The optodedistance
isabout 30 mm inmost NIRS
instruments
because
thisdistance
is
optirnal formeasurernents of cortica]sur-face.
Due
tothistechnicalrestriction,NIRS
can only rmeasure regionslocated
20-30 mrnbelo"r
the scalp(e.g.
Chance,
Zhuang, UnAh, Alter,& Lipton, 1993,but also see ZefC
White,
Dehghani,
Schlaggar,
&
Cul-ver, 2007). However,
it
is
highlylikely
that someparts
of the visuai cortex arelocated
far
deeper
thanthe NIRS sensitive depth, because the visual cortex
extends within and around the ca]carine sulcus.
Therefore,
it
t・vouldbe
important
for future NIRS studies to clarify which part of the yisual fieidis represented intheseimmeasurable
cortical areas.
1'lere
we measured the activity of theadulthuman
visual cortex with a 24-channel NIRS equipment.We monitored the changes inoxy-Hb concentration
and deoxy-Hb concentration
during
theindividual
A
B
x'C
l-9cm-1
・/'
9
rtif
2{g)
3ge
i
@8O9eertOOO
" 12 13 140Olsee
ri60t7asB
""-・.
k'228232ge'242o'
i
O
emitter
op
detector
Figure
1,
(A)
An
examp]e of a stimulus,(B)
Stimulated visual fields.
(C)
Themcnt of the 16 photodiodes and the location
of the
24
measurernent channels.White
and gray circ]cs show the NR lighternitters
and the detectors,respectively. The digi'ts
indicate
thenumber of channels,stimulation ofcach of the fourvisuakquadrants with a
high-contrast
flickeringchecker-pattern. Inaddi-tion,we conducted
fMRI
rncasurernent with thesamevisual stimuli tolocatecortical regions
correspond-ing
to each quadrant.Comparing
the activatjonmaps obtained with these two imaging techniques,
we will
discuss
possibilities andlirnitations
ofNIRS,
Methods
Participants.
Twenty
healthy
adults.including
the three authors,
(ten
males and ten femaLes;meanage:
24.0
±4.9
years,range:19-・41
years)participatedinthe expcriment. All had nermal or corrccted-to-normal vision. AIIparticipant.swere informed about
NIRS
and the purpose of the experiment andin-formed consent was obtaincd
from
allparticipants.The experiments were conducted
fo]lowing
theDec-larationof IIelsinki.
Visual stimulation. Stimu]i were prescnted on a
22-inch
CRT
moniter with a pixelresolution of 1024 ×768 and a vertical refresh rate of 60 Hz. The time course of the stimulus presentation was controlledby
aPC.
The
participantsobservedthe
stimuli at aS.
TAyA
et al.:Hemodynamic
changesin
response to thestimulatedvisual quadrants37
viewing distanceof 1OO cm inadark room with their
head
on a chin-rest.
The
visual stimulus was ahigh-contrast
radialchecker-pa'ttern presented against a gray
(51
cd/m2)background
{Figure
1A).The
dtameter
of the check-er-pattern was12
deg
in
visual angle. The white andblack
areas ofthe
pattern(104
cd/m2 and2
cd!m2, respectively) were reversed at a temporal frequencyof 7.5Hz. The checker-pattern was divided intofour sector
iorms
and appeared atindividual
quadrants ofthe visual field
CFigure
IB). The sectors were sepa-ratedby
a1
deg
gapfrom
each other to preventstimulation of cells located of the border of the
left
and right visualfields,
and reception of signals from adjacent quadrants(e.g.
Fukuda,Sawai,
Watanabe,Wakakuwa, & Morigiwa, 1989). A red-lined O.5deg
square was presented as a
fixation
pointat thecenter of themonitor,
Procedure.
One
measurement session consisted ofan initial30-sresting period and fiverepetitiens of a
stimulus sequence, comprising of a
15-s
stimulatingperiodfqllowed by a 30-sresting period, Durjng the
stirnulating period,both thechecker-pattern and the
fixation
point were presented.In
the resting peried,only the fixationpoint was presented, Participants
were instructed tomaintain fixationfrom the
begin-ning totheend of each session.
The
visualstimula-tion was given on one of the four quadrants of the
same visual
field
for
each session.The
order of visualfield
stimulation was randomizedfor
eachpartici-pant
Two
sessions{10
repetitions ofthe
stimulationperiod
in
total)were carried eutfor
each quaclrant.NIRS recording. A 24-channel NIRS instrument
(ETG-4000,
Hitachi Medical Co.)generated twowave-lengths
ofNR
light
(635
and830
nm) and measuredtemporal changes
in
the concentra'Lion of oxy-Hb anddeoxy-Hb with a ternporalresolution of
O.1
s,
We
used a4X4
matrix of photodiodes consisting of eightlight
emitters and eightdetectors
for
themeasurement
(Figure
IC).
The
bLood
oxygen levelwas measured at the
30-mm
area between eachemit-terand detector pair. The 16 photodiodes composed
24 measurement channels. These photodiodes were attached toa
flexible
siliconframe
and placedonthe
participants'occipital area so that ch 23
{the
centerof the bottom row of the 4×4 matrix) was placed
O,5
cm above the
inion.
The
photodiodes covered a9
×9
crn area of the scalp,
inc]uding
Ol
and02
following
the international IO120 system. According to
Oka-moto et aL
{2004),
whoinvestjgated
thecranio-cerebral correlation based on the internationa],1O120 system,
the
monitored cortical area with thisoptode arrangement would include the visual cortex(Vl-V3) inboth hemispheres.
Data
analysis,Prior
toperforming the statistical analysis, we corrected the raw data with thefQllow-ing
procedures.First,
the rawdata
weredigitalLy
low-pass filteredat O,1Hz to remove measurement
noise
<i.e.
an abrupt rise andfall
ofmeasured values),Next, a
baseline
correction was performed toremovethe linear trend in hemoglobin concentratiQn. We
fitted
alinear
function
to
the
data
points sarnpledduring 1O-speriods beforeand after theonset of each
sttmulation period,
After
this,
we subtracted valuesof the baselinefunction
from
data obtained foreachstimulus sequence.
Since
raw data of NIRS are relative values, wecannot directlycompare them among participantsor
channels.
Therefore,
the
data
were normalizedby
calculating`effect
size'for
each channel withinpar-ticipants
(Matsuda
&
Hiraki,2006;Otsuka,
Nakato,
Kanazawa,
Yamaguchi,
Watanabe,
&
Kakigl,
2007;Schroeter,
Zysset, Kruggel, & vonCramon,
2003).
The
effect sizes(d)
were calculated with thefoLlow-ing
equation:
d=(ml-m2)ls
with
`m
1'as themean valuesin
a stimulation period,and 'm2' and `sZ respectively, as the mean and
the
standard
deviation
of the values sampledduring
the10s
periodbefore
the stimulation. We used theeffect size value forthe ]ateranalysis.
For
the
statistical analysis, we conducted atwo-tailed,one sarnple t-testagainst zero performed on
the means of the effect sizes obtained from each channel and averaged over the 10 stimulation
peri-ods, Since theeffect sizes represent the standardtzed
Hb-Ieveldifferencebetween thestimulation and
rest-ing period, this analysis reveals the channels that
were significantly activated
by
the
visual stimula-tion. The statistical threshold was setatp<.05 withNII-Electronic Library Service
38 TheJapanese
Journal
ofPsy'chonomic
Science
VoL 28,No. 1the Bonfferoni correction.
fMRI scanning. We scanned three of the 20
par-ticipants
wlth fMRLThe
configuration andpresen-tation time course of the stimuli forthisfMRI
sean-njng were
the
same asin
theNIRS
measurement,Functional images were acquired using a3.0Tesla
MR
scanner(Trio,
Siemens,
Erlangen,
Germany).
For
functional imaging during the experiment,
T2*-weighted gradient echo-planar irnaging
CEPI)
se-quences was used
to
produce30
slices{TR
==2000
ms,TE=30ms,
FA=76dcg,field
of view{FOV)=192
mm, voxel size--3.0 ×3.0X2.0mm). A
high-resolu-tion anatomical Tl-weighted
image
was alsoac-quired
by
magnetization-prepared rapid-acquisitiongradient-echo
(MP-RAGE)
imaging
<TR=2000ms,
TE=4.38 rns, FA=8deg, FOV=240mm, and voxel
size=O,9X
O.9
×O.9
mm)for
each participant.The data were analyzed using statistical
paramet-ric mapping
5
(SPM5;
Wellcorne
Department ofCog-nitive
Neurology,
London,
UK,
www.fi1.ion.ucLac.uk! spm). Thefirst
five
volumes of each fMRI session werediscarded
toallow forstabilization of the mag-netization, and the remaining 705 volumes were usedforanalysis. Head motion was cerrectcd using
the
realignment program of
SPM5.
Inaddition, thedatawere spatially smeothed inthreedimensions using a
4-mm
full-width
half-maximum
Gaussian
kernel,
O.6
Generalized
linear model(Friston,
HelmesWorsley, Poline, Frith, & Frackowiak, l995) was
adopted to assess the
BOLD
(BIood
Oxygen
Level
Dependant> signal contingent with the neural
activ-ity.
As
explanatory variables ofGLM,
we preparedthe model of the neural activation related to the
stimulation of each visual quadrant
by
convolvingthe Box-car function with the hemodynamic
re-sponse function. Based on this model, the effects of each explanatory variable
(beta)
and t-value were ca]culatedfor
each voxel. The neura] activation associated with each visual quadrant wasdefined
by
the
difference
between the effect of targetquadrantand the totaleffects oi three other quadrants
(e.g.
effect of UR=3UR--(UL fBR+BL}). The statistical
threshold was set at
P<,05
with a correct'ion basedon the
false
discovery
rate(Genovese
et al.,20e2).
Results
Temporal
change.In
accordance with prevjous studies(Colier
et al. 2001;Takahashl
et aL2000;
Taga et aL,
2003L
wefound
anincrease
ef oxy-Hband a decrease of deoxy-Hb
during
the stimulationperiod,
Figure
2 shows an example ofthe
rawdata
after
low-pass
filtering.
As
thisfigure
shows, oxy-Hbincreased
(and
deoxy-Hb decreased) gradually 2-4 safter the stimulus onset.
Also,
it
canbe
seen thattheO O.5 o
2
o.4"E o.3
・E.
o.2g
o.t c ru o =8
-o.i
Z
-o.2
-O.3
O 20 40 60 80 100 "2e 140 160 180 200 220 240Time
(sec)
Figure 2. An example of the time course of the changes in the IIb concentration, The unit of thc
ordinate
is
a relative value, mm*mo].The
figure
represents the tirnecourse of theHb
changesmeasured at ch
l7
of a participantduring
one sessionin
which thelower
left quadrant wasstimulated. The changes
in
the oxy-Hb concentration areindicated
by
the gray lineand those fortbedeoxy-Hb concentration are indicated
by
the black Iine.S.TAyA et al:Hemodynamic changes inresponse to thestimulated visual quadrants
39
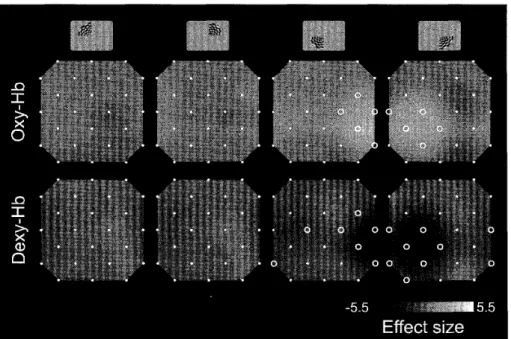
Figure
3.
Topographjc
rnapsfor
the
Hb
changes obtained with stimulation of each visual quadrant.Thc orientation and ehannel
location
of these rnaps correspond to thosein
Fig
IC.
The mapsrepresent the results from stimulation of the upper left,upper right, lower ]eft,and lower right visual
fieldquadrant
('from
Ieftto right). The upper row shows the maps for oxy-Hb and thelower
rowshows those for deoxy-Hb, The lighter and darker areas indicate the increase and decrease of
hemoglobin
concentrations, respectively.The
dots
and circles on each map represent thelocations
ofthe measurement channels.
These
topographic maps were madeby
interpolating
the mean effect sizeobtajned at each channe] through spline-fitting.
dqcrease
ofdeoxy-Hb
reached itspeak slight]ylater
than the oxy-Hb
increase.
These
time courses ofHb
change were ingood agreement with previous NIRS studies(Takahashi
et al.2000;
Taga
et al,,2003),
The
figurealso shows that thehemoglobin conccntration
gradually
increased
ordecreased
throughout anex-perimental sessjon.
The
source and mcaning of this]ongitudinal
driftof thehemoglobin
concentration are stillunclear,but
they are assumingly' causedby
"physiological
effects such as change$
in
respiratory or cardiac activities and body movements" or"meas-urement
instability
such as unstab]e contactsbe-tween the opticul probe and the head and the
unsta-ble
power ofNIR
Iight"(Taga
et al.,2003). As notedin
theData
analysis section, we removed thelinear
trend by performing thebaseline correction,
Topographic
map. Figure 3 topographicallyrep-resents the changes
in
regiona] concentrations ofoxy- and deoxy-Hb for20participants.The channels
which detected significant Hb changes are indicated
by circles inthis figure
(two-tai]ed
one sample t-test,p<.05
withthe
Bonfferoni correction}.The
resultsshow thatNIRS can detectthe neuro-vascular
activa-tion concordant with the contra-lateral structure of
Lhevisual cortex. The lower-rightquadrant stimulus
produced significant
hemodynamic
changes at theleftoccipital area, whercas the lowcr-leltquadrant stimulus produced
these
at the right occipital area(right
panelsin
Figure3).
On
theotherhand,
none ofthe channels detected significant hemodynamic
changes when stimuli were presented to the upper visual
field
(left
panels),
Significant
increase
of oxy-Hb concentration wasfound
on the contra-Lateral side of the stimulated visual hemifield. The changes ofdeoxy-Hb
concen-tratton,however, werc more wide-spread
{Figure
3).
There
werc significant changesin
deoxy-Hb
concen-tration not on]y on thecontra-lateral side, but also on theipsi-latcraL
side of the stimulated visualhemi-fie]d. For example, ch ]4 and ch 21 detected a
significant decrease of deoxy-Hb concentration with
right visual
hemificld
stimulation, although thesechanne]s were
located
on theright side of theNII-Electronic Library Service
40
The
Japanese
Journal
ofPsychonomic
Science
VoL
28,
No.
1
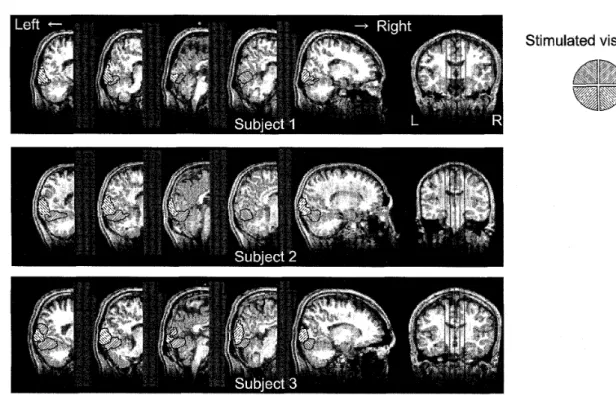
Stimulated
visual areassta
wage
Figure
4. The results of fMRI measurernent. The figure shows the retinotopic area in 5 slices of thesagittal plane with a 10-mm width for three participants. The retinotopic areas are indicated
bv
patterned patches on
the
brain
images
(see
quadrant sectors on the rightfor
the relationshipbetween
patterns and visual quadrants),
The
sLatistical threshold was set atp<.05, with a correction based onthe falsediscovery rate.
illlifiilii
ig#ifim
l Itttt
t'
・''l't.I'.
,d'
'
'
''
' . . . e' .-.
'
'
-.'
. e.
- opee
Numberofparticipants:
o
1
3
s7
9M
Figure 5. Histograrn of the t.otal number of significantly activated channels summed across 20
participants. The maps represent the results
from
stimulation of the upper Ieft,upper righL lowerleft,
and lower right visual fieldquadrant
(frorn
leftto righO. Smail dots indicaLe the location of eachmeasurernent channel,
Gray
andb]ack
circles show the resultfor
oxy-Hb anddeoxy-Hb,
respectively.
The
radius of each circlcindicates
the number of the participants who showed a significantHb
changes(p<.05)
at the corresponding channel.S.TAyA et aL: Hemodynamic changes inresponse tothe stirnu]ated visual quadrants 41
difference
between the two indices suggests thatthemeasurements of oxy-Hb and
deoxy-Hb
concentra-tionsreflect
different
aspects of neuro-vascularacti-vation.
OuT
results arein
accordance with the resultsof Suh, Bahar, Mehta, & Schwartz, 2006, who
re-ported that decreases in the deoxy-Hb
concentra-tionswere
less
localized
than theincrease
in
thetotaihemoglobin concentration.
fMRI
data.
We
found
thatNIRS
candetect
theHb
changes in the occipital area corresponding with stjmulation of the lower visualfield.
On
the otherhand, no channels detected significant Hb changes
with stimulatjon of the upper visua]
fie]d,
One
plau-sible explanation of theseresultsis
thatonly thearea representing the lower visual fieldlocated aroundthe $urface of occipital cortex
is
included
in
the
range of NIRS measurement, while the area
repre-senting the upper visual
field
is
located
far
deeper
than the measurable range of NIRS. The aim of the
fMRI
measurement was toexamine thispossibility.Itcan
be
seenfrom
Figure
4
thatstimulation of thelower visual field activated the cortical region
around theoccipita] surface, whi]e stirnulation of
the
upper visual fie]dactivated the deeper regions fromthe occipital surface
(more
than30rmm).
In
sum-mary, theresults effMRI
scans suggest thatcortical regions corresponding to the upper visual fieldareindeed
located
toodeeply
to
enable NIRS-measurements of Hb changes.
Individual
differences.
Figurc5
showsthe
fre-quency distributtenof significant Hb changes across
20 participants. The ehannels that detected
sig-nificant
H.
b
changes arelocated
around a certaip areaof the visual cortex presumably represcnting each
visual quadrant. However, itshould be noticed tbat several channels
located
far
from
the center of thepopulation still
detected
statistically significantHb
changes. 1'hiswide-spread
distribution
of activated channels shows that large individual differencesinsize and location of thehurnan visual cortex exist.
Discussion
We
found
significantHb
changes whdn stirnuliwere presented tothelower visuaL
field,
Incontrast,significant
Hb
changes were notdetected
in
aliof thechannels when stimuli were presented tothe upper visual
field.
These results sugge$t that NIRS candetcct
activation of the cortical area correspondingtothe
lower
visualfield,
but
canhardly
detect
activa-tion of the cortical area corresponding to theupper visual field.
The
absence of significantHb
changeduring
stimulation of the upper visual fie]dmight bedue tothe
fact
that the area representing the upper visualfieldislocatediardeeper than the measurabLe depth
with standard
NIRS
instruments,
The
upper andtower visual field,respectiveLy, are represented by
the cortical area located above and below the cal-carine sulcus,
Vjewed
from
the side,thesulcu$ slants upward from the posteriortothe anterior partof theoccipita]
lobe.
Thus,
viewedfrom
the
back,
the
arearepresenting the lower visua] fie]d
is
exposed to-'wards the su]cus, while covering thearea
represent-ingthe upper visual
field
thatis
located
in
thedeeper
partof theoccipkal lobe.As mentioned earlier, NIRS measures
hemodynamic
changes approxtmately20-30 mm under the scalp, TheTeiore, the visual area representing
the
upper visualfield
mightbe
located
fardeepeT than the measurable depth, We confirmed
this
possibility using fMRI. The imaging datashowed that the stronger activation was obtained at
the deepcr partof the occipital
lobe
in
the conditionsof
tine
upper visual-field stimulation thanin
the
con-dition
ofthclewer
visual-field stimulation(Figure
4).
A recent study has shown thata new optical
jmaging
tcchnique, called diffuseoptical tomography
<DOT),
enables us tomonitor Hb changes inthe deeper
part
of the cortjcal region
because
of alonger
optodcdistance of up to48 mm
(Zeff
etaL 2007). ZeffetaLshowed that DOT can monitor Hb changes
corre-sponding tothe upper visual
field
$timulation. How-ever,increase
of signal nolseis
inevitable
whenNR
lights
penetratefar
deeper from the scalp(Sase,
Eda,
Seiyama, Tanabe, Takatsuki, & Yanagida. 2001).
Thus, our results suggest that researchers still
should
be
careful about monitoring the acti,vation of visual cortex representing upper visualfield,
evenwhen using rhe
DOT
technique.We found individua] differenccsjntlhelocationof
NII-Electronic Library Service
42 The
Japanese
Journal
of Psychonomic Science VoL 28,No. 1Hb changes
{Figure
5}.This finding isinaccordance with theindividua]
differences
in
size and]ocation
ofthe visuai cortex observed in our fMRI scanning
(Figure
4),
a$ well asin
previous studies(e.g.
Dougherty et al,,2003;Takahashi et al.,2001; Zeffet
al.,
2007).
Thedifferences
suggest that pre-measurementsfor
deciding the region-of-interest are advisable formonitoring the activation of the visual cortex withNIRS;
i.e.
a prellminal expertment usingNIRS to find the channels which can be activated with a `localizer'
(e,g,
aflickering
checker-pattern as used inthisstudy) could be made beforc examiningthe main experimental stimulus. Another possible
factor
for
theindividuai
differences
is
the way ofdjrecting attention. fMRI studies have shown that
the cortical activation of primary visual cortex can
be modulated by spatial attention
(e.g.
Brefezynski &DeYoe,
1999).
Although
we asked our participants tofixtheirgaze on thefixationsquare, we did not give
any jnstruction about attention, thus itispossibLe
that the
difference
in
attended parts caused the indi-vidual differences of the NIRS activation map.
In
summary, wedemonstraLed
that
NIRS
cande-tect tl]ehemodynarnic changes caused by
stirnula-tion
ofthe
lowcT
visual fic]d,but
hardly
dcteets
the activation in cortical regions corresponding to theupper visual field.Our finding suggests that in
fu-tureexperiments one should
bear
thisin
inind when monitoring the activation of human vjsual cortex,On
the otherhand,
our results also show thatNIRS
is
quite sensitive tothe cortical activation ifa target
area
i$
included inthe measurable rangc. Furthcr,the
di
fference
ofoxy-Hb anddeoxy-Hb
de]n
onstratedhere imply that thcse two indices could reflect the
differentaspects of neLrro-vascular functioning, By
comparing oxy-Hb and deoxy-Hb, we could obtajn a
more cornplete picture of the connection between
neurat and vascular responses.
Taken
together,
NIRS can provide us with a greatcr chance toexplore
thc brain functioning that cannot
be
assessed withothcr
1rnaging
techniques. NIRS would be adesir-able technique formonitoring the cortical activity of
infantsand neonates
<e.g,
Otsuka et al. 2007;Taga, etal. 2003). Monitoring thc brain activity associated
with tasks that cannot be perforrned in an fMRI
scanner isalso a promising directionof NIRS usage
{e.g.
Hatakenaka,
Miyai,
Mihara,
Sakoda,
&
Kubota,
2007).
Acknowledgements
We
are grateful to Dr.Gerard
Remijn
for
he]pful
comrnents on this papcr. We also thank to Dr.
Yasuto Tanaka and Dr.Yusuke Morito fortheir
co-operation tothe
[MRI
analy$is,Thi$
research wassupported by the
COE
program of KanazawaUniver-sity on
Innovative
Brain
Science
of theJapanese
)v・Tinistr},of Education, Culture, Sports,Science and
Tcchnology.
References
Brefczynski,
J.
A. & DoYoe, E,A,(1999),
Alogicalcorrelate of the `spotlight' of visual
tion.
Alature
Aieuroscience,
2,
370-374.
Chance,
B.Zhuang,
Z.,
UnAh,C.
A]ter,C.,
&
Lipton,
L,
(1993).
Cognition-activated
low-frequencyuiaLion of lightabsorption in human brain.
ceedings
of
theIVlttional
Aeademy
of
Sciences
of
the
Vbeited
Siates
ofAmen'ca,
9e,
3770-・3774,
Colier,
W,N.
J.
M.Quaresima,
V. WenzeL R. van der
Sluijs,
M.
C.Oeseburg,
B,,Ferrari,
M.,
&
Villringer,
A.
(200]}.
Simultaneous
near-infraredcopy monitoring of
left
and right occlpital areasreveals contra-lateral hemodynamic changes upon
hemi-field
paradigm. VisionResearch,
41,97-102.
DeYoe, E.D.
Carman,
G.
J.
BandettinL
P.
Glickrnan,
S.Wieser,
J.,
Cox,
R.,Miller,D,,& Neitz,J.
(1996),
Mapping
striate and extrastriate visual areasin
human
cerebral corLex. f]7,oceedingsof
the IVtttionalAcademy
of
Sciences
of theUbiitedStatesofAmerica,
93,
2382-2386,
Dougherty, R.F. Kock, V.M. Brewer, A.A.,Fischer,
B. ModersitzkL
J.
& Wandell, B.A.(2003).
Visual
field
representations andlocatjons
of visual areas
V]f213
in
human
visual
cortex.foumalof
Vision,
3,
586-598,
Engel,
S,A.
Glover,
G.H.
&
Wandell,
B.A."997).
Retinotopic organization inhuman
visual
cortexand the spatial precision of
functional
MRL
bmalCo・rtex,7,l81-192.
Friston,K.
J.,
Holmes A,P.Worsley, K.J.,
Poline,J.
P.Frith,C.D,,& Frackowiak, R,S.
J.
(1995).
Statisticalparametric maps infunctional
imaging:
A generallinearapproach. Uhrman Brain.-fkipping, 2,189-2lO.
Fukuda, Y,,SawaL H. Watanabe, M, Wakakuwa, K.,
& Morlglwa, K,
(1989).
Nasotemporal overlap ofcrossed and uncrossed retinal ganglion cell
t{ons in the
Japanese
monkey(fidacaca
fuscata).
S.
TAyA
et ai.:Hemodynamic
changesin
response tothe stimulated visuaLquadrants
43foumal
of
.Nliurescience,
9,
2353-2373.
Genovese,
C.R.Lazar,
N,A,,&
Nichols, T.(2002).
Thresholding of statistical maps infunctional
neu-roimaging using the
false
discovery
rate.Aigttro-image,
15,870-878.
Hatakenaka, M. Miyai, I.Mihara, M,, Sakoda, S,,&
Kubota, K.
(2007).
Frontal regionsinvolved
in
learning
of motor skill&
afunctional
NIRS
stud}r.Aiizuroimage,34, 109-1 16.
Kato.T. Kamei, A. Takashima, S.,& OzakL T.
{1993).
Human
visual corticalfunctien
during
photic sti-mulation monitoringby
means of near-infrared spectroscopy.Jbuvaal
Qf'CerebratBtood Flotv& Mb-tabolis.m, 13,516-520.Maehara.
G,
Taya,
S.
&
Kojirna,
H.
(2007),
Changes
in
hemoglobin
concentrationin
thelateral
occipital regions during shape recognition: A near-infraredspectroscopy study.
fournal
of
BiomedicalQPtics,
12,
062I09-[8
pp],Matsuda,
G.
&
HirakL
K,
(2006}.
Sustained
decrease
inoxygenated hemog]obin during video gamcs in
the
dorsal
prefrontalcortex:A
NIRS
study of
dren.
Neurolmage, 29, 706-711.Meek,
J,H.
ElwelL
C.E,, Khan, M.J. Romaya,J.
Wyatt,
J.
S.Delpy, D.T.,& ZekL S.{1995).
Regionalchanges
in
cerebralhaemodynamics
as a result ofavisual stimulus measured
by
nearinfrared
troscopy.Proceedings qftheRayal
SocieCy
QfLondonB:BiologicalScience,261, 351-356.
Miki,
A.
Nakajima,
T.
TakagL
M.
Usui,
T.,
Abe,
H.
Liu,
C.
S,J.,
&
Liu,
G,
T.
(2005).
Near-infrared
troscopy of the visual cortex inunilateral optic
neuritis. Amen'can
fournal
of
QPhthalmotog:y,
139,
353-356.
Okamoto,
M.
Dan,
H.,Sakamoto,
K.
Takeo,
K.,
mizu, K. Kohno, S. Oda, I.Isobe,S,,Suzuki, T.,
Kohyama, K.
&
Dan,
L
(2004).
Three-dimensionalprobabilistic anatomical cranio-cerebral
tion via the
international
10-20 system orientedfor transcranial functional brain mapping.
image, 2L 99-111.
Otsuka, Y.,Nakato, E,,Kanazawa, S.,Yamaguchi, M.
K.,
Watanabe,
S.
&
Kakigi,
R,
(2007).
Neural
tiontoupright and
inverted
faces
in
iniants
ured by near infrared spectroscepy, IVleuroimage.
34,399-406.
Sase,
I.
Eda,
H.
Seiyama,
A.
Tanabe,
I{.
C.
Takatsuki,
A.
&
Yanagida,
T.
(2001).
Multichannel
optica]mappingi
ini,estigation
ofdepth
information,
InB.
Chance,
R,R.
Alfano,
B.
J.
Tromberg,
M,
Tamura,
E.
M,
Sevick-Muraca
CEds.),
l]broceedings
ofSR[E
QPti-calTomQgrmphy
andSpectroscoPy
of
Tissue fV,4250, 29-36.
Schroeter, M.L.,BUcheler, M, M.,MUIIer, K.,Uludag,
K.
Obrig,
H.,Lohmann,
G.
Tittgemeyer,
M,,
Viltrin-ger,
A.
&
vonCramon,
D.
Y.
(2004).
Towards
a standard analysis forfunctional near-infrared im-aging. Aiguro7mage, 2I,283-290.Schroeter,
M. L.,Zysset,
S,,
Kruggel,
F.,&
vonCra-mon
D.
V.
(2003),
Age
dependency
of thehemody-namic response as measured by funcLional
near-infraredspectroscopy. IVteuroimage,19,555-564.
Shipp,
S,,
Watson,
J,
D.
Frackowiak,
R,
S.
&
Zeki,
S,
(1995),
Retinotopic
mapsin
hurnan
prestriateual cortex: the demarcation of areas V2 and V3.
AJeuroimage,2,125L132.
Strangman,
G.
Boas,
D.
A.
&
Sutton,
J,
P.
(2002).
Non-invasive
neuroimaging using near-infraredlight.
BiologicaiIZsychiatry,52,679-693.
Suh,
M,,
Bahar,
S.
Mehta,
A,D.
&
Schwart.z,
T.H,
{2006),
Blood
volume andhemoglobin
oxygenationresponse following electrical stjmulation of human
cortex. Aiguroimage, 31,66-75.
Taga,
G.,
Asakawa,
K.,
Maki,
A.
Konishi,
Y.,
&
zumi,
H.
(2003).
Brain
imaging
in
awakeinfants
by
near-infrared optical topography. Fhroceedings
of
the NLLtionalAcadem)T
of
Sciencesof
the United
States
ofAmen'ca,
100,
I0722-10727.
Takahashi,
K.
Ogata,
S.,
Atsumi,
Y.,
Yamamote,
R.
Shiotsuka, S.Maki, A. Yamashita, Y. Yamamoto,
T. Koizumi, H.,Hirasawa, H. & Igawa, M
(2000).
Activation
of the visual corteximaged
by
channel near-infrared spectroscopy.
Ibumal
of
medicatQPtics,
5,93-96.VMringer
A.&
Chance,
B,(1997).
Non-invasive
cal spectroscopy and
imaging
ofhuman
brain
functjon.
Trendsin
Neuroscience. 20,435-442.Zeff,B.W. White, B,R,,Dehghani, H,,Schlaggar, B.L.
& Culver,
J.
P.(20e7).
Retinotopic mapping of adulLhuman visual cortex with
high-density
diffuseticaltomography.
Ilroceedings
of
theAlationatemy
of
Sciences
of
thebbeitedStates
ofA
merica, 104,12169-!2174,
![Figure 2. An example of the time course of the changes in the IIb concentration, The unit of thc ordinate is a relative value, mm*mo]](https://thumb-ap.123doks.com/thumbv2/123deta/9864669.982335/4.892.192.720.797.1080/figure-example-course-changes-concentration-ordinate-relative-value.webp)