1. Introduction
Large amounts of inorganic nutrients, such as nitrogen and phosphorus, are supplied from rivers into estuarine tidal flats. In addition, physical environmental factors, such as tempera-ture, salinity, and nutrient concentrations, vary widely in the short term because of the tidal
cycle. Many secondary producers, which feed on organic matter on the sediment surface or suspended organic matter, inhabit tidal flats (COLIJN and DIJKEMA 1981; COLIJN and de JONGE 1984). Primary producers, such as pelagic and benthic microalgae, support the biological pro-duction of higher trophic level organisms.
Benthic microalgae inhabiting the sediment surface are major primary producers in tidal flat ecosystems (ADMIRAAL, 1977), and primary pro-duction in the surface sediment has been measured in various regions (JOINT, 1978; COLIJN and de JONGE, 1984; BARRANGUET et al., 1998). On the other hand, higher trophic level organisms in tidal flats are supported by pelagic
phytoplank-La mer 54 : 55-72, 2016
Société franco-japonaise dʼocéanographie, Tokyo
Seasonal variation of primary productivity in the Shinkawa
River estuary, eastern Seto Inland Sea, Japan
Keigo H
IGASHIZONO1), Hitomi Y
AMAGUCHI1), Kuninao T
ADA1)and Kazuhiko I
CHIMI2)Abstract: Seasonal variations in the increase rate of chlorophyll (Chl.) a and the primary
production rate were measured by in situ seawater incubation in the Shinkawa River estuary in the Seto Inland Sea, Japan. Nutrient concentrations in the seawater were always sufficient for the growth of phytoplankton. The study site was very shallow, but photo-inhibition, which occurs at high light intensities, such as > 1,000 µmol/m2/s, was not observed in photosynthesis test samples. Therefore, light intensity was a minor factor to explain primary production in this area throughout the year. Chl. a concentration reduced a little or was almost constant at low water temperatures. In contrast, Chl. a concentration increased significantly in the period of high water temperature (July to September), showing a maximum specific increase rate of 0.3-0.4/h. The primary production rate was also high while water temperature was high. Monthly primary production rates, estimated from water temperature and PAR, varied from 0.01±0.00 to 1.13±0.24 gC/m2/day, which was similar to that reported for other estuaries and coastal seas.
The most influential factor in primary productivity in this study area was water temperature, with peak temperatures associated with extremely high primary productivity, with up to 460 µgC/l/h recorded in summer.
Keywords: Estuary, Primary production, Chl. a, Nutrient, Light
1) Faculty of Agriculture, Kagawa University, Miki, Kita, Kagawa 761-0795, Japan
2) Seto Inland Sea Regional Research Center, Kagawa University, Kamano, Aji, Takamatsu, Kagawa 761-0130, Japan
*Corresponding author:
56 La mer 54, 2016
ton in the water column and are also major primary producers. CLOERNet al. (2014) previous-ly summarized the features of primary productiv-ity in coastal seas. For example, primary produc-tivity was reported as 300-400 gC/m2/year in
Chesapeake Bay and 200-300 gC/m2/year in
Tampa Bay, both in the United States, and 400-500 gC/m2/year in Tokyo Bay and 100-200
gC/m2/year in the Seto Inland Sea, both in Japan.
BOYNTONet al. (1982) also summarized primary production rates in the water column for 45 estuaries with the wide range of 19-547 gC/m2
/year. In addition, CLOERNet al. (2014) reported that the primary production rates in the Swan Estuary, Australia and the Cienaga Glande Estuary, Colombia were apparently higher (1,000 gC/m2/year) than in coastal areas. Many reports
about primary production rates have focused on European and North/South American estuaries, which were located on large rivers (For example, FLEMER, 1970; GAMEIROet al., 2011). On the other
hand, have been few reports on the small-scale estuaries, as seen around the Japanese coast, where environmental parameters, such as tem-perature, light intensity and nutrient concentra-tions, change drastically with the tidal cycle.
In this study, we examined the effects of the water temperature, light intensity, and nutrient concentrations on the primary production rate and characteristics of productivity in the Shinka-wa River estuary, Japan.
2. Materials and Methods
2.1 In situ incubation of seawater samples The Shinkawa River estuary, located in Taka-matsu City, Kagawa Prefecture, Japan, has a tidal flat (< 600,000 m2) that appears at low tide. Low
saline water flow into the estuary from Shinkawa River is observed up to several kilometers from the edge of the intertidal zone (Fig. 1). Seawater sampling and incubation experiments were carried out from January to December 2006, April
57
Seasonal variation of primary productivity in an estuary 2007 to March 2008, August to September 2011,
April 2012 to March 2013, May to September 2014 and April to August 2015 at Stn. B, at which the average water depth at high tide was about 1.5 m. Surface seawater was collected using a plastic bucket when the water depth was ca. 70 cm during flood tide. Water temperature and salinity were measured by CTD (AAQ1186S-Pro, manu-factured by ALEC Inc.). Large zooplankton in the collected seawater was removed using a plankton net (mesh size 300 µm), and transferred into a 500 ml clear polycarbonate bottle. These bottles were placed in the sea surface in the field and were incubated for 4-9 hours during the day (08: 00 to 17:00). In 2015, the incubation experiments were carried out in 100% light (L-100%) and three other light intensities. 0%, 10%, and 50%, by shading with a plastic net (L-0%, L-10%, and L-50%, respectively).
Solar radiation levels for the study area (Takamatsu City) were referenced from data recorded by the Japan Meteorological Agency (http: //www.jma.go.jp/jma/). Photosynthetical-ly available radiation (PAR) was calculated as follows. Because the wavelength of solar radiation is 290-3,000 nm, it was multiplied by a factor of 0.48 to convert to the wavelength of PAR (390-770 nm) (MURAMATSU et al., 2008). This value was then multiplied by 4.57 to obtain photon flux density (PFD) in order to convert the units from MJ/m2/d to µmol/m2/s (THIMIJAN
and HEINS, 1983). Because 15% of light is reflected by sea surface (TAKAHASHI et al., 1996), subsur-face PAR was obtained by multiplying by 0.85. 2.2 Concentrations of Chl. a and nutrients
Seawater samples (200 ml) at the start and end of the incubation experiment were filtered using Whatman GF/F. Chl. pigment was extracted for 24 hours with 90% acetone. Chl. a concentration was determined by the fluorescence method
(HOLM-HANSEN et al., 1965) using a fluorometer (10AU, Turner Design Co., Ltd.).
The specific increase rate of Chl. a during the experimental incubation (µ: /h) was calculated using the following equation:
µ (/h) = ln (Ce / Ci) / t (1) Ci, Ce, and t indicate the Chl. a concentration at the start and end of incubation and incubation time (hour), respectively.
Incubated water samples were also filtered through a disc filter (Pore size 0.45 µm; Advan-tech Co., Dismic Filter) to measure nutrient concentrations. DIN (NH4+ NO2+3), PO4 and Si
(OH)4 levels were determined using a nutrient
automatic analyzer (Auto Analyzer III, BL-TEC Co., Ltd.).
2.3 Primary production rates
Primary production was measured by the13C
method (HAMAet al., 1983) using13C solution (0.2
mM). Water samples (200 ml) were filtered using Whatman GF/F, which was then baked at 470℃ to remove organic matter. After the addition of several milliliters of 1 N HCl to avoid inorganic carbon, the filters were stored at -20℃ until analysis. To determine the particulate organic carbon (POC) concentration in the seawater, water samples was also treated using the same procedure. The stable carbon isotope ratio was measured using a stable isotope analyzer (Model-FlashEA1112-Deltav Advantage ConFlo IV Sys-tem, Thermo Fisher Scientific). Primary produc-tion rates were calculated using the following equations (HAMAet al., 1983).
aic= {(13Ccont×0.011+13Cadd)
/(DIC+13C
58 La mer 54, 2016
Primary production (µgC/l/h) ={{POC concentration×
(ais-ans)/(aic-ais)}×f/h} (3) 13C
contand13Caddshow13C content in DIC and
added13C, respectively; a
ic, ais, and ansshow13C
atom% in DIC concentration, 13C atom% in the
POC at the end of incubation, and13C atom% in
the initial POC concentration, respectively; f / h is 1.025, which was the 13C isotopic fractionation
correction coefficient (HAMA et al., 1983) and incubation time, respectively. DIC concentration was determined based on carbonate alkalinity and pH, as described in STRICKLAND and PARSONS (1968). POC concentration was measured using a CHN Coder (JM10, J Science Labo.).
The primary production rates for L-50% and L-100% were similar, as described later in the results. In addition, about 60% of the annual light
at the sea surface reached to the bottom even at high tide at the experimental station (HIGASHIZONO et al. in preparation). Therefore, the integrated primary production rate (mgC/m2/h) was
con-verted using the average water depth (0.75 m) and the primary production rates (µgC/l/h) obtained for L-100%. The primary production rate (mgC/m2/h) was converted to a daily
primary production rate (gC/m2/day) by
multi-plying by the ratio of solar radiation during incubation (h)/daily total solar radiation (h). 3. Results
3.1 Water temperature, salinity, and solar radi-ation
Water temperature varied in the range of 3.7-30.6℃ (Fig. 2). Water temperature was generally lower than 15℃ from November to early April, and 15-25℃ from late April to June or
59
Seasonal variation of primary productivity in an estuary
late September to October (Fig. 2). It generally exceeded 25℃ in July to early September (Fig. 2) . Salinity varied in the range of 20-30, with a lowest recorded level of 14.9 on 23th July 2007
(Fig. 2). Solar radiation varied in the range of 1.20-29.0 MJ/m2/d (Fig. 2). It was lower in June
(rainy season) and October to March, and higher in April to September (Fig. 2).
3.2 Chl. a and nutrient concentrations in sea-water
Initial Chl. a concentration in the incubation bottle ranged from a minimum of 0.50 µg/l to and a maximum of 13.2 µg/l (Fig. 3). The Chl. a concentration was higher in July to September (average 4.73 µg/l; Fig. 3). The specific increase rate of Chl. a in L-100% light was in the range -0.08-0.34 µg/l/h (Fig. 4). A higher increase rate,
0.1-0.3 /h, was observed in July to September when water temperature exceeded 25℃ (Fig. 4). The highest increase rates, 0.34 /h and 0.33 /h, were recorded on 14th August 2006 and on 3rd
August 2015, respectively (Fig. 4). On the other hand, the increase rates in November to April, when the water temperature was below 15℃ , were quite low -0.08-0.05 /h (Fig. 4). The increase rates showed a good correlation with water temperature (Fig. 5).
The increase rate of Chl. a tended to decrease with increasing light intensity (Fig. 6). The average increase rate was 0.01 /h with L-0% (-0.04-0.05 /h), 0.14 /h (0.03-0.39 /h) with L-10%, 0.11 /h (0.00-0.42 /h) with L-50%, and 0.08 /h (-0.01-0.33 /h) with L-100%, showing that the increase rates with L-10% and L-50% were higher than with L-100% (Fig. 6). On 3rdApril,
60 La mer 54, 2016
Fig. 4. Temporal variations in increases in Chl. a concentration.
Fig. 5. Relationship to water temperature and specific growth rate of Chl. a concentration, primary
61
Seasonal variation of primary productivity in an estuary
14thJuly, 27thAugust, and 21thMay, differences
between the increase rates with L-10% and L-100% light were small, when solar radiation gradually decreased or was stable during the incubation (Fig. 6, 7), although solar radiation increased on other experimental days (Fig. 6, 7). The initial DIN concentration was higher from July to September, although it differed widely (1.13-62.5 µM) depending on the observation day (Fig. 8). Similarly, PO4and Si(OH)4
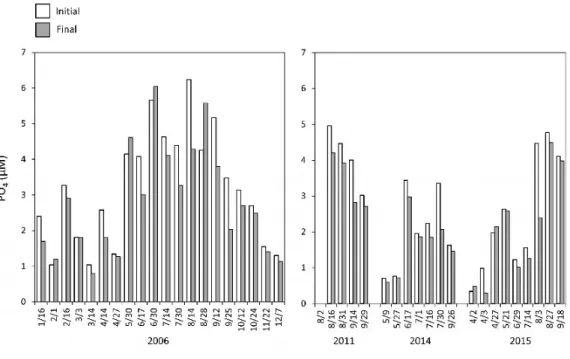
concentra-tions varied in the ranges 0.34-6.24 µM and 1.48-123 µM, respectively (Fig. 9, 10). Decreases in nutrient concentration during the incubation were common when Chl. a concentration in-creased substantially, such as in July to Septem-ber. The largest decrease in nutrient
concentra-tion in the bottle was observed in 14th August
2006. The concentrations of DIN, PO4, and Si
(OH)4decreased from 29.5 to 11.9 µM, 6.24 to 4.29
µM, and 82.3 to 80.7 µM, respectively (Fig. 8, 9, 10). Similarly, in 3rdAugust 2015, they decreased
from 18.4 to 0.70 µM, 4.47 to 2.40 µM, and 52.0 to 35.7 µM, respectively (Fig. 8, 9, 10).
3.3 Primary production rate
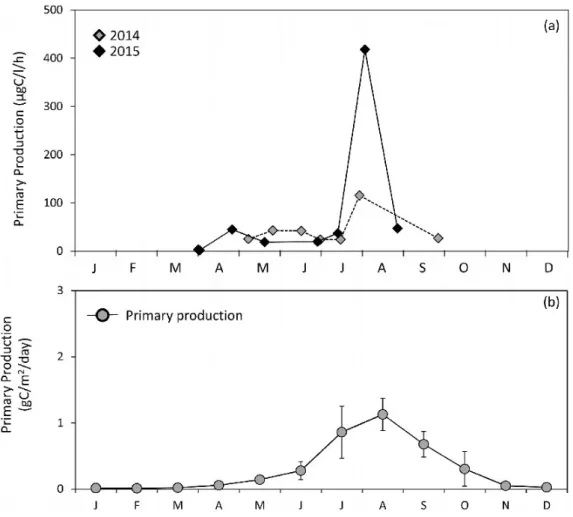
The primary production rate in L-100% measured in 2014 varied in the range of 24.0-43.0 µgC/l/h and was highest, 116 µgC/l/h, on 30 July (Fig. 11). In the experiment in 2015, the primary production rate was low, 3.50 and 1.96 µgC/l/h, on 2ndand 3rdApril, respectively. It increased in the
range of 18.7-47.5 µgC/l/h after 27thApril (Fig.
Fig. 6. Primary production (filled circles) and specific growth rate of Chl. a concentration (open
circles) at various PAR observed in 2015. The solid line shows the approximate curve of the primary production rate obtained from PLATTet al. (1980).
62 La mer 54, 2016
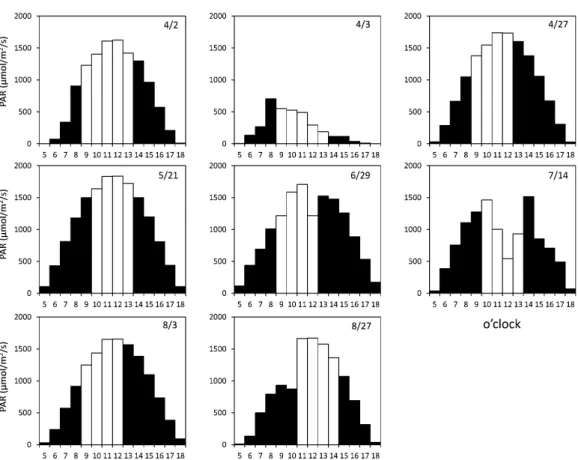
Fig. 7. Temporal variations in PAR by observation day. White shows the incubation period.
63
Seasonal variation of primary productivity in an estuary
Fig. 9. Initial and final concentrations of PO4in the incubation bottles.
64 La mer 54, 2016
11). An extremely high primary production rate, 418 µgC/l/h, was observed on 3rdAugust (Fig.
11).
Maximum primary production rates were observed with L-50% and/or L-100% (Fig. 6). Saturating light intensity for primary production (Ek) calculated in accordance with PLATT et al.
(1980) was < 100 µmol/m2/s on 3rd April and
150-700 µmol/m2/s on other observation days,
although the PI curve could not be determined on 2ndand 27thApril.
4. Discussion
4.1 Effect of nutrients, water temperature, and light intensity on the increase of Chl. a and primary production rate
N/P and N/Si ratios in the tested seawater samples were from 1.58 to 35.5 and 0.10 to 1.95, respectively, which was smaller than the Red-field ratio (N/P = 16, N/Si 1; REDFIELD, 1963; BREZEZINSKI, 1985) (Fig. 12). In general, primary production in coastal seas is limited by low DIN concentration (HOWARTH, 1988). The N/P and N/Si ratios in the present study were relatively low; therefore, it seems the growth of phytoplank-ton was potentially limited by DIN concentration.
65
Seasonal variation of primary productivity in an estuary
On the other hand, it was reported that the half saturation constant of DIN concentration for phytoplankton growth in estuaries was 0.1-5.9 µM (EPPLEYet al., 1969; PAASHE, 1973; CONWAY et al., 1976; CONWAY and HARRISON , 1977). The salinity of the tested seawater samples was often lower than 30, which means that Shinkawa river fresh water was present in the water samples. The river water contained high nutrient concen-trations (ICHIMI et al., 2011), thus, the DIN concentration of the tested seawater was mostly higher, 1.13-65.8 µM, than the half saturation concentration. On the other hand, the remaining DIN was only 0.70 µM on 3rdAugust 2015, when
the increase of Chl. a was very high (Fig. 6). Therefore, if phytoplankton growth is extremely high, the nutrient concentration for growth may be insufficient. Moreover, low DIN concentrations
were often observed in spring (Fig. 8). YAMAGUCHI et al. (2015) reported recently that low DIN concentrations (< 3 µM) have been observed in spring in the Bisan Strait, which is located near the study area. Thus, primary productivity may be limited temporarily by low nutrient concentrations in this season. It will be necessary to verify this and examine potential reasons as part of future studies.
Light intensity is also an important factor affecting primary productivity. The increase rate of Chl. a with L-10% was apparently higher than that with L-100% (Fig. 6, 7) when solar radiation increased during sample incubation. In contrast, differences in the increase rate between L-10% and L-100% were small when solar radiation decreased or was stable during sample incuba-tion (3rd April, 21th May, 14th July, and 27th
Fig. 12. Relationship to N/ P and N/ Si ratios calculated from the initial concentrations in the
66 La mer 54, 2016
August). When phytoplankton was exposed to 200-1,500 µmol/m2/s, the intracellular content of
Chl. a decrease to half to one-third of the level with 20-100 µmol/m2/s (STRAMASKIand MOREL,
1990; BENERAGAMA and GOTO, 2010; CHAUHANand PATHAK, 2010; CARNEIROet al., 2013). The decline in increase rate with L-100% was considered to occur because the intracellular Chl. a content of phytoplankton in the L-100% sample was re-duced in high light conditions. Most of the incubation experiments were carried out when solar radiation was increasing gradually (Fig. 7). Therefore, it was considered that the increase rate in Chl. a declined at low water temperatures. A decrease in intracellular Chl. a content could also occur at high water temperatures. However, significant higher increase rates in Chl. a were observed. The positive increase rate was caused by high growth at high light intensity. Primary production rates with L-100% were clearly higher than those with L-10%; therefore, the low increase rate of Chl. a with L-100% does not represent low photosynthetic activity.
The primary production rate was higher in high light intensity (Fig. 6). It is well known that EK, saturating light intensity for photosynthesis
(TALLING, 1957), rises with higher water tempera-ture. A similar trend was also observed in the present study (Fig. 6). EKat high water
tempera-ture was 200-600 µmol/m2/s (Tillman et al., 2000;
Shaw and Purdie, 2001; DOMINGUES et al., 2011; YAMAGUCHIet al., 2015). EKobserved in this study
(150-700 µmol/m2/s) was quite similar to
pre-vious reports. In general, the primary production rate in estuaries is usually limited by low light intensity, which is caused by high turbidity due to re-suspended sediment or suspended particles from rivers (CLOERN, 1987; COLE et al., 1992; IRIGOIEN and CASTEL, 1997). In this study area, however, about 60% of light at the sea surface reached the bottom even at high tide
(HIGASHIZONO et al., in preparation). In addition, the primary production rates of L-50% and L-100% were similar; therefore, the primary production rate in the intertidal area was not limited by low light. The intertidal area is exposed in full sunlight, and photosynthesis is sometimes influenced by photo-inhibition, which occurs in high light conditions such as 200-800 µmol/m2/s (STEEMAN-NIELSEN et al., 1962; BELAY
and FOGG, 1978). However, the primary produc-tion rates obtained in this study site were not reduced even at over 1,000 µmol/m2/s (Fig. 6).
Thus, it was considered that light intensity was a minor factor to explain primary production in this area throughout the year.
Both the increased rate of Chl. a and primary production rate showed a good correlation with water temperature (Fig. 5). It was reported that the primary production rates in various estuaries were high when the water temperatures were high (COLIJN and de JONGE, 1984; KROMKAMP and PEENE, 1995; MORTAZAVI et al., 2000). High Chl. a concentrations were also observed in summer in this study area (HIGASHIZONOet al., in preparation) , thus, water temperature may be a primary factor for phytoplankton growth and primary production rate in the Shinkawa River estuary.
In order to examine in detail how primary production rates obtained in this study were affected by any environmental factors, was performed multiple regression analysis (an indicator of Akaike information criteria of [AIC; AKAIKE, 1973]) with a dependent variable. As a result, water temperature and PAR were select-ed as independent variables for primary produc-tion (Primary producproduc-tion = 6.64×10⁻⁴×PAR +
1.99×10⁻¹×water temperature - 1.63, Adjusted
R2= 0.833, AIC = 371). Judging from the results
obtained in this study, primary production rate was considered to be limited in the order water temperature > light intensity > nutrients in the
67
Seasonal variation of primary productivity in an estuary Shinkawa River estuary.
In this study, however, primary production rates were not measured during autumn to winter when solar radiation was significantly reduced. Primary productivity in the season should be measured and discussed in the future. 4.2 Annual primary production rate and
chara-cteristics of the study area
The estimate from the model equation obtained from the AIC monthly primary production rate varied in the range 0.01±0.00 to 1.13±0.24 gC/ m2/day (Fig. 11). It was higher than 1 gC/m2/
day in August but lower than 0.10 gC/m2/day
during low temperature periods (Fig. 11). Estimated primary production rates showed a good correlation with water temperatures (Fig. 5). The annual primary production rate was calculated from monthly production rates as 125±10.7 gC/m2/year.
The primary production rate in this area varied in the range 0.83-47.5 µgC/l/h, except for > 100 µgC/l/h (Fig. 11). Monthly and annual primary production rates in this area varied in the range 0.01±0.00 to 1.13±0.24 gC/m2/day, equating to
110±11.8 gC/m2/year (Fig. 11). The primary
production rate in this study area was the same or somewhat higher compared with the primary production rate in the Seto Inland Sea, which varied in the range 0.41-32.1 µgC/l/h (Tada et al., 1998). Monthly and annual primary production rates in the Seto Inland Sea varied in the range 0.29-0.97 gC/m2/day, equating to 285 gC/m2/
year (TADAet al., 1998). Primary production rates in this study area were low in winter, about one-fifth, and higher in summer, 1.2-fold, compared with that in the Seto Inland Sea (TADA et al., 1998). This difference was considered to be due to the difference in water temperature, with the water temperature in the Seto Inland Sea about 10℃ in winter and about 25℃ in summer,
whereas, that in the present study area was lower than the 5℃ in winter and greater than 30℃ in summer (Fig. 2). Primary production rates in other brackish areas have been investigated. For example, previously reported rates have included 85 gC/m2/year in Tagus River estuaries in
Portugal (GAMEIROet al., 2011), 106 gC/m2/year
in the Douro River estuary (AZEVEDOet al., 2006), 153 gC/m2/year in the Scheldt River estuary in
the Netherlands (GAZEAUet al., 2005), 307 gC/m2/
year in the Delaware River estuary in the USA (PENNOCKand SHARP, 1986), and 467 gC/m2/year in the North River estuary (BOYERet al., 1993). The annual primary production rate (125 gC/m2/
year) in this study area was intermediate compared with these other estuaries. The results of the primary production rate was measured by the13C and 14C methods is known to be similar
(Hama et al., 1983). Therefore, it should be possi-ble to compare the primary production rates measured using these two methods. However, the primary production rate in the Shinkawa River estuary included subtidal to offshore areas and was presumed to be larger. Primary production rate in this study was measured at a station on the tidal flats, but the annual average Chl. a concentration at a station located offshore (water depth 6 m, 3.6 µg/l; HIGASHIZONOet al., in prepara-tion) from this study station did not change significantly compared with that at Stn. B (5.0 µg/l; HIGASHIZONO et al., in preparation). In addition, about 60% of the annual light total at the sea surface reached the bottom even at high tide at the present experimental station (HIGASHIZONO et al., in preparation). Thus, although it was presumed that the primary production rate across the entire Shinkawa River estuary may be higher than in this study alone.
Assimilation number (Ass. No.) represents photosynthetic activity variation over the range 1.10-16.2 µgC/µgChl. a/h, except for 3rdAugust
68 La mer 54, 2016
2015 when the primary production rate was extremely high. The reported previously, Ass. No. in other Seto Inland Sea areas varied in the ranges 0.45-11.6 µgC/µgChl. a/h in Osaka Bay (YAMAGUCHIand IMAI, 1996), 0.63-12.3 µgC/µgChl. a/h in Dokai Bay (TADA et al., 2001), 2-14 µgC/µgChl. a/h in Shitaba Bay, Uwa (YAMAGUCHI et al., 2011), 1.0-11.0 µgC/µgChl. a/h in Suo-Nada (YAMAGUCHIet al., 1984), and 2.5-15.0 µgC/µgChl. a/h in Hiroshima Bay (YAMAGUCHIet al., 1994). In addition, Ass. No. varied in the ranges 1.3-10.3 µgC/µgChl. a/h in Chesapeake Bay (FLEMER, 1970), 1.0-8.4 µgC/µgChl. a/h in the Tagus River estuary in Portugal (GAMEIROet al., 2011), 4.53-20.5 µgC/µgChl. a/h in the Guadiana estuary in Spain (DOMINGUES et al., 2011). Therefore, the photosynthetic activity in this study area was similar to that in other estuaries in Europe and America adjacent to large rivers, and to other Seto Inland Sea areas. Ass. No. is usually calculated using Chl. a concentration at the start of incubation. However, Ass. No. for the primary production rate was very high on 3rd August
2015, at 37.4 µgC/µgChl. a/h. On the other hand, Ass. No. calculated using Chl. a concentration at the end of incubation was 9.97 µgC/µgChl. a/h. This value was within the range of previous studies. This confirmed that phytoplankton communities in this study area had similar Ass. No. compared with in other areas. However, the growth rate, the increase in the rate of Chl. a, in phytoplankton communities that inhabit in this study area was significantly higher.
The primary production rate measured in 3rd
August 2015 (418 µgC/l/h) was approximately 2-fold higher than in Chesapeake Bay (202 µgC/l/h; FLEMER, 1970) and Dokai Bay (219 µgC/l/h; TADA et al., 2001) and higher than primary production rates recorded in marine waters previously. In addition, Chl. a concentra-tion, for which the primary production rate
measured > 200 µgC/l/h in Chesapeake Bay and Dokai Bay, was higher than about 30 µg/l (FLEMER, 1970) and 22.6 µg/l (TADAet al., 2001). Chl. a concentration previously showed a positive correlation with primary production rate (HAMA et al., 1997; TADAet al., 1998); therefore, this result was reasonable. In contrast, in this study, the initial Chl. a concentration associated with this high primary production rate of 418 µgC/l/h, was 11.2 µg/l (Fig. 11). In addition, the initial Chl. a concentration in the incubation bottle in 14th
August 2006, which had an estimated primary production rate of 197 µgC/l/h by equation (3), was 4.70 µg/l and not as high as the previous measurement. The sporadically extremely high primary production rate per unit volume at high water temperature (for example, 30thJuly 2014
and 3rdAugust 2015) was thought to be due to
small diatoms, which have very high growth rates of about 10 d-1in high temperature (30℃)
and light intensity (700 µmol/m2/s) culture
conditions, are known to inhabit this study area (ICHIMI et al., 2012). However, these very high primary production rates were not measures for all incidences of high temperature and light intensity. In the future, it will be necessary to consider the environmental conditions and timing of days with significantly higher primary produc-tion rates.
The annual primary production rate calculated from the monthly production rates was 125 gC/m2/year. On the other hand, the annual
primary production rate, 434 gC/m2/year, by
benthic microalgae was also measured using an oxygen method in this study area (MONTANIet al., 2003). Although the annual primary production rate in this benthic habitat was higher than that in the water column (this study), the production rates in August to October were the same (Fig. 13). Major primary producers in Shinkawa River estuary could be microphytobenthos; however,
69
Seasonal variation of primary productivity in an estuary
phytoplankton is also an important primary producer, especially in summer and autumn. Moreover, phytoplankton growing in the interti-dal zone can be easily flushed out into the coastal sea during each ebb tide. It will be necessary to verify how this flow of phytoplankton is utilized by higher trophic organisms and what effect it has on coastal environments.
5. Summary
In this study, seasonal variations in the increase rate of Chl. a and the primary production rate were measured by in situ seawater incubation in a small estuary in the Seto Inland Sea, Japan. As a result, nutrients levels were sufficient throughout the year and were not a limiting factor for primary production. Moreover, about 60% of annual light exposure at the sea surface reached the bottom even at high tide at the study site, thus saturation light intensity for photosynthesis
(100-700 µmol/m2/s) reached to the bottom
layer. Therefore, light intensity was also not a limiting factor for primary production. We concluded that water temperature was the major limiting factor for the primary production in this estuary. Primary production rate (mgC/m2/d) in
this study area was similar to other estuaries and coastal waters. The most significant feature related to productivity at this study site was the recording of extremely high production rates in seasons with high water temperature. It is necessary to verify how this high productivity contributes to secondary production and affects the coastal environment.
References
ADMIRAAL, W. (1977): Influence of light and tempera-ture on the growth rate of estuarine benthic diatoms in culture. Mar. Ecol. Plog. Ser., 39, 1-9. AKAIKE, H. (1973): Information theory as an extension
Fig. 13. Temporal variations in primary production of phytoplankton and microphytobenthos in the
70 La mer 54, 2016 of the maximum likelihood principle. B. N. Petrov,
and F. Csaki, (Eds.) Second International Sympo-sium on Information Theory. Akademiai Kiado, Budapest, 267-281.
AZEVEDO, I. C., P. M. DUARTEand A. A. BORDALO(2006): Pelagic metabolism of the Douro estuary (Portu-gal) e Factors controlling primary production. Est. Coast. Shelf Sci., 69, 133-146.
BARRANGUET, C., J. KROMKAMP and J. PEENE (1998): Factors controlling primary production rates from photosynthetic electron transport in estuar-ine microphytobenthos. Mar. Ecol. Prog. Ser., 173, 117-126.
BELAY, A., and G. E. FOGG(1978): Photoinhibition of photosynthesisin Asterionella formasa (Bacillar-iophyceae). J. Phycol., 14, 341-347.
BENERAGAMAC.K. and K. GOTO(2010): Chlorophyll a:b ratio increases under low-light in ‘Shade-tolerantʼ Euglena gracilis. Trop. Agri. Res., 22, 12-25. BOYER, J. N., R. R. CHRISTIANand D. W. STANLEY(1993):
Patterns of phytoplankton primary productivity in the Neuse River estuary, North Carolina, USA. Mar. Ecol. Prog. Ser., 97, 287-297.
BOYNTON, W. R., W. M. KEMPand C. W. KEEFE(1982): A comparative analysis of nutrients and other factors influencing estuarine phytoplankton pro-duction, in: Estuarine Comparisons, edited by: Kennedy, V. S., Academic Press, New York. BREZEZINSKI, M. A. (1985): The Si:C:N ratio of marine
diatoms : interspecific variability and the effect of some environmental variables. J. Phycol., 21, 347-357.
CARNEIROR.L., A.P.R. da SILVA, V.F. de MAGALHAESLand S.M.F de OLIVEIRAe AZEVEDO(2013): Use of the cell quota and chlorophyll content for normaliza-tion of cylindropermops in produced by two Cylindrospermopsis raciborskii strains grown under different light intensities. Ecotoxicol. Environ. Contam., 8, 93-100.
CHAUHAN, U.K. and N. PATHAK (2010): Effect of different conditions on the production of chloro-phyll by Spirulina platensis. J. Algal Biomass Utln. 1, 89-99.
CLOERN, J. E. (1987): Turbidity as a control on phyto-plankton biomass and productivity in estuaries.
Cont. Shelf Res., 7, 1367-1381.
CLOERN, J. E., S. Q. FOSTERand A. E. KLECKNER(2014): Phytoplankton primary production in the worldʼs estuarine - coastal ecosystems. Biogeosciences,
11, 2477-2501.
COLE, J. J., N. F. CARACOand B. L. PEIERLS(1992): Can phytoplankton maintain a positive carbon bal-ance in a turbid, freshwater, tidal estuary? Limnol. Oceanogr., 37, 1608-1617.
COLIJN, F. and K. S. DIJKEMA(1981): Species composi-tion of because benthic diatoms and distribucomposi-tion of chlorophyll a on an intertidal flat in the Dutch Wadden Sea. Mar. Ecol. Prog. Ser., 4, 9-21. COLIJN, F. and V. N. de JONGE (1984): Primary
production of microphytobenthos in the Ems-Dollard Estuary. Mar. Ecol. Plog. Ser., 14, 185-196. CONWAY, H. J. and P. J. HARRISON (1977): Marine diatoms grown in chemostats under silicate or ammonium limitation. Ⅳ . Transient response of Chaetoceros debilis, Skeletonema costatum and Thalassiosira gravida to a single addition of the limiting nutrient. Mar. Biol., 43, 33-43.
CONWAY, H. J., P. J. HARRISONand C. O. DAVIS(1976): Marine diatoms grown in chemostats under silicate or ammonium limitation. Ⅱ . Transient response of Skeletonema costatum to a single addition of the limiting nutrient. Mar. Biol., 35, 187-199.
DOMINGUES, R. B., T. P. ANSELMO, A. B. BARBOSA, U. SOMMER and H. M. GALVãO (2011): Light as a driver of phytoplankton growth and production in the freshwater tidal zone of a turbid estuary. Est. Coast. Shelf Sci., 91, 526-535.
EPPLEY, R. W., J. N. ROGERS, and J. J. MCCARTHY(1969): Halfsaturation constants for uptake of nitrateand ammonium by marine phytoplankton. Limnol. Oceanogr., 14, 912-920.
FLEMER, D. A. (1970): Primary Production in the Chesapeake Bay. Chesapeake Sci., 11, 117-129. GAMEIRO, C., J. ZWOLINSKIand V. BROTAS(2011): Light
control on phytoplankton production in a shallow and turbid estuarine system. Hydrobiologia, 669, 249-263.
GAZEAU, F., J. P. GATTUSO, J. MIDDELBURG, N. BRION, L. S. SCHIETTECATTE, M. FRANKIGNOULLEand A. BORGES
71
Seasonal variation of primary productivity in an estuary
(2005): Planktonic and whole system metabolism in a nutrient-rich estuary (the Scheldt estuary). Est. Coasts, 28, 868-883.
HAMA, T., T. MIYAZAKI, Y. OGAWA, T. IWAKUMA, M. TAKAHASHI, A. OTSUKI and S. ICHIMURA (1983): Measurement of photosynthetic production of marine phytoplankton population by using a stable13C isotope. Mar. Biol., 73, 31-36.
HAMA, T., K. H. SHIN and N. HANDA (1997): Spatial variability in the primary productivity in the East China Sea and its adjacent waters. J. Oceanogr., 53, 41-51.
HOLM-HANSEN, O, C. J. LORENZEN, R. W. HOLMESand J. D. H. STRICKLAND (1965): Fluorometric determina-tion of Chlorophyll. J. Conc. Perm. Int. Explor. Mar., 30, 3-15.
HOWARTH, R. W. (1988). Nutrient limitation of net primary production in marine ecosystem. Annual Review of Ecology & Systematics, 19, 89-110. ICHIMI, K., H. SUMIMOTO, H. NAKAYAMAand K. TADA
(2011): Effect of nutritional level on the standing stock and biodiversity of macrobenthos in tidal flat ecosystems and human fishing pressure on the standing stock of short - neck clam. Bull. Coast. Oceanogr., 48, 109-116 (in Japanese with English abstract).
ICHIMI, K., T. KAWAMURA, A. YAMAMOTO, K. TADAand P. J. Harison(2012): Extremely high growth rate of the small diatom Chaetoceros salsugineum isolat-ed from an estuary in the eastern Seto Inland Sea, Japan. J. Phycol. 47, 1284-1288.
IRIGOIEN, X. and J. CASTEL(1997): Light limitation and distribution of chlorophyll pigments in a highly turbid estuary: the Gironde (SW France). Est. Coast. Shelf Sci., 44, 507-517.
JOINT , I. R. (1978). Microbial production of an estuarine mudflat. Est. Coast. Mar. Sci., 21, 283-287.
KROMKAMP, J. and J. PEENE (1995): Possibility of net phytoplankton primary production in the turbid Schelde Estuary (SW Netherlands). Mar. Ecol. Prog. Ser., 121, 249-259.
MONTANI, S., P. MAGNIand N. ABE(2003): Seasonal and interannual patterns of intertidal microphytoben-thos in combination with laboratory and areal
production estimates. Mar. Ecol. Prog. Ser., 249, 79-91.
MORTAZAVILL, B., R. L. IVERSON, W. M. LANDING, F. G. LEWIS and W. HUANG (2000): Control of phyto-plankton production and biomass in a river-dominated estuary: Apalachicola Bay, Florida, USA. Mar. Ecol. Prog. Ser., 198, 19-31.
PAASHE, E. (1973): Silicon and the ecology of marine plankton diatoms. II. Silicate - uptake kinetics in five diatom species. Mar. Biol., 19, 262-269. PENNOCK, J. R. and J. H. SHARP(1986): Phytoplankton
production in the Delaware Estuary: temporal and spatial variability. Mar. Ecol. Prog. Ser., 34, 143-155.
PLATT, T., C. L. GALLEGOSand W. G. HARRISON(1980): Photoinhibition of photosynthesis in natural assemblages of marine phytoplankton. J. Mar. Res., 38, 687-701.
REDFIELD, A. C., B. H. KETCHUMand F. A. RICHARDS (1963): The influence of organisms on the composition of seawater. The Sea, 2, 26-77pp. SHAW, P. J. and D. A. PURDIE (2001): Phytoplankton
photosynthesis-irradiance parameters in the near-shore UK coastal waters of the North Sea: temporal variation and environmental control. Mar. Ecol. Prog. Ser., 216, 83-94.
STEEMAN-NIELSEN, E., V. K. HANSENand E. G. JORGENSEN (1962): The adaptation to different light intensi-ties in Chlorella vulgaris and the time depend-ence on transfer to a new light intensity. Physiol. Plant., 15, 505-517.
STRAMASKI, D. and A. MOREL(1990): Optical properties of photosynthetic picoplankton in different phys-iological states as affected by growth irradiance. Deep Sea Res. I, 37, 245-266.
STRICKLAND, J. D. H. and T. R. PARSONS (1968): A practical handbook of seawater analysis. Bull. Fish. Res. Bd. Canada., 167, 311 pp.
TADA, K., K. MONAKA, M. MORISHITAand T. HASHIMOTO (1998): Standing stocks and production rates of phytoplankton and abundance of bacteria in the Seto Inland Sea, Japan. J. Oceanogr., 54, 285-295. TADA, K., M. MORISHITA, K. HAMADA, S. MONTANIand M. YAMADA(2001): Standing stock and production rate of phytoplankton and a red tide outbreak in
72 La mer 54, 2016 a heavily eutrophic embayment, Dokai Bay,
Japan. Mar. Poll. Bull., 42, 1177-1186.
TALLING, J.F. (1957): The phytoplankton population as a compound photosynthetic system. New Phytol.
56, 133-149.
TILLMAN, U., K. J. HESSE and F. COLIJN (2000): Planktonic primary production in the German Wadden Sea. J. Plank. Res., 22, 1253-1276. YAMAGUCHI M. and I. IMAI (1996): Size fractionated
phytoplankton biomass and primary productivi-ty in Osaka Bay, eastern Seto Inland Sea, Japan. Bull. Nansei Natl. Fish. Res. Inst., 29, 59-73. YAMAGUCHI, M., I. IMAIand Y. MATSUO(1994): Seasonal
changes in biomass and photosynthetic rate of phytoplankton in Hiroshima Bay. Bull. Nansei Reg. Fish. Res. Inst., 28, 63-72. (in Japanese) YAMAGUCHI, M. and M. ANRAKU (1984): Primary
productivity in Suo-Nada, Western Seto Inland Sea. Bull. Nansei Reg. Fish. Res. Lab., 17, 135-149. (in Japanese)
YAMAGUCHI, H., N. HIRADE, K. HIGASHIZONO, K. TADA, K. KISHIMOTO, K. OYAMAand K. ICHIMI(2015): Light and nutrient limitation on phytoplankton produc-tion in the strait of an enclosed coastal sea (Bisan Strait, eastern Seto Inland Sea, Japan). J. Sea Res., 103, 75-83.
YAMASHITA, A., K. ISEKI, K. TARUTANIand Y. KOIZUMI (2011): Seasonal Variation of Primary Productivi-ty in Shitaba Bay of Uwa Sea, Japan. Bull. Jpn. Soc. Fish. Oceanogr., 75, 9-18. (in Japanese)
Received: January 2, 2016 Accepted: July 19, 2016