鳥取大学研究成果リポジトリ
Tottori University research result repository
タイトルTitle Effects of substituting alfalfa hay for concentrateon energy utilization and feeding cost of crossbred Simmental male calves in Gansu Province, China 著者
Auther(s) Kobayashi, Nobuyuki; Hou, Fujiang; Tsunekawa, Atsushi;Chen, Xianjiang; Yan, Tianhai; Ichinohe, Toshiyoshi 掲載誌・巻号・ページ
Citation Grassland science , 63 (4) : 245 - 254
刊行日
Issue Date 2017-08-01
資源タイプ
Resource Type 学術雑誌論文 / Journal Article
版区分
Resource Version 著者版 / Author
権利
Rights © 2017 Japanese Society of Grassland Science
DOI 10.1111/grs.12169
Short running title: Energy use of Chinese alfalfa by calf
1
2
Effects of substituting alfalfa hay for concentrate on energy utilization and feeding cost of
3
crossbred Simmental male calves in Gansu Province, China
4
5
Nobuyuki Kobayashi1, 2, Fujiang Hou3, Atsushi Tsunekawa2, Xianjiang Chen3, Tianhai Yan4
6
and Toshiyoshi Ichinohe5
7
8
9
1 The United Graduate School of Agricultural Sciences, Tottori University, Tottori, Japan
10
2 Arid Land Research Center, Tottori University, Tottori, Japan
11
3 College of Pastoral Agriculture Science and Technology, Lanzhou University, Lanzhou,
12
China
13
4 Agri-Food and Biosciences Institute, Belfast, Northern Ireland, UK
14
5 Faculty of Life and Environmental Science, Shimane University, Matsue, Japan
15 16 17 18 19 20 Correspondence 21
Toshiyoshi Ichinohe, Faculty of Life and Environmental Science, Shimane University,
22
Matsue 690-8504, Japan.
23
Email: [email protected]
Abstract
1
2
From August to September 2015 (trial 1 (T1)) and September to November 2015 (trial 2
3
(T2)), the effects of replacing concentrate feed (C) with alfalfa hay (AH) on the daily gain
4
(DG), dietary energy utilization status and the economic advantage of AH feeding for
5
growing beef cattle were studied in crossbred male Simmental calves (n = 18) in Gansu
6
Province, China. The target DG was set as 1 kg for the both trials. Animals in each trial
7
were allocated to a conventional feeding group (CTRL), a low-level AH feeding group
8
(LA), and a high-level AH feeding group (HA). In a one-way-layout design, they were fed
9
iso-energetic experimental diets comprising harvested corn stover (CS) and C (T1-CTRL,
10
T2-CTRL), diets replacing 22% (T1-LA) or 44% (T1-HA) of the quantity of C for
11
T1-CTRL with AH, and diets replacing 13% (T2-LA) or 25% (T2-HA) of the quantity of C
12
for T2-CTRL with AH. Measurements of feed intake and DG, respiration and metabolism
13
trials were performed for 49 and 41 days in T1 and T2, respectively. Average DG did not
14
reach the target value for HA in T1 and CTRL in T2. Energy metabolizability was slightly
15
greater for CTRL than for LA and HA in T1 and significantly greater for CTRL than for the
16
other groups in T2. There was no marked difference in energy metabolizability between LA
17
and HA in the both trials. Dietary substituting AH for C did not impair the feed intake of the
18
animals, but it did not improve feed efficiency. In terms of economic feasibility, low-level
19
AH inclusion in the diets of growing beef cattle appeared more profitable at the 1-kg DG
20
level as compared with CTRL and high-level AH inclusion, and should be practiced in the
21
drylands of Gansu Province, China.
22
23
Keywords
Alfalfa hay; beef cattle; China; dryland; energy metabolism.
1
Introduction
1
2
The rates of beef cattle production and beef consumption are increasing rapidly in China
3
(FAO 2015) because of the dramatic shift in dietary preferences that have coincided with
4
the rapid economic growth and the improvement of living standards. The increase in animal
5
feed demand has resulted in yearly increases in the quantities of imported concentrate feed
6
ingredients and forages in China (MAFF 2013).
7
Gansu Province is one of the major beef cattle production areas of China (National
8
Bureau of Statistics of China 2014) and is being prioritized as a beef production area by the
9
Chinese Government (Chinese State Committee for Development and Reform 2013). In
10
many provinces in China, including Gansu Province, livestock grazing has been restrained
11
to prevent the desertification of natural pastures in accordance with the directive “restore
12
agricultural land to forest and pasture” which had issued in 2003 (Han et al. 2008).
13
Therefore, foraging systems for confined beef cattle with both maximum utilization of
14
roughage produced on farm and high-level production performance are needed to be
15
established in Gansu Province. The effect of stall-feeding regimens conventionally used in
16
Gansu Province should be evaluated to develop beef cattle production models based on
17
harvested roughage diets in the huge dryland area of western China. Moreover, feeding
18
studies based on locally available feeds would help to upgrade the current Chinese Feeding
19
Standard for Beef Cattle (CFSBC) (Ministry of Agriculture of the People’s Republic of
20
China 2004).
21
Rong et al. (2004) reported that alfalfa has high drought tolerance, and there is strong
22
potential to increase the area under alfalfa cultivation because of its high feeding values and
23
economic return to farmers (Guo et al. 2007). In Huanxian County in Gansu Province, the
area under alfalfa cultivation has expanded and it accounted for 28% of all irrigated
1
farmland in the Yellow River Basin of Gansu Province in 2006 (Hou et al. 2008). Since
2
alfalfa grown in Gansu Province can be considered as a self-sufficient substitute for
3
expensive commercial concentrates, utilization of the local alfalfa might reduce the beef
4
cattle feeding cost in Gansu Province.
5
Simmental crossbred is the major types of beef cattle kept by farmers in Gansu
6
Province. Currently, there is an absence of data from both in vivo and in situ studies on the
7
energy utilization status of conventional beef cattle diets in Gansu Province and the effects
8
of alfalfa hay (AH) feeding on energy metabolizability. Hence, by performing two seasonal
9
feeding trials (in the warm and cool seasons) and energy balance trials, we aimed to
10
evaluate the effect of AH feeding level on the body weight (BW) gain, efficiency of dietary
11
energy utilization, and feeding cost of growing Simmental cattle in Gansu Province, China.
12
13
Materials and methods
14
15
Study site
16
The experiment was conducted at the Linze Research Station of the College of Pastoral
17
Agriculture Science and Technology, Lanzhou University, located in Linze County, Gansu
18
Province, China (Figure 1). The research station is located at latitude 39.24°N and
19
longitude 100.06°E, and its elevation is 1390 m above sea level (Zhu et al. 1997). The total
20
precipitation in 2013 was 89 mm, all of which fell from May to September. The annual
21
average temperature in the same year was 8.3 °C. The average temperature in the warm
22
season (from August to September) and the cool season (from September to November) in
23
2013 was 18.1 and 7.7 °C, respectively (data supplied from the Linze Research Station).
The study site is categorized as a typical arid zone (United Nations Environment
1
Programme 1997).
2
3
Cattle, diets, and feeding management
4
Two feeding trials were conducted, from 6 August to 16 September 2015 (trial 1 (T1) in the
5
warm season) and from 24 September to 27 October 2015 (trial 2 (T2) in the cool season),
6
with the aim of achieving a 1-kg daily gain (DG). Eighteen male crossbred Simmental
7
calves with a mean body weight (BW) of 175.8±23.8 kg (7 months of age) and with a mean
8
BW of 218.8±27.4 kg (8 months of age) were purchased from a local calf market and used
9
for T1 and T2, respectively. We have conducted an interview to beef cattle farmers on their
10
feeding management, and concluded that the amount of concentrate feeding were markedly
11
higher in the cool season than in the warm season in Gansu province. In designing
12
experimental feeding regimens, we considered the conventional feeding practices of beef
13
cattle farmers in Gansu Province.
14
Based on the initial BW, the 18 calves in each trial were allocated to one of the
15
following three dietary treatments, namely a conventional feeding group (control (CTRL),
16
n = 6), a low-level AH feeding group (LA, n = 6) and a high-level AH feeding group (HA,
17
n = 6). In the CTRL groups of T1 and T2 (T1-CTRL, T2-CTRL), allocated calves were
18
offered corn stover (CS) as a sole forage diet together with concentrate feed (C). The diet
19
fed to the CTRL group in T1 and T2 was designed in reference to the conventional diets
20
used by beef cattle farmers in Gansu Province. The calves in the LA group were offered CS
21
with a low level of AH and C; those in HA group were offered CS with a high level of AH
22
and C. The experimental diet in each treatment was designed to suffice metabolizable
23
energy (ME) and metabolizable protein requirements for a 1-kg DG of a bull calf on the
basis of the estimation equation of the AFRC (1993) and the tabular values listed in the
1
CFSBC (2004) using weekly measured BW of the calves. Tabular values listed in the
2
Standard Tables of Feed Composition in Japan (2009) (NARO 2010) were used when
3
convert the digestible energy values of CS, AH and feed ingredients of C listed in CFSBC
4
(2004) into the ME concentration. Assured nutritive values of commercial concentrate
5
comprising C was also used to calculate the ME concentration of C. Since the ME
6
requirement for 1-kg DG of kg–0.75 BW of calf was considered to be greater for T2 than that
7
for T1 (CFSBC 2004), concentrate-based experimental diets were designed in T2 to suffice
8
the ME requirement by taking account of the estimated DM intake (DMI) calculated by the
9
equation of AFRC (1993). In T1-LA, 22% (on a dry matter (DM) weight basis) of the daily
10
allowance of C in T1-CTRL was replaced with AH; in T1-HA, 44% of the daily C in
11
T1-CTRL was replaced with AH. In T2-LA, 13% of the daily C in T2-CTRL was replaced
12
with AH; and in T2-HA, 25% of the daily C in T2-CTRL was replaced with AH.
13
The CS and AH used in T1 and T2 were produced at the Linze Research Station of the
14
College of Pastoral Agriculture Science and Technology. The CS used in the both trials was
15
harvested in September 2014. The AH used in this experiment was harvested in May 2015
16
(first-cut hay, harvested before the bloom stage of growth in 2015) for T1, and in July
17
(second-cut hay) and September (third-cut hay) 2015 for T2. The AH used for T1 and T2
18
was coarsely chopped, mixed and stored for use as the experimental feed. The C consisted
19
of commercial concentrate (31%), wheat bran (10%) and corn grain (59%). The corn grain
20
was produced at the Linze Research Station in September 2014. Throughout the feeding
21
trials, the calves were housed in individual pens and had free access to fresh water and
22
mineral blocks. Coarsely chopped CS and AH (5- to 10-cm lengths) and C were offered via
23
a separate trough for each animal as separate meals each day. The chopped roughage was
offered twice a day (07.30 and 19.30 hours), and C was offered once a day at 14.30 hour.
1
2
Measurements and sample collection
3
In both T1 and T2, the amount of feed offered and the orts were weighed and recorded daily
4
throughout the experimental period to calculate daily feed intake. Representative samples
5
of CS, AH, and C were collected several times during the feeding study and composited for
6
analyses of their chemical composition. The calves were weighed at the beginning and the
7
end of the feeding study, as well as weekly. On the basis of the BW of the animals, the feed
8
provision level for each animal allocated to the CTRL, LA, and HA groups was calculated
9
weekly.
10
At the conclusion of the feeding trials, respiratory measurements were conducted for 2
11
days, following 5-days adaptation, at the Linze research station for 15 calves in T1 and 12
12
calves in T2 (selected from the three dietary groups, i.e. five calves in T1 and four calves in
13
T2 per group) by using ventilated open-circuit respiration chambers. Oxigen consumption
14
and CO2 and CH4 production were measured by both infrared absorption based gas 15
analyzer (CO2 and CH4) and paramagnetic-based O2 gas analyzer (VA-3000, Horiba Ltd., 16
Kyoto, Japan). Daily heat production (HP) by each animal was calculated by using the
17
equation of Brower (1965). The ME for maintenance (MEm) of male calves was estimated
18
by using a linear regression equation between net energy (NE) intake (obtained by
19
subtracting HP from ME intake (MEI)) and MEI, with both expressed on the basis of
20
metabolic body size (kg0.75 BW), as presented by Freetly et al. (2006). During the 21
respiration trial, experimental diets were offered to the animals on the same schedule as in
22
the feeding trials. During a 5-days period of adaptation of the animals to the respiration
23
chamber and 2 days of respiratory measurement, total urine collection and spot feces
collection were conducted to determine the daily urinary and fecal gross energy (GE)
1
excretion of calves allocated to the CTRL, LA and HA groups. Excreted urine was
2
collected into a container containing 50 mL of 10% (v/v) H2SO4 to keep urine pH below 3. 3
Urine samples (about 100 mL) were taken from each animal and stored at –15°C for
4
further analysis. Daily fecal excretion was estimated by using acid detergent lignin (ADL)
5
as an internal marker to determine digestibility.
6
7
Chemical analysis
8
Collected feed and fecal samples were dried at 60°C in a forced-air oven. The dried
9
samples were ground and sieved to pass through a 1-mm screen. The concentrations of GE,
10
DM, crude protein (CP), ash-free neutral detergent fiber (NDFom) and ADL in the dried
11
feed samples and fecal samples were determined. Urine samples were determined for GE
12
concentrations. The concentrations of DM and CP were determined by using the method of
13
the Association of Official Analytical Chemists (AOAC 1984). The concentrations of
14
NDFom and ADL were determined by the procedure of Van Soest et al. (1991). The GE
15
concentration of the samples was determined with a bomb calorimeter (CA-4AJ, Shimadzu
16
Corp., Kyoto, Japan). Urine samples were freeze-dried for 48 hours in a freeze dryer
17
(VD550R, Taitec Corp., Koshigaya, Japan), and the GE concentration was determined with
18
the bomb calorimeter (CA-4AJ, Shimadzu Corp.).
19
20
Economic analysis
21
To examine the effect of substituting AH for C in terms of economic feasibility, the
22
differences in feeding cost among the dietary treatment groups were calculated in both T1
23
and T2. Feed cost was calculated as the sum of expenses for purchase of alfalfa hay and
commercial concentrate by using their market price (1.7 yuan kg–1 for alfalfa hay, 2.9 yuan
1
kg–1 for concentrate) and the daily intake of AH and C for each cattle obtained in T1 and T2.
2
In addition, the economic benefit of the calves’ DG was estimated by subtracting the feed
3
cost from the expected income (profit) from DG calculated with the market price of calves
4
(22 yuan kg–1 BW). The estimates were converted at the rate of 1 US$ = 6.36 yuan (based
5
on the averages between 6 August and 1 November 2015).
6
7
Statistical analysis
8
Differences in means among the three groups in each trial were tested by using one-way
9
ANOVA and Tukey’s test. Possible seasonal differences in the efficiency of energy
10
utilization were not considered because of the difference in feeding regimen in T1 and T2.
11
All statistical analyses were performed with statistical software R (Version 3.1.1, The R
12
Foundation for Statistical Computing, Vienna, Austria). Dietary effect was considered
13
significant at P ≤ 0.05.
14
15
Results and discussion
16
17
Chemical composition of diet
18
The GE concentration and chemical composition of CS did not differ between T1 and T2
19
(Table 1). Minson (1980) reported that at least a CP concentration of 8% (on a DM basis) is
20
needed if forage is given as a sole diet to ruminants. The concentrations of CP in CS ranged
21
from approximately 4 to 5% on a DM basis and that of NDFom was about 70% of DM,
22
indicating that CS could not be used as the basal diet for beef cattle to achieve high levels
23
of production; thus a concentrate or a leguminous forage supplement should be needed to
achieve 1-kg DG in crossbred Simmental male calves when fed CS as the basal forage.
1
Reflecting the differences in harvesting stage of alfalfa, the concentrations of CP, NDFom
2
and ADL of AH differed slightly between T1 and T2. The CP concentrations of AH in T1
3
and T2 (15.8 and 12.0% on a DM basis, respectively) were lower than the tabular values
4
listed by NARO (2010) (ranging from 19.1 to 21.8% on a DM basis) but were close to the
5
value listed in CFSBC (2004) (13.1% on a DM basis). Our finding, the CP concentrations
6
of AH in the both trials were close to that of C, suggests that it may be possible to replace C
7
with AH to provide CP in CS based diet feeding for beef calves. The NDFom and ADL
8
concentrations of the second- and third-cut AH in T2 were slightly higher than those of the
9
first-cut AH in T1. The NDFom concentrations in AH harvested before the bloom stage
10
were shown to vary from 36.0 to 39.3% on a DM basis (NARO 2010), the higher NDFom
11
concentrations of AH that we obtained might have been caused by unavoidable
12
contamination at harvest with other poaceous forage crops grown at the research station.
13
The difference in the NDFom of C between T1 and T2 might be likely a result of variations
14
in the nutrients concentration of the wheat bran and corn grain added to the commercial
15
concentrate.
16
The daily feed allowance for calves at the start of T1 and T2 are shown in Table 2. As
17
described above, the feed allowance for each animal was calculated weekly on the basis of
18
the BW with keeping the feed proportion of the feeding treatments in each trial. The values
19
shown in Table 2 were those fed at 175.8 kg and 218.8 kg BW in T1 and T2, respectively.
20
The estimated CP concentration of the diets fed to the calves ranged from 8.9 to 9.7% on a
21
DM basis in T1 and from 11.7 to 11.9% on a DM basis in T2 (Table 2). The estimated
22
NDFom concentration of the diets ranged from 45.1 to 52.5% on a DM basis in T1 and
23
from 29.1 to 37.5% on a DM basis in T2. The estimated NDFom concentration tended to
increase as AH feeding level increased. In contrast, the variation in estimated CP
1
concentration among the feeding groups in each of T1 and T2 was less than that of the
2
estimated NDFom concentration. The ADL concentrations were more than 2% on a DM
3
basis for all of the diets, and were sufficiently high eligible to use as an internal marker to
4
estimate fecal DM excretion (Munitifering 1982).
5
6
Feed intake, metabolizable energy intake, daily gain, feed efficiency, and digestibility
7
The average feed intakes of the calves over the 1-month period of each feeding trial are
8
summarized for each feeding group in Table 3. Feed refusal of C was observed for the
9
CTRL group in both T1 and T2. The refusal of forage (CS and AH) for T2-HA (0.13 kg
10
DM day–1)appeared to be greater than that for T2-CTRL (0.03 kg DM day–1) and T2-LA
11
(0.07 kg DM day–1). There were no significant differences in total DMI, expressed as kg
12
day–1 and % BW, among the T1 feeding groups. The NDFom concentration of daily 13
ingested feed (on a DM basis) for T1-CTRL, T1-LA and T1-HA was calculated as 39.9,
14
44.3 and 49.5%, respectively, and it appeared to increase with increasing AH feeding level.
15
Forage fiber concentration clearly affects voluntary feed intake through the physical
16
regulation caused by the rumen fill (Ichinohe et al. 1994). In contrast, Hales et al. (2014)
17
has reported no difference in DMI when alfalfa hay is substituted at various mixing ratios
18
for concentrate-based diets. Our results in T1 also revealed that dietary substitution with
19
AH, regardless of the consequent increase in NDFom intake, did not reduce the total DMI.
20
In T2, however, total DMI (kg day–1 and % BW) differed significantly (P < 0.05) among 21
the three feeding groups; that for T2-CTRL had the lowest value, and the total DMI for
22
T2-HA was significantly greater (P < 0.05) than that for T2-LA. The NDFom concentration
23
of the ingested feed (on a DM basis) for T2-CTRL, T2-LA and T2-HA was calculated to be
33.3, 37.5 and 40.7%, respectively. As observed in T1, they increased with increasing AH
1
feeding level. Opposite to the result observed in T1, the increase of NDFom intake with
2
increasing AH feeding level resulted in the significant increase in total DMI in T2. Our
3
results for total DMI in T2 supported the findings of a study of growing ruminants by
4
Defoor et al. (2002), in which they suggested that growing heifers ate more with increasing
5
NDFom concentration of the diet to compensate for the reduction in dietary energy intake.
6
Furthermore, the result of feed intake in T2 appeared to indicate that differences in the
7
dietary forage to concentrate ratio affected feed intake as suggested by McCarthy et al.
8
(1989), Krause et al. (2002) and Oba and Allen (2003). Kennedy and Murphy (1988)
9
reviewed digesta particle outflow from the rumen, and summarized that additionally to the
10
physiological rumen fill caused by forage feeding, the cold temperature also enhanced
11
rumen digesta outflow rate. Hence, it was thought that both of cold temperature in October
12
2015 at Linze research station and differences in the ruminal NDFom contents caused by
13
the differed NDFom intake might have resulted in the significant differences in total DMI
14
among the treatments in T2. Our results suggested that a dietary AH allowance up to 50%
15
of C in warm season to 80% of C in cool season (Table 3) did not have any detrimental
16
effects on feed intake in the both trials.
17
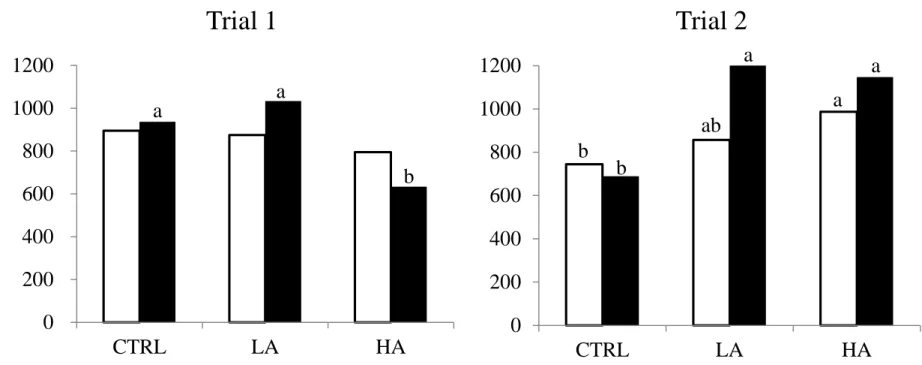
We calculated the average daily MEI and DG of the calves (Figure 2). The MEI did not
18
differ significantly among the feeding groups in T1, although T1-HA group showed slightly
19
lower value than the other feeding groups (P > 0.05). In contrast, the MEI was significantly
20
higher (P < 0.05) for T2-HA than for T2-CTRL, and it did not differ between T2-LA and
21
T2-HA. Over the 1-month feeding period, the values of MEI expressed as a percentage of
22
the ME required for 1-kg DG in male calves were calculated as the following: 97% for
23
T1-CTRL, 90% for T1-LA, 78% for T1-HA, 98% for T2-CTRL, 108% for T2-LA and
119% for T2-HA. No significant difference in MEI between T2-CTRL and T2-LA or
1
between T2-LA and T2-HA was detected (P > 0.05; Figure 2). The average DG values (kg
2
day–1) throughout the observation period were calculated for T1-CTRL, 0.9; T1-LA, 1.0; 3
T1-HA, 0.6; T2-CTRL, 0.7; T2-LA, 1.2 and T2-HA, 1.2. The lower average DG for T1-HA
4
than those for the other groups in T1 (P < 0.05) might be caused by the numerically lower
5
MEI for T1-HA. The value of average DG for T2-CTRL was significantly lower (P < 0.05)
6
than those for the other groups in T2, whereas those for T2-LA and T2-HA did not differ
7
significantly (P > 0.05). The average DG achieved the target growth performance for
8
T2-LA and T2-HA in T2 as designed. Hales et al. (2014) reported that the retained energy
9
(RE) for BW gain in finishing beef cattle decreased as dietary concentration of AH
10
increased. The numerically lower MEI for T1-HA than for T1-CTRL and T1-LA might
11
have reduced the RE in T1-HA as compared with those in the other two groups, and thus
12
resulted in the significantly lower DG value (P < 0.05). However, the lack of DG difference
13
between T1-CTRL and T1-LA indicated that the AH feeding level in T1-LA treatment did
14
not cause the RE depression that might have been thought to be occurred in the T1-HA
15
group. The lower DG value observed in T2-CTRL as compared with those in the other two
16
groups in T2 may have been attributable to the lower intake of C in T2-CTRL. As indicated
17
in Table 2 and Table 3, daily consumption of C accounted for 65% of allowance (4.8 kg
18
DM day–1) in T2-CTRL group. Since T2-CTRL treatment was not able to suffice the ME
19
requirement to achieve the target 1-kg DG, concentrate allowance of T2-CTRL appeared to
20
be too much when fed CS based diet to growing calf in the cool season in Gansu Province.
21
Our results for average MEI and DG suggested that AH provision at the LA-group in both
22
T1 and T2 had no negative effect on energy retention for BW gain of growing male calves.
23
The trend of the average feed conversion ratio (FCR) among the three feeding groups
differed between T1 and T2 (Table 3). The value of FCR for T1-CTRL and T1-LA did not
1
differ from each other but was significantly higher (P < 0.05) than that for T1-HA. The
2
FCR values in T1 paralleled the average DG (Figure 2), indicating that the T1-LA diet was
3
comparable to a conventional concentrate-based diet in Gansu Province in the warm season.
4
The FCR did not differ significantly between the feeding groups in T2, but it was
5
numerically higher for T2-LA than for the other feeding groups. Although there was no
6
clear relationship between DG and FCR in T2, the merit of low-level substitution of AH for
7
C, as compared with high-level AH feeding, was thus emphasized in both T1 and T2.
8
The digestibility of DM, CP and NDFom in the three feeding groups did not differ
9
significantly in T1 (P > 0.05, Table 3). Conversely, the digestibility of DM, CP and NDFom
10
for T2-CTRL was significantly higher than for T2-LA and T2-HA (P < 0.05). Afore
11
discussed, the depression of NDFom digestibility for AH feeding groups in T2 might have,
12
partly, been explained by a higher outflow rate of rumen digesta in the cool season
13
(Kennedy and Murphy 1988). The difference in AH feeding level between LA and HA did
14
not affect nutrient digestibility in the both trials.
15
16
Energy utilization efficiency
17
Gross energy intake did not differ significantly (P > 0.05) among the feeding groups in T1,
18
whereas it differed significantly (P < 0.05) among the feeding groups in T2 with showing
19
the highest value for T2-HA, followed by T2-LA and then T2-CTRL (Table 4). In T1, the
20
energy digestibility of the feeding groups did not differ significantly (P > 0.05), although
21
the increase in fecal energy excretion (from 528.2 for T1-CTRL to 633.5 kJ kg–0.75 BW day–
22
1 for T1-HA; data not shown) with increasing AH feeding level resulted in the slight 23
decrease in energy digestibility. In contrast, energy digestibility was significantly (P < 0.05)
greater for T2-CTRL than for the other two groups; in T2, the values were in the reverse
1
order of ranking of total DMI (Table 3). As was the trends observed for digestion
2
coefficients of gross energy in the two trials, energy metabolizability did not differ among
3
groups in T1 (P > 0.05), but it was significantly greater (P < 0.05) for T2-CTRL than for
4
the other T2 groups. Plausibly, the lack of difference in MEI and energy metabolizability (P
5
> 0.05) between T2-LA and T2-HA might explain the lack of difference in DG between
6
these two groups (Figure 2). Increasing the dietary substitution rate of AH did not markedly
7
improve energy metabolizability in T1 and T2. In both T1 and T2, CH4 production was 8
significantly greater for the HA feeding group than for the other two groups (P < 0.05).
9
Hales et al. (2014), in a study using dry-rolled corn-based diets supplemented with AH,
10
reported that fecal energy loss and methane production increased with decreasing energy
11
digestibility as the AH feeding level increased owing to an increase in NDF intake and
12
coinciding decrease in NDF digestibility. The numerical and significant differences in
13
NDFom digestibility were observed in T1 and T2, respectively, and the relationship across
14
CH4 production, NDFom digestibility and NDFom intake observed in the current study 15
appeared to be consistent with those of Hales et al. (2014).
16
The values for energy digestibility and metabolizability (Table 4) agreed with the results
17
of Liu et al. (2013), who calculated 66% energy digestibility and 58% energy
18
metabolizability in Xiangzhong Black bulls. There was no large difference between
19
crossbred Simmental calves and other breeds in terms of energy metabolizability. On the
20
other hand, MEm, which was calculated as 652 kJ kg–0.75 BW day–1 in T1 and 600 kJ kg–0.75 21
BW day–1 in T2 (Figure 3), seemed to be higher than the previous reported values of 469 kJ
22
kg–0.75 BW day–1 (Henrique et al. 2005), 460 kJ kg–0.75 BW day–1 for Nelore bulls, 485 kJ
23
kg–0.75 BW day–1 for Nelore steers (Tedeschi et al. 2002), 506 kJ kg–0.75 BW day–1 for
Chinese water buffalo (Qin et al. 2011) and 506 kJ kg–0.75 BW day–1 for Xiangzhong Black
1
bulls (Liu et al. 2013). This suggests that the relatively larger MEm requirement of
2
crossbred Simmental bull calves might have resulted in a large ME requirement for BW
3
gain than that of other species.
4
In this study, T1-LA, T2-LA and T2-HA treatment exceeded the targeted DG value, and
5
the ratio of DG to MEI (DG ME–1, in g MJ–1 day–1) was calculated as 23.2, 20.1 and 19.3
6
for T1-LA, T2-LA and T2-HA, respectively. These values were higher than those reported
7
previously as 19.2 g MJ–1 day–1 for Zebu cows and 15.7 g MJ–1 day–1 for Brown Swiss 8
cows (Jose et al. 2010) and were lower than that of 31.1 g MJ–1 day–1 in Xiangzhong Black
9
bulls (Liu et al. 2013). Thus the ME utilization efficiency for BW gain for crossbred
10
Simmental bull calves appeared to be lower than that for Chinese indigenous Xiangzhong
11
Black cattle. The less ME utilization efficiency of crossbred Simmental male calves
12
suggested the need for greater energy allowance to ensure a target production performance
13
as compared with Xiangzhong Black cattle.
14
The experimental group that achieved 1-kg DG, T1-LA, T2-LA and T2-HA group was
15
estimated to suffice 113, 125 and 136% of the NE requirement for maintenance and
16
fattening (NEmf) (CFSBC 2004), respectively. The NEmf provision estimates by CFSBC
17
(2004) appeared to be lower than the actual NE intakes of the calves in each feeding group.
18
Liu et al. (2013) reported that 13-months-old Xiangzhong Black cattle achieved BW gain
19
of 1 kg day–1 and the animal growth performance was well mirrored by the NEmf of
20
CFSBC (2004). This suggests that there is a difference among breeds in the extent to which
21
they meet the NE requirement for BW gain based on the estimation equation of CFSBC
22
(2004). These differences among cattle breeds should be incorporated into the current
23
CFSBC (2004) to predict NE requirements of beef cattle accurately at a given production
level.
1
2
Economic evaluation of feeding AH to calves
3
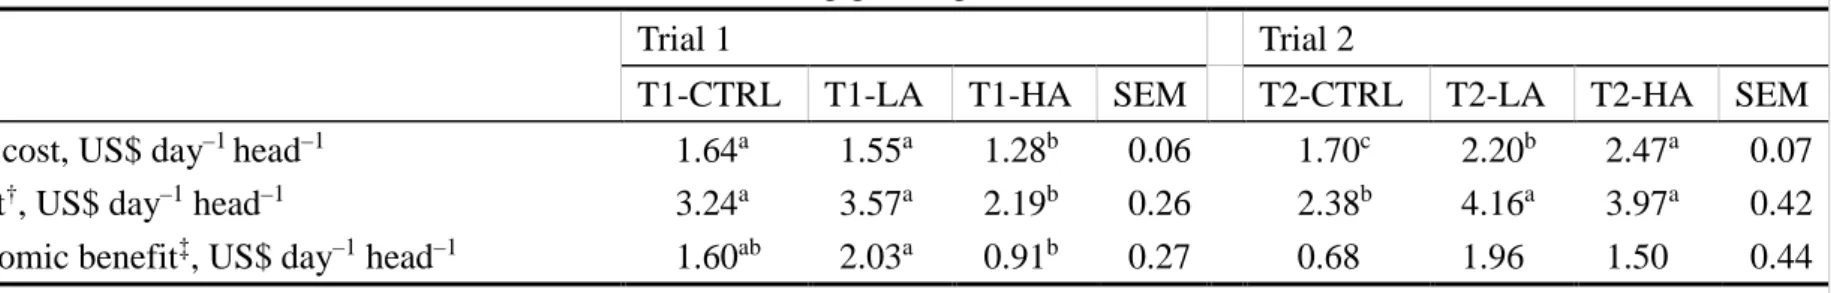
We found a significant decrease from T1-LA to T1-HA and a significant increase from
4
T2-CTRL to T2-HA in feed costs (P < 0.05) (Table 5), due to a decrease in DMI of C
5
relatively more than an increase of DMI of AH from T1-LA to T1-HA, and an increase in
6
DMI of AH without a decrease in DMI of C from T2-CTRL to T2-LA and T2-HA (Table 3).
7
The feed costs of LA groups in both trails were numerically less than T1-CTRL for T1 and
8
significantly less than T2-HA for T2, respectively. The groups that achieved a 1-kg DG
9
were T1-LA, T2-LA and T1-HA (Figure 2). The feed cost was lower (P < 0.05) and the
10
economic benefit was numerically higher for T2-LA than for T2-HA. In order to achieve a
11
1-kg DG, feeding AH at the LA level seemed preferable in terms of economic feasibility in
12 Gansu Province. 13 14 Conclusions 15 16
Replacement of C with AH at differing levels did not cause DMI depression associated
17
with increased NDFom intake, but high level AH feeding caused an increase in methane
18
emission. The AH supplementation at a low level increased the DG of growing beef calves.
19
Energy metabolizability did not differ significantly between the low-level AH diet and the
20
high-level AH diet. Considering the importance of economic feasibility, the low-level AH
21
diet gave a relatively high economic benefit. Low-level AH inclusion in the diets of
22
growing beef cattle is preferably practiced in the drylands of Gansu province, China. As the
23
DMI and DG lowered for T2-CTRL than for the other groups in T2, the feeding practice
allowing diet with being relatively high proportion of concentrate in the cool season may
1
have to be carefully considered. The MEm requirements of crossbred Simmental calves
2
were calculated to be higher than for other breeds, suggesting that the energy allowance
3
needs to be carefully calculated to ensure the energy requirement of crossbred Simmental.
4
To our knowledge, this is the first report of the determination of energy metabolism using a
5
respiration trial in beef cattle fed domestic basal forages produced in Gansu Province,
6
China. In conjunction with an energy metabolism study, further evaluation of the nitrogen
7
utilization status of growing Chinese Simmental beef calves will be needed to establish a
8
feeding regimen appropriate to the drylands of western China.
9
10
Acknowledgments
11
12
We thank the students of the College of Grassland Science, Lanzhou University, China, for
13
supporting the animal experiments and for analyzing feed and fecal samples. This study
14
was supported by the Marginal Region Agriculture Project of Tottori University, the
15
National Key Project of Scientific and Technical Supporting Programs of China
16
(2014CB138706), the National Natural Science Foundation of China (No. 31172249), and
17
the Program for Changjiang Scholars and Innovative Research Team in the University of
18 China (IRT13019). 19 20 References 21 22
AFRC (1993) Energy and Protein requirements of Ruminants. An advisory manual
23
prepared by the AFRC Technical Committee on Responses to Nutrients. CAB
International, Wallingford, UK.
1
AOAC (Association of Official Analytical Chemists) (1984) Official Method of Analysis,
2
14th edn. AOAC, Arlington, VA.
3
Brower E (1965) Report of sub-committee on constants and factors. In: Energy Metabolism
4
of Farm Animals (Ed. Blaxter KL), EAAP Publ. No. 11, Academic Press, London, 441–
5
443.
6
Chinese State Committee for Development and Reform (2013) Chinese National Plan for
7
developing production of beef and sheep meat 2013–2020. Chinese State Committee for
8
Development and Reform, Beijing, China. (In Chinese.)
9
Defoor PJ, Galyean ML, Salyer GB, Nunnery GA, Parsons CH (2002) Effects of roughage
10
source and concentration on intake and performance by finishing heifers. J Anim Sci 80:
11
1395–1404.
12
FAO (2015) FAOSTAT. Statistics Division, FAO, Rome, available from URL:
13
http://faostat3.fao.org/download/Q/QL/E [cited 30 November 2015].
14
Freetly HC, Nienaber JA, Brown-Brandl T (2006) Partitioning of energy during lactation of
15
primiparous beef cows. J Anim Sci 84: 2157–2162.
16
Guo H, Zhao J, Yand X, Huang B, Zhang M, Wand N (2007) Moisture use efficiency and
17
economic benefit of some crops in the east of Gansu. Chinese J Soil Sci 38: 709–712. (In
18
Chinese.)
19
Hales KE, Brown-Brandl TM, Freely HC (2014) Effects of decreased dietary roughage
20
concentration on energy metabolism and nutrient balance in finishing beef cattle. J Anim
21
Sci 92: 264–271.
22
Han Z, Zheng Q, Abe J, Zhou Z (2008) Pasturage prohibition and pasturage pause and
23
stock raising management in Inner Mongolia China: transaction zone between cropping
area and nomadic area. Agric Marketing J of Japan 17: 80–85. (In Japanese.)
1
Henrique DS, Vieira RAM, Malafaia PAM, Mancini MC, Goncalves AL (2005) Estimation
2
of the total efficiency of metabolizable energy utilization for maintenance and growth by
3
cattle in tropical conditions. R Bras Zootec 34: 1006–1016.
4
Hou FJ, Nan ZB, Xie YZ, Li XL, Lin HL, Ren JZ (2008) Integrated crop-livestock
5
production systems in China. Rangeland J 30: 221–231.
6
Kennedy PM, Murphy MR (1988) The nutritional implications of differential passage of
7
particles through the ruminant alimentary tract. Nutr Res Rev 1: 189–208.
8
Ichinohe T, Tamura T, Ueda K, Okubo M, Asahida Y (1994) The particle size distribution
9
of ingested boli, rumen digesta and feces in sheep fed orchardgrass hay harvested at
10
different stage of maturity. Anim Sci Technol 65: 701–708.
11
Jose VC, Juan CK, Juan GM (2010) Estimation of Metabolizable Energy Requirements for
12
Maintenance and Efficiency of Weight Gain in Bos Taurus (Brown Swiss) and Bos
13
Indicus (Zebu) Cows in Tropical Mexico. J Animal Vet Adv 9: 522–528.
14
Krause KM, Combs DK, Beauchemin KA (2002) Effects of forage particle size and grain
15
fermentability in mid lactation cows. 1. Milk production and diet digestibility. J Daily
16
Sci 85: 1936–1946.
17
Liu D, Fu D, Qu M, Zhu Y, Li F, Deng X (2013) Energy metabolism and requirement of 12
18
to 13 months old Xiangzhong Black cattle. Chinese J Anim Nutr 25: 3013–3019. (In
19
Chinese.)
20
MAFF (2013) Special Study for Governmental Administration: Country Report of 2012 -
21
China and Thailand. Policy Research Institute, Ministry of Agriculture, Forestry and
22
Fisheries, Tokyo, Japan. (In Japanese.)
23
McCarthy RD, Klusmeyer TH, Vicini JL, Clark JH, Nelson DR (1989) Effects of source of
protein and carbohydrate on ruminal fermentation and passage of nutrients to the small
1
intestine of lactating cows. J Daily Sci 72: 2002–2016.
2
Minson DJ (1980) Nutritional differences between tropical and temperate pastures. In:
3
Grazing Animals (Ed Morley FHW), Commonwealth Agricultural Bureaux, Farunham
4
Royal, Slough, 167–182.
5
Ministry of Agriculture of the People’s Republic of China (2004) Feeding Standard for
6
Beef Cattle. Ministry of Agriculture of the People’s Republic of China, Beijing,
7
available from URL:
8
http://wenku.baidu.com/view/a112b1a1c77da26925c5b0f1.html [cited 18 July 2015].
9
(In Chinese.)
10
Munitifering RB (1982) Evaluation of various lignin assays for determining ruminal
11
digestion of roughages by lambs. J Anim Sci 55: 432–438.
12
National Bureau of Statistics of China (2014) China Statistics Yearbook 2013. China
13
Statistics Press, Beijing, China. (In Chinese.)
14
NARO (National Agricultural and Food Research Organization) (2010) Standard Tables of
15
Feed Composition in Japan (2009). Japan Livestock Industry Association, Tokyo. (In
16
Japanese.)
17
Oba M, Allen MS (2003) Effects of corn grain conservation method on feeding behavior
18
and productivity of lactating dairy cows at two dietary starch concentrations. J Dairy Sci
19
86: 174–183.
20
Qin G, Zou C, Pang C, Yang B, Liang X, Liu J, Xia Z, Wen Q, Yan T (2011) Evaluation of
21
fasting metabolism of growing water buffalo (Bubalus, Bubalis). Anim Sci J 82: 735–
22
740.
23
Rong Y, Han J, Hu Y, Li G (2004) The review of grazing alfalfa varieties. Grassl China 26:
49-56. (In Chinese.)
1
Tedeschi LO, Boin C, Fox DG, Leme PR, Alleoni GF, Lanna DPD (2002) Energy
2
requirement for maintenance and growth of Nellore bulls and steers fed high-forage
3
diets. J Anim Sci 80: 1671–1682.
4
United Nations Environment Programme (1997) World Atlas of Desertification. UNEP,
5
Nairobi.
6
Van Soest PJ, Robertson JB, Lewis BA (1991) Methods for dietary fiber, neutral detergent
7
fiber, and nonstarch polysaccharides in relation to animal nutrition. J Dairy Sci 74:
8
3583–3597.
9
Zhu X, Shen Y, Yan S, Zhao Y (1997) The base research of Linze grassland ecological test
10
station. Pratacultural Sci 1997 (2): 14–35. (In Chinese.)
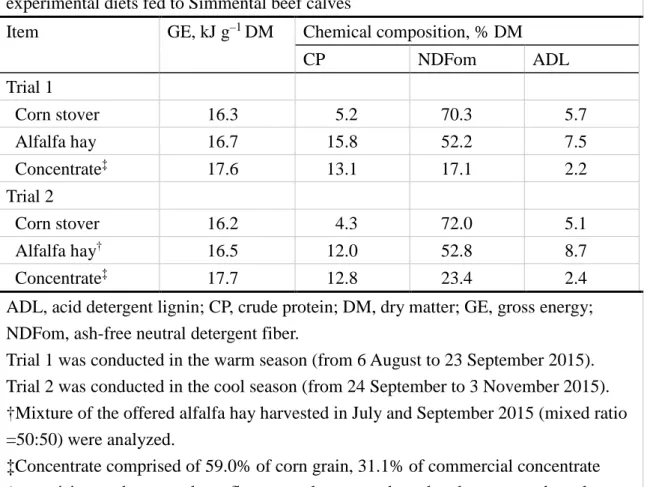
Table 1 Gross energy concentration and chemical composition of feed ingredients of experimental diets fed to Simmental beef calves
Item GE, kJ g–1 DM Chemical composition, % DM
CP NDFom ADL Trial 1 Corn stover 16.3 5.2 70.3 5.7 Alfalfa hay 16.7 15.8 52.2 7.5 Concentrate‡ 17.6 13.1 17.1 2.2 Trial 2 Corn stover 16.2 4.3 72.0 5.1 Alfalfa hay† 16.5 12.0 52.8 8.7 Concentrate‡ 17.7 12.8 23.4 2.4
ADL, acid detergent lignin; CP, crude protein; DM, dry matter; GE, gross energy; NDFom, ash-free neutral detergent fiber.
Trial 1 was conducted in the warm season (from 6 August to 23 September 2015). Trial 2 was conducted in the cool season (from 24 September to 3 November 2015). †Mixture of the offered alfalfa hay harvested in July and September 2015 (mixed ratio =50:50) were analyzed.
‡Concentrate comprised of 59.0% of corn grain, 31.1% of commercial concentrate (comprising soybean meal, sunflower meal, rape seed meal and cotton seed meal, urea, sodium chloride, vitamin and mineral premix; composition not clear), and 9.9% of wheat bran as fed basis.
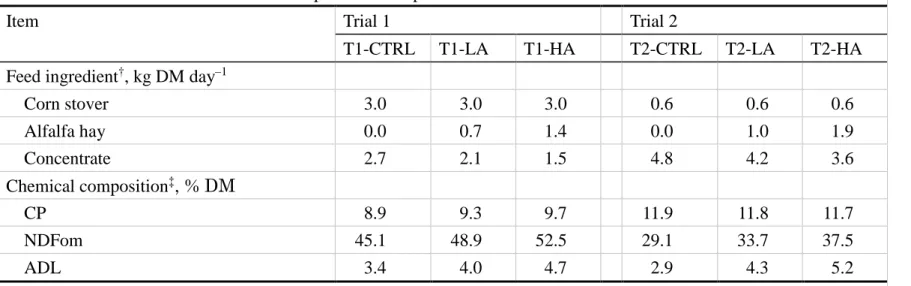
Table 2 Feed allowance and chemical composition of experimental diets fed to Simmental beef calves
Item Trial 1 Trial 2
T1-CTRL T1-LA T1-HA T2-CTRL T2-LA T2-HA
Feed ingredient†, kg DM day–1
Corn stover 3.0 3.0 3.0 0.6 0.6 0.6 Alfalfa hay 0.0 0.7 1.4 0.0 1.0 1.9 Concentrate 2.7 2.1 1.5 4.8 4.2 3.6 Chemical composition‡, % DM CP 8.9 9.3 9.7 11.9 11.8 11.7 NDFom 45.1 48.9 52.5 29.1 33.7 37.5 ADL 3.4 4.0 4.7 2.9 4.3 5.2
ADL, acid detergent lignin; CP, crude protein; DM, dry matter; NDFom, ash-free neutral detergent fiber Trial 1 and Trial 2: for details, see footnote to Table 1.
T1-CTRL and T2-CTRL, no alfalfa hay feeding (control); T1-LA and T2-LA, low level of alfalfa hay feeding; T1-HA and T2-HA, high level of alfalfa hay feeding.
†Calculated by using the equation of AFRC (1993) on the basis of the initial body weight of male calves for Trial 1 (175.8 kg on average) and Trial 2 (218.8 kg on average) to suffice the metabolizable energy requirement for a 1-kg daily gain.
‡Values were estimated on the basis of the chemical composition of feed ingredients (Table 1) and the ingredient compositions of the experimental diets.
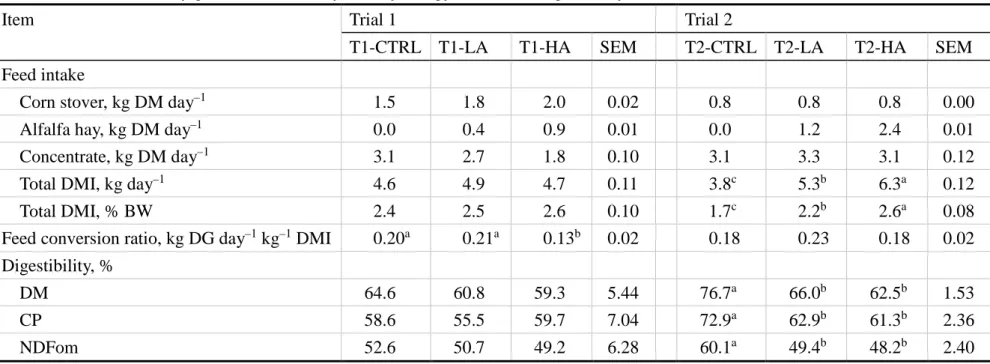
Table 3 Feed intake, daily gain, feed efficiency, dietary energy intake, and digestibility in Simmental beef calves
Item Trial 1 Trial 2
T1-CTRL T1-LA T1-HA SEM T2-CTRL T2-LA T2-HA SEM Feed intake
Corn stover, kg DM day–1 1.5 1.8 2.0 0.02 0.8 0.8 0.8 0.00
Alfalfa hay, kg DM day–1 0.0 0.4 0.9 0.01 0.0 1.2 2.4 0.01
Concentrate, kg DM day–1 3.1 2.7 1.8 0.10 3.1 3.3 3.1 0.12
Total DMI, kg day–1 4.6 4.9 4.7 0.11 3.8c 5.3b 6.3a 0.12
Total DMI, % BW 2.4 2.5 2.6 0.10 1.7c 2.2b 2.6a 0.08
Feed conversion ratio, kg DG day–1 kg–1 DMI 0.20a 0.21a 0.13b 0.02 0.18 0.23 0.18 0.02 Digestibility, %
DM 64.6 60.8 59.3 5.44 76.7a 66.0b 62.5b 1.53
CP 58.6 55.5 59.7 7.04 72.9a 62.9b 61.3b 2.36
NDFom 52.6 50.7 49.2 6.28 60.1a 49.4b 48.2b 2.40
Trial 1, Trial 2, T1-CTRL, T1-LA, T1-HA, T2-CTRL, T2-LA, and T2-HA: for details, see Tables 1 and 2 or the Materials and methods section of the text.
BW, body weight (kg); CP, crude protein; DG, daily gain; DM, dry matter; DMI, dry matter intake; NDFom, ash-free neutral detergent fiber; SEM, standard error of the mean.
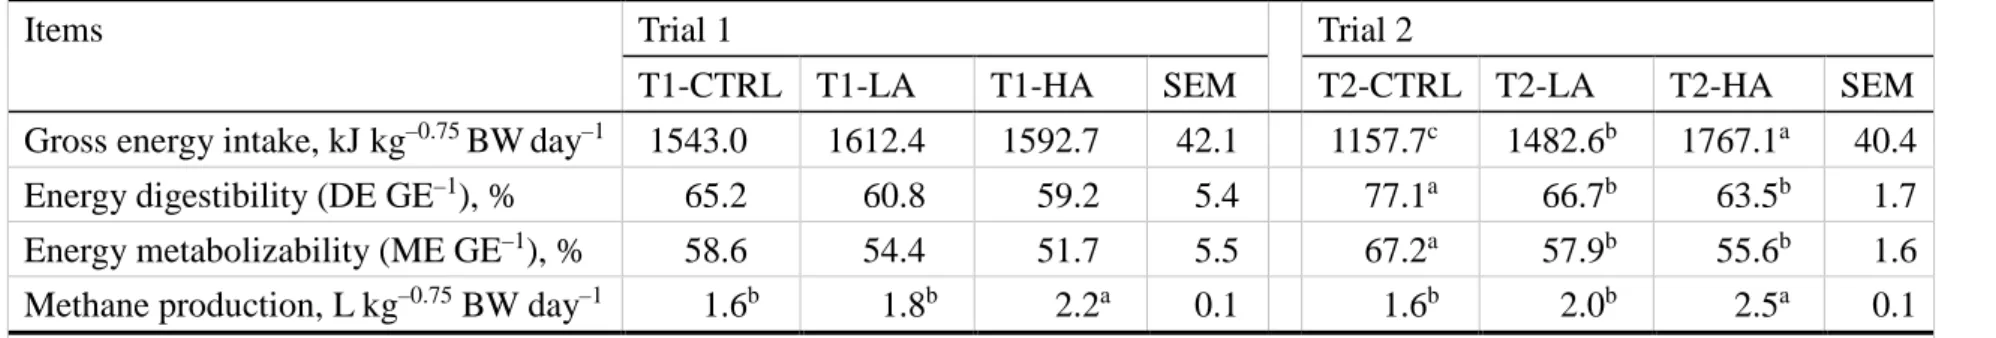
Table 4 Energy utilization efficiencies and methane emission in Simmental beef calves
Items Trial 1 Trial 2
T1-CTRL T1-LA T1-HA SEM T2-CTRL T2-LA T2-HA SEM
Gross energy intake, kJ kg–0.75 BWday–1 1543.0 1612.4 1592.7 42.1 1157.7c 1482.6b 1767.1a 40.4 Energy digestibility (DE GE–1), % 65.2 60.8 59.2 5.4 77.1a 66.7b 63.5b 1.7 Energy metabolizability (ME GE–1), % 58.6 54.4 51.7 5.5 67.2a 57.9b 55.6b 1.6
Methane production, L kg–0.75 BW day–1 1.6b 1.8b 2.2a 0.1 1.6b 2.0b 2.5a 0.1 Trial 1, Trial 2, T1-CTRL, T1-LA, T1-HA, T2-CTRL, T2-LA, and T2-HA: for details, see Tables 1 and 2 or the Materials and methods section of the text.
BW, body weight; DE, digestible energy; GE, gross energy; ME, metabolizable energy; SEM, standard error of the mean.
Table 5 Economic evaluation of alfalfa introduction for feeding growing Simmental bull calves in Gansu Province
Item Trial 1 Trial 2
T1-CTRL T1-LA T1-HA SEM T2-CTRL T2-LA T2-HA SEM Feed cost, US$ day–1 head–1 1.64a 1.55a 1.28b 0.06 1.70c 2.20b 2.47a 0.07 Profit†, US$ day–1 head–1 3.24a 3.57a 2.19b 0.26 2.38b 4.16a 3.97a 0.42
Economic benefit‡, US$ day–1 head–1 1.60ab 2.03a 0.91b 0.27 0.68 1.96 1.50 0.44 Trial 1, Trial 2, T1-CTRL, T1-LA, T1-HA, T2-CTRL, T2-LA, and T2-HA: for details, see Tables 1 and 2 or the Materials and methods section of the text.
SEM, standard error of the mean.
Values for feed cost were calculated on the basis of the results for feed intake (Table 3) as obtained in the feeding trials. †Calculated by multiplying DG (Figure 2) by the market price of a growing calf.
‡Calculated by subtracting the feed cost from the profit†.
Figure legends
Figure 1 Locations of Gansu Province and Linze Research Station of Lanzhou University, and the eight western provinces prioritized for beef production in China.
Figure 2 Metabolizable energy intake and daily gain of calves. CTRL, control group; LA, low-level alfalfa hay feeding group; HA, high-level alfalfa hay feeding group. a, b Means of
metabolizable energy intake and daily gain with different superscripts within each of Trial 1 and Trial 2 differ significantly among the three feeding groups (P ≤ 0.05). Empty bars, Metabolizable energy intake (kJ kg–0.75 BW day–1); solid bars, Daily gain (g day–1).
Figure 3 Linear regression of net energy intake (NEI, f(x)) and metabolizable energy intake (MEI, x) of calves in Trial 1 (warm season) and Trial 2 (cool season). The NEI was estimated as MEI – HP (heat production). Units are expressed on a metabolic body size basis (kJ kg–0.75 BW day–1). Trial 1: f(x) = 1.02 ± 0.06 x – 663 ± 60.4, R2 = 0.90, n = 30.
Trial 2: f(x) = 0.77 ± 0.10 x – 462 ± 120.3, R2 = 0.71, n = 24. Metabolizable energy for