Journal of Science and Technology in Lighting Vol.44, 2020
Translated Paper
Performance Evaluation and Optimization of Design of
Light Focus in Otoscope during Otoscopic Examination by Headlight
Mitsuhiro MATSUMOTO
†Kanagawa University, Department of Industrial Engineering and Management, Faculty of Engineering Paper originally published in Journal of the Illuminating Engineering Institute of Japan, Vol. 104, No.2, 2020
ABSTRACT
We evaluated the performance of light focus in an existing otoscope with a headlight employing an LED source. The mechanism of the otoscope was shown, and a coordinate system was set in the otoscope to evaluate the light-focusing performance. Experimental equipment based on the set coordinate system was built using the existing otoscope and headlight. We demonstrated experimental methods for mea-suring illuminance at the narrow mouth in the otoscope using the built experimental equipment. In the experiments conducted using the experimental methods, the performance of light focus in the existing otoscope was evaluated by measuring the illuminance. The optimal new otoscope for focusing light was designed using a headlight employing the LED source. The otoscope was built using the results obtained by the designs. We evaluated the performance of light focus in the designed otoscope with the otoscopes we built. The experimental equipment was built with the constructed otoscope and the headlight. We demonstrated experimental methods for measuring illuminance at the narrow mouth in the otoscope us-ing the built experimental equipment. In the experiments conducted usus-ing the experimental methods, the performance of light focus in the designed otoscope was evaluated by the measured illuminance.
KEYWORDS: otoscope, headlight, otoscopic examination, light focus, design
1. Introduction
In otoscopic examination, a light source, a forehead mirror, and an otoscope are used in visually examin-ing the inside of the ear1). Since the forehead mirror is
a concave mirror that reflects light from the source, it illuminates the inside of the ear by collecting light at the focal point of the forehead mirror2). An otoscope is
conically shaped like a bell or a funnel and it has both a wide mouth and a narrow mouth. The narrow mouth is inserted inside the ear2). By reflecting the light from
the source using the forehead mirror and passing it through the wide mouth of the otoscope, with the nar-row mouth as the focal point, the inside of the ear is illuminated2). Since there are restrictions on the
posi-tional relationship between the source, forehead mirror, and the otoscope, there tends to be an inconvenience with the forehead mirror3). Therefore, instead of a light
source and a forehead mirror, a headlight with a built-in light source was used4). For the built-in light source,
LEDs were used5). However, unlike the forehead mirror
that illuminates the inside of the ear by focusing light at the focal point, the LEDs illuminate the inside of the ear by spreading the light from itself6). Moreover, in a
conical shape like an otoscope, light passing through
the wide mouth is reflected by the inner surface and focused on the narrow mouth7).
There are different types of otoscopes depending on the shape of the conical inner surface, e.g., bell-type and funnel-type. Furthermore, there are likewise differ-ent types of inner surface conditions, e.g., color or the surface treatment, the length from the wide mouth to the narrow mouth, and the sizes of the wide and the narrow mouths2). However, when using the headlight
and otoscope, the amount of brightness required at the narrow mouth to illuminate the inside of the ear, taking into consideration the type of otoscope and the distance and angle between the headlight and the otoscope, re-mains unclear. With regard to the brightness desired by the doctors in the otoscopic examination, the selec-tion of the type of the otoscope, as well as the distance and angle between the headlight and the otoscope, depends on the individual experience of the correspond-ing doctor. If the amount of brightness of the narrow mouth can be quantitatively shown by the type of the otoscope as well as the distance and angle between the headlight and the otoscope, it can be a criterion for doctors in selecting otoscopes based on the required brightness. Therefore, in order to illuminate the inside
doi: 10.2150/jstl.IEIJ200000642
of the ear at the narrow mouth of the otoscope using a headlight that uses a light-spreading LED as its source and a conical otoscope for focusing light, it is necessary to evaluate the light focus performance of the existing otoscope using a headlight that uses LED as its source. Furthermore, by making a novel otoscope design which is optimal for light focus, it becomes possible to reduce the required brightness of the headlight used in the otoscopic examination, thereby helping in energy con-servation. Moreover, it becomes possible to reduce the glare discomfort caused by directing bright light onto the patient. Therefore, it is necessary to make a new otoscope design which is optimal for light focus.
In this paper, we evaluate the light focus performance of an existing otoscope which uses a headlight with LED as its light source. The mechanism of the otoscope, the performance of which is to be evaluated, is shown. In addition, a coordinate system was set for evaluating its performance. With using the coordinate system, the experimental equipment using the existing otoscope and a headlight was built. The experimental method for measuring the illuminance of light at the narrow mouth of the otoscope using the built experimental equipment is described herein. In the experiment using the said experimental method, we measured the light focus per-formance of an existing otoscope using the measured illuminance. Furthermore, for the headlight which uses LED as its light source, we designed a new otoscope which is optimal for light focus. Using our design, we constructed an actual otoscope. Using the constructed otoscope, we evaluated its light focus performance. For the performance evaluation, the experimental equip-ment using the existing otoscope and a headlight were constructed. The experimental method for measuring the illuminance of light at the narrow mouth of the oto-scope using the constructed experimental equipment is demonstrated herein. In our experiment, the light focus performance of the designed otoscope was evaluated using the measured illuminance.
The ultimate goal of this study is to construct an otoscope that doctors can use for actual otoscopic ex-amination and to evaluate its performance by having the doctors use the constructed otoscope.
2. Light focus performance evaluation 2.1 Mechanism of the otoscope
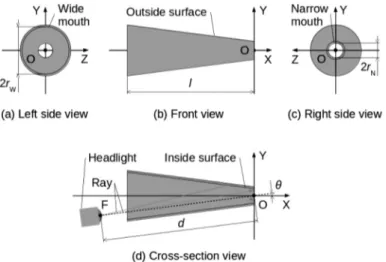
The evaluation of the light focus performance of the existing otoscope was carried out using a headlight that uses LED as its light source. The mechanism of the otoscope, the light focus performance of which is evalu-ated, is described. Figure 1 shows the mechanism and the coordinate system of the otoscope. Figure 1 (a)–(d) show the left-side view, front view, right-side view, and cross-sectional view of the front view, respectively. The otoscope is conical in shape, with a vertex, a base, and sides. The inside of the cone is hollow. The narrow and wide mouths are both circular in shape, with the nar-row mouth located at the top and the wide mouth at the bottom. The hollow runs through the inside of the cone from the narrow mouth to the wide mouth. The side surface is defined as the outside surface and the surface inside the cone is defined as the inside surface. Both the outside and the inside surfaces have the same conical shape. The conical shape is axisymmetric with respect to the central axis. A headlight is installed on the wide-mouth side of the otoscope. The light emitted from the focal point of the headlight enters the otoscope through the wide mouth. The light that enters the oto-scope reaches the narrow mouth either after reflection on the inside surface or even without reflection, and thereafter, illuminates the narrow mouth.
In the mechanism of the otoscope, a coordinate sys-tem is set for evaluating the light focus performance. The coordinate system of the otoscope is designated as the X–Y–Z coordinate system. In the X–Y–Z coordinate system, the center of the narrow mouth is indicated as the origin O, the direction from the wide mouth to the narrow mouth is shown as the X-axis, and the radial
direction of the narrow mouth is specified as the Y and Z axes. The radii of the wide mouth and the narrow mouth are indicated as W and N, respectively, and the
length of the otoscope in the X-axis direction is desig-nated as . Since the radii are W and N, the diameters
of the wide mouth and the narrow mouth become 2 W
and 2 N, respectively. The shape of the otoscope is
axi-ally symmetric with respect to the X-axis, the central axis. Therefore, hereafter, the otoscope will be shown on the X–Y plane. F is the focal point of the headlight. The distance from the focal point F to the origin O is represented by and the angle between the X-axis and the axis passing through the focal point F and the origin O is depicted by θ.
2.2 Performance evaluation 2.2.1 Experimental method
In order to evaluate the light focus performance of the otoscope, the experimental equipment was built us-ing a measured object, such as an existus-ing otoscope and an existing headlight in the set coordinate system. The experimental method for measuring the illuminance of light at the narrow mouth of the measured object using
the built experimental equipment is described herein. Table 1 shows the specifications of the measured ob-jects. Depending on the specification, the measured objects are given their corresponding object numbers from O-1 to O-18. The measured objects are holes and otoscopes. Holes are used for confirming the light focus effect of the otoscope. The otoscope manufacturers are Daiichi Medical and Matsuyoshi & Co., Ltd. The inside surface shapes are bell and funnel types. The inside surface conditions are black, chromed matte, and chromed gloss. Length , diameter 2 W, and diameter
2 N are the values obtained by measuring the measured
object using Vernier calipers in units of 0.1 mm. After having compared objects O-4 to O-12, we found that although the inside surface conditions are different, the length and the diameters 2 W and 2 N are almost
the same. After having compared objects O-10 to O-15, we determined that although the inside surface shape is the same, the length and the diameter 2 W are
dif-ferent depending on the manufacturer. After having compared objects O-13 to O-18, we observed that if the inside surface shape differs, the diameter 2 W differs.
After having compared objects O-16 to O-18, we as-Table 1 Specifications of measured objects.
Object
number Object type Manufacturer name Surface shape conditionSurface [mm] 2W [mm] 2N [mm]
O-1 Hole — — — — — 3
O-2 Hole — — — — — 4
O-3 Hole — — — — — 5
O-4 Otoscope Daiichi medical Bell Black 34.1 21.7 3 O-5 Otoscope Daiichi medical Bell Black 34.1 21.7 4 O-6 Otoscope Daiichi medical Bell Black 34.1 21.7 5 O-7 Otoscope Daiichi medical Bell Chromed matte 34.1 21.9 3 O-8 Otoscope Daiichi medical Bell Chromed matte 34.1 21.9 4 O-9 Otoscope Daiichi medical Bell Chromed matte 34.1 21.9 5 O-10 Otoscope Daiichi medical Bell Chromed gloss 34.1 22.1 3 O-11 Otoscope Daiichi medical Bell Chromed gloss 34.1 22.1 4 O-12 Otoscope Daiichi medical Bell Chromed gloss 34.1 22.1 5 O-13 Otoscope Matsuyoshi Bell Chromed gloss 35.1 20.7 3.1 O-14 Otoscope Matsuyoshi Bell Chromed gloss 35 20.7 3.9 O-15 Otoscope Matsuyoshi Bell Chromed gloss 35 20.7 5 O-16 Otoscope Matsuyoshi Funnel Chromed gloss 34.8 12.4 2.9 O-17 Otoscope Matsuyoshi Funnel Chromed gloss 34.5 13.2 4.1 O-18 Otoscope Matsuyoshi Funnel Chromed gloss 34.8 13.6 5.1
certained that if the diameter 2 N differs, the diameter
likewise 2 W differs.
Figure 2 shows the image of the otoscope to be mea-sured. Figure 2 (a)–(c) show the left-side view, front view, and right-side view, respectively. In the image, otoscope numbers O-5, O-8, O-11, O-14, and O-17 are shown. Each otoscope is placed on a transparent board so that the inside surface condition and the narrow mouth could be easily understood. Figure 2 (a) shows the wide mouth and the inside surface, Figure 2 (b) shows the outside surface, and Figure 2 (c) shows the narrow mouth of the otoscope. The numbers O-5, O-8, and O-11 of Figure 2 (a) differ according to their in-side surface conditions, i.e., black, chromed matte, and chromed gloss. After having compared objects O-11 and O-14 of Figure 2 (a), we found that even if their in-side surface condition is the same chromed gloss, their inside surface conditions differ if the manufacturers are different. After having compared objects O-11 and O-14 of Figure 2 (b), we found that even if the shape of the outside surface is the same bell shape, the shapes of their outside surfaces differ if the manufacturers are different. Because of the mechanism of the otoscope, if the shape of the outside surface differs, the shape of its inside surface likewise differs.
Figure 3 shows the image of the experimental equip-ment. The experimental equipment is composed of a headlight, the measured object, an illuminance meter, and a light-receiving section. The headlight used was the Navis LED headlights of the AS ONE Corporation. Navis LED headlights use LED as its light source, and the light emitted from the focal point F of the source spreads at 12.8 . Although the brightness of the LEDs can be changed in Navis LED headlights, in the ex-perimental equipment, it is fixed in its darkest state. The measured objects used are as shown in Table 1. For the illuminance meter and light-receiving section, the Konica Minolta T-10MA was used. Since the illu-minance meter and the light-receiving section can be separated in the T-10MA, they were used separately in the experimental equipment. Using the light-receiving
section, the T-10MA can measure an illuminance of 0.01 to 299,900 lx. The illuminance of light measured by the light-receiving section is displayed on the illuminance meter. The Navis LED headlight is installed on the wide mouth side of the otoscope. In the Navis LED headlight, the distance and angle θ are set by chang-ing the position of the focal point F. The light-receivchang-ing section is installed at the origin O, which is the narrow mouth of the measured object. The experimental equip-ment is placed in a dark room to block light other than the one from the Navis LED headlight. To remove stray light other than that from the Navis LED headlight, il-luminance is measured with the headlight off and on, and is shown by their difference.
Table 2 shows the experimental conditions of the measured objects. In the experiment using the experi-mental equipment, each experiexperi-mental condition was as-signed a number from E-1 to E-19. Using the measured objects O-1 to O-19, the experiment was conducted by setting the distance and angle θ. The distance values 132.3 mm and 127.1 mm were regarded as the distances at which the light spreading from the Navis LED headlight matches with the diameter 2 W.
Further-more, 132.3 mm is the distance at which objects O-10 to O-12 match with the diameter 2 W. Moreover, 127.1 mm
is the distance at which objects O-13 to O-15 match with the diameter 2 W. The values 192 mm and 257 mm were
determined based on the focal length of the forehead mirror. Kaga and Hinoki showed that the focal length of the forehead mirror was from 200 to 250 mm and 170 to 200 mm, respectively1, 2). The angle θ was determined
according to the inclination of the inside surface from
Figure 3 Image of experimental equipment.
Table 2 Experimental conditions of measured objects. Experimental
number Object number [mm] θ [ ] E-1 O-1, O-2, O-3 132.3 0 E-2 O-4, O-5, O-6 132.3 0 E-3 O-7, O-8, O-9 132.3 0 E-4 O-10, O-11, O-12 132.3 0 E-5 O-13, O-14, O-15 132.3 0 E-6 O-13, O-14, O-15 127.1 0 E-7 O-16, O-17, O-18 127.1 0 E-8 O-13 127.1, 192, 257 0 E-9 O-14 127.1, 192, 257 0 E-10 O-15 127.1, 192, 257 0 E-11 O-16 127.1, 192, 257 0 E-12 O-17 127.1, 192, 257 0 E-13 O-18 127.1, 192, 257 0 E-14 O-13 127.1 0, 3.7, 7.5 E-15 O-14 127.1 0, 3.7, 7.5 E-16 O-15 127.1 0, 3.7, 7.5 E-17 O-16 127.1 0, 3.7, 7.5 E-18 O-17 127.1 0, 3.7, 7.5 E-19 O-18 127.1 0, 3.7, 7.5
the wide mouth to the narrow mouth in O-17. The angle of inclination of the inside surface is 7.5 . Each experi-mental equipment was built based on the experiexperi-mental conditions shown in Table 2.
2.2.2 Experimental results
In the experiment using the experimental method, the light focus performances of existing otoscopes were evaluated using the measured illuminance. Figure 4 shows the comparison of illuminances for the cases E-1 and E-2. As the diameter 2 N increases from 3 to 5 mm,
the illuminance increases in E-1 and E-2. The rate of increase of illuminance for an increase in diameter 2 N
from 3 to 4 mm is 1.66 in E-1 and 1.68 in E-2, which is the largest. The rate of increase of illuminance for an increase in diameter 2 N from 4 to 5 mm is 1.61 in E-1,
which is the largest, and 1.38 in E-2. For the diameters 2 N of 3 mm, 4 mm, and 5 mm, illuminance is higher in
E-2 than in E-1. The rate of increase of illuminance from E-1 to E-2 is 1.49 when the diameter 2 N is 3 mm,
1.51 when the diameter 2 N is 4 mm, which is the
larg-est, and 1.29 when the diameter 2 N is 5 mm. Thus, the
illuminance of the measured object is higher for an otoscope than for a hole. Moreover, using an otoscope rather than a hole, light with an illuminance of 1.29 times to 1.51 times can be focused.
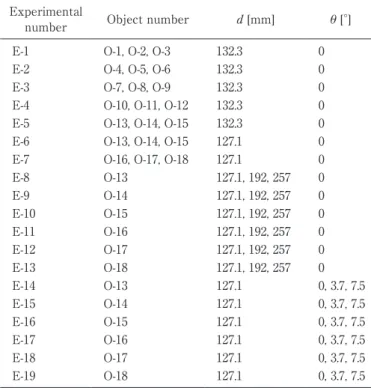
Figure 5 shows the comparison of illuminances for cases E-2, E-3, and E-4. As the diameter 2 N increases
from 3 to 5 mm, illuminance increases in E-2, E-3, and E-4. The rate of increase of illuminance for an increase in the diameter 2 N from 3 to 4 mm is 1.68 in E-2, 1.88
in E-3, which is the largest, and 1.74 in E-4. The rate of increase of illuminance for an increase in the diameter 2 N from 4 to 5 mm is 1.38 in E-2, 1.75 in E-3, which is
the largest, and 1.48 in E-4. For the diameters 2 N of
3 mm, 4 mm, and 5 mm, illuminance is higher in E-3 than in E-2 and higher in E-4 than in E-3. The rate of increase of illuminance from E-2 to E-3 is 1.33 when the diameter 2 N is 3 mm, 1.48 when the diameter 2 N is
4 mm, and 1.88 when the diameter 2 N is 5 mm, which
is the largest. The rate of increase of illuminance from E-3 to E-4 is 1.33 when the diameter 2 N is 3 mm, which
is the largest, 1.23 when the diameter 2 N is 4 mm,
and 1.04 when the diameter 2 N is 5 mm. Therefore,
il-luminance is higher when the inside surface condition of the otoscope is chromed matte or chromed gloss rather than black. An illuminance of 1.33 to 1.88 times higher can be focused by using chromed matte instead of black, and an illuminance of 1.04 to 1.33 times higher can be focused by using chromed gloss instead of using chromed matte.
Figure 6 shows the comparison of illuminances for cases E-4 and E-5. As the diameter 2 N increases from 3
to 5 mm, illuminance increases in E-4 and E-5. The rate of increase of illuminance for an increase in diameter 2 N from 3 to 4 mm is 1.74 in E-4, which is the largest,
and 1.49 in E-5. The rate of increase of illuminance for an increase in diameter 2 N from 3.9 to 5 mm is 1.48
in E-4, 1.55 in E-5, and it is the largest in E-5. For the diameters 2 N of 3 mm, 3.1 mm, 3.9 mm, 4 mm, and 5 mm,
illuminance is higher in E-5 than in E-4. The rate of increase of illuminance from E-4 to E-5 is 1.7 when the diameter 2 N is 3 mm and 3.1 mm, which is the largest,
1.44 when the diameter 2 N is 3.9 mm and 4 mm, and 1.52
when the diameter 2 N is 5 mm. Thus, even if the inside
surface condition of the otoscope is the same chromed gloss, due to the difference in the chromed gloss, light with an illuminance of 1.44 to 1.7 times can be focused.
Figure 7 shows the comparison of illuminances for cases E-6 and E-7. As the diameter 2 N increases from Figure 4 Comparison of illuminance in case that experimental
number is E-1 and E-2.
Figure 5 Comparison of illuminance in case that experimental number is E-2, E-3 and E-4.
Figure 6 Comparison of illuminance in case that experimental number is E-4 and E-5.
2.9 to 5.1 mm, illuminance increases in E-6 and E-7. The rate of increase of illuminance for an increase in diam-eter 2 N from 2.9 to 4.1 mm is 1.49 in E-6, and 1.66 in E-7,
which is the largest. The rate of increase of illuminance for an increase in diameter 2 N from 3.9 to 5.1 mm is
1.54 in E-6, which is the largest, and 1.11 in E-7. For the diameters 2 N of 2.9 mm, 3.1 mm, 3.9 mm, 4.1 mm, 5 mm,
and 5.1 mm, illuminance is higher in E-7 than in E-6. The rate of increase of illuminance from E-6 to E-7 is 1.69 when the diameter 2 N is 2.9 mm and 3 mm, 1.88 when
the diameter 2 N is 3.9 mm and 4 mm, which is the
larg-est, and 1.35 when the diameter 2 N is 5 mm and 5.1 mm.
Therefore, the illuminance is higher when the shape of the inside surface of the otoscope is a funnel rather than a bell. Moreover, by using the funnel type rather than the bell type, light with an illuminance of 1.35 to 1.88 times can be focused.
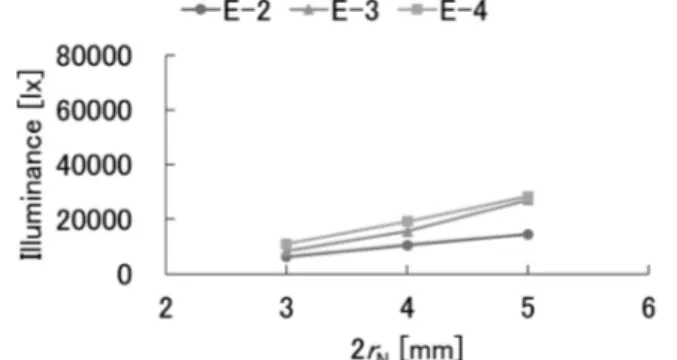
Figure 8 shows the comparison of illuminances for cases E-8, E-9, and E-10. As the distance increases from 127.1 to 257 mm, the illuminance decreases in E-8, E-9, and E-10. The rate of decrease of illuminance when the distance is increased from 127.1 to 197 mm is the same in all the three cases, i.e., 0.32. The rate of decrease of illuminance for an increase in the distance from 197 to 257 mm is 0.48 in E-8, 0.47 in E-9, and 0.47 in E-10, showing almost the same value in all three cases. For the distances of 127.1 mm, 197 mm, and 257 mm, illuminance is higher in E-9 than in E-8, and in E-10 than in E-9. The rate of increase of illuminance
from E-8 to E-9 is 1.49 when the distance is 127.1 mm, 1.48 when the distance is 197 mm, and 1.47 when the distance is 257 mm, showing almost the same value for the distances of 127.1 mm, 197 mm, and 257 mm. The rate of increase of illuminance from E-9 to E-10 is 1.54 when the distance is 127.1 mm, 1.57 when the distance is 197 mm, and 1.57 when the distance is 257 mm, showing almost the same value for the dis-tances of 127.1 mm, 197 mm, and 257 mm. Therefore, in the otoscope with a bell-shaped inside surface, when the diameter 2 N is large, the change in distance has a
significant effect on the increase in illuminance.
Figure 9 shows the comparison of illuminances for cases E-11, E-12, and E-13. As the distance increases from 127.1 to 257 mm, the illuminance decreases in E-11, E-12, and E-13. The rate of decrease of illuminance for an increase in distance from 127.1 to 197 mm is 0.35 in E-11, 0.34 in E-12, and 0.34 in E-13, showing almost the same value in all three cases. The rate of decrease of illuminance for an increase in distance from 197 to 257 mm is 0.48 in E-11, 0.47 in E-12, and 0.46 in E-13, showing almost the same value in all three cases. For the distances of 127.1 mm, 197 mm, and 257 mm, the illuminance is higher in E-12 than in E-11, and in E-13 than in E-12. The rate of increase of illuminance from E-11 to E-12 is 1.66 when the distance is 127.1 mm, 1.62 when the distance is 197 mm, and 1.6 when the dis-tance is 257 mm, showing almost the same value for all three cases. The rate of increase of illuminance from E-12 to E-13 is 1.11 when the distance is 127.1 mm, 1.11 when the distance is 197 mm, and 1.09 when the dis-tance is 257 mm, showing almost the same value for all three cases. Therefore, in an otoscope with a funnel-shaped inside surface, when the diameter 2 N is small,
the change in distance has a significant effect on the increase in illuminance.
Figure 10 shows the comparison of illuminances for cases E-9 and E-12. As the distance increases from 127.1 to 257 mm, the illuminance decreases in E-9 and E-12. The rate of decrease of illuminance for an increase in distance from 127.1 to 197 mm is 0.32 in E-9 and 0.34 in E-12, showing almost the same value for both cases. Figure 8 Comparison of illuminance in case that experimental
number is E-8, E-9 and E-10.
Figure 9 Comparison of illuminance in case that experimental number is E-11, E-12 and E-13.
Figure 7 Comparison of illuminance in case that experimental number is E-6 and E-7.
The rate of decrease of illuminance for an increase in distance from 197 to 257 mm is 0.47 in E-9 and 0.47 in E-12, showing almost the same value for both cases. For the distances of 127.1 mm, 197 mm, and 257 mm, the illuminance is higher in E-12 than in E-9. The rate of increase of illuminance from E-9 to E-12 is 1.88 when the distance is 127.1 mm, 2.04 when the distance is 197 mm, and 2.03 when the distance is 257 mm. It is the highest when the distance is 197 mm. Therefore, in otoscopes with a bell-shaped or funnel-shaped inside surface, when the distance is large, the change in the shape of the inside surface has a significant effect on the increase in illuminance.
Figure 11 shows the comparison of illuminances for cases E-14, E-15, and E-16. As the angle θ increases from 0 to 7.5 , the illuminance decreases in E-14, E-15, and E-16. The rate of decrease of illuminance for an increase in angle θ from 0 to 3.7 is 0.95 in E-14, 0.94 in E-15, and 0.95 in E-16, showing almost the same value in all three cases. The rate of decrease of illuminance for an increase in angle θ from 3.7 to 7.5 is 0.74 in E-14, 0.78 in E-15, and 0.84 in E-16, which is the highest. For angles θ of 0 , 3.7 and 7.5 , the illuminance is higher in E-15 than in E-14, and in E-16 than in E-15. The rate of increase of illuminance from E-14 to E-15 is 1.49 when the angle θ is 0 , 1.48 when the angle θ is 3.7 , and 1.56 when the angle θ is 7.5 , which is the highest. The rate of increase of illuminance from E-15 to E-16 is 1.54 when the angle θ is 0 , 1.56 when the angle θ is 3.7 , and 1.68
when the angle θ is 7.5 , which is the highest. There-fore, in otoscopes with a bell-shaped inside surface, when the diameter 2 N is large, the change in angle θ has a significant effect on the increase in illuminance.
Figure 12 shows the comparison of illuminances for cases E-17, E-18, and E-19. As the angle θ increases from 0 to 7.5 , the illuminance decreases in E-17, E-18, and E-19. The rate of decrease of illuminance for an increase in the angle θ from 0 to 3.7 is 0.85 in E-17, 0.9 in E-18, and 0.91 in E-19, which is the highest. The rate of decrease of illuminance for an increase in the angle
θ from 3.7 to 7.5 is 0.53 in E-17, 0.61 in E-18, and 0.65 in
E-19, which is the highest. For angles θ of 0 , 3.7 , and 7.5 , the illuminance is higher in E-18 than in E-17, and in E-19 than in E-18. The rate of increase of illuminance from E-17 to E-18 is 1.66 when the angle θ is 0 , 1.74 when the angle θ is 3.7 , and 2.01 when the angle θ is 7.5 , which is the highest. The rate of increase of illumi-nance from E-18 to E-19 is 1.11 when the angle θ is 0 , 1.12 when the angle θ is 3.7 , and 2.01 when the angle
θ is 7.5 , which is the highest. Therefore, in otoscopes
with a funnel-shaped inside surface, when the diameter 2 N is small, the change in the angle θ has a significant
effect on the increase in illuminance.
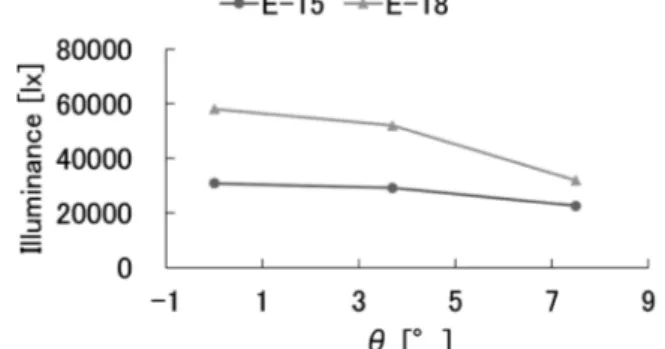
Figure 13 shows the comparison of illuminances for cases E-15 and E-18. As the angle θ increases from 0 to 7.5 , the illuminance decreases in both E-15 and E-18. The rate of decrease of illuminance for an increase in the angle θ from 0 to 3.7 is 0.94 in E-15, and 0.9 in Figure 10 Comparison of illuminance in case that
experimen-tal number is E-9 and E-12.
Figure 11 Comparison of illuminance in case that experimen-tal number is E-14, E-15 and E-16.
Figure 12 Comparison of illuminance in case that experimen-tal number is E-17, E-18 and E-19.
Figure 13 Comparison of illuminance in case that experimen-tal number is E-15 and E-18.
E-18, showing almost the same values in E-15 and E-18. The rate of decrease of illuminance for an increase in the angle θ from 3.7 to 7.5 is 0.78 in E-15, and 0.61 in E-18, and it is the largest in E-15. For angles θ of 0 , 3.7 and 7.5 , the illuminance is higher in E-18 than in E-15. The rate of increase of illuminance from E-15 to E-18 is 1.88 when the angle θ is 0 , which is the highest, 1.79 when the angle θ is 3.7 , and 1.42 when the angle
θ is 7.5 . Therefore, in otoscopes with a bell-shaped or
funnel-shaped inside surface, when the angle θ is small, the difference in the shape of the inside surface has a significant effect on the increase in illuminance.
3. Light focus optimization design 3.1 Design of otoscope
We designed a new otoscope which is optimal for light focus in headlights that use LED as their light source. To enhance the light focus performance, alu-minized gloss, which has a higher reflectance than chromed gloss, was chosen for the inside surface. For visible light, chrome plating has a reflectance of about 62 to 72% and aluminum has a reflectance of 90%. From the evaluation of the light focus performances of exist-ing otoscopes, the otoscope with a funnel-shaped inside surface was chosen as the one with the highest light focus performance with the angle θ set to 0 . In the de-sign, we considered the case where light enters the oto-scope from the wide mouth and reflects off the conical inner surface to reach the narrow mouth. As the wide mouth becomes larger for taking in more light into the otoscope and as more light gets reflected on the inner surface and reaches the narrow mouth, the light focus performance of the otoscope increases. If the light from the wide mouth gets reflected on the inside surface more frequently, it will be incident on the inside sur-face perpendicularly and will travel in the direction of the wide mouth without reaching the narrow mouth7).
Furthermore, the light incident on the edge of the wide mouth is reflected most on the inside surface7). Thus, for
the light that is incident on the edge of the wide mouth and gets reflected from the inside surface, length as well as diameters 2 W, and 2 N of the otoscope were
designed in such a way that the light traveling towards the narrow mouth does not turn towards the wide mouth before reaching the narrow mouth.
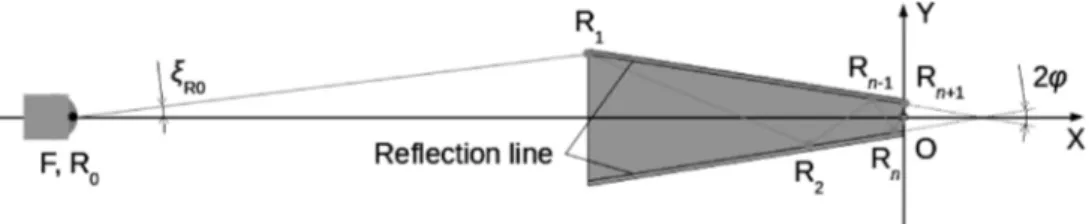
Figure 14 shows the method of how the otoscope
was designed. Since the shape of the otoscope is axi-symmetric with respect to the X-axis, it was designed on the X–Y plane. The coordinates on the X–Y plane are designated as ( , ). The inside surface where the light rays are reflected inside the otoscope was defined as the reflection line on the X–Y plane. The reflection line was set symmetrical to the X-axis in the second and third quadrants. The angle between the X-axis and the reflection line in the second quadrant or the angle between the X-axis and the reflection line in the third quadrant was designated as ϕ. Using the angle ϕ, the angle between the reflection line in the second quad-rant and the reflection line in the third quadquad-rant will be 2ϕ. Light is emitted from the focal point F of the head-light. The order in which the light rays are reflected by the reflection line is designated as . The order is assumed to be a natural number including 0. Let R be the reflection point of order . The reflection point R0,
whose order is 0, coincides with the focal point F. The coordinates of the reflection point R are designated as ( R, R ). At the reflection point R , the angle between
the X-axis and the reflected light ray is indicated as ξR .
In the design, the reflection point R1, whose order is
1, was set on the reflection line in the second quadrant. The variable is a natural number other than 0. The order , wherein light is reflected by the reflection line in the second quadrant, can be expressed as shown in Eq. (1), using the natural number .
− …
2 1: ( 1, 2,3, )
n m= m= (1)
The order in which light is reflected by the reflec-tion line in the third quadrant can be expressed as shown in Eq. (2), using the natural number .
… 2 : ( 1, 2, 3, )
n m m= = (2)
For the light reflected on the reflection point R1 at
the edge of the wide mouth, the order is sequen-tially increased from 1, and the angle ξR indicating the
direction of the light reflected at the reflection point R , and the coordinates ( R, R) are calculated. Fixing
the values of the length and diameter 2 N as well as
changing the value of diameter 2 W, the value at which
the diameter 2 W becomes the maximum is calculated.
In order to prevent the light traveling towards the narrow mouth from turning towards the wide mouth before reaching the narrow mouth, we considered two
reflection points R and R +1 across the origin O where
the narrow mouth is located. For the light reflected at the reflection points R and R +1, the condition for
finish-ing the calculation is as follows: (1) when the coordinate value R is 0 or less, the angle ξR indicates the
direc-tion of the narrow mouth; and (2) when the coordinate value R +1 is 0 or more, the angle ξR +1 indicates the
direction of the wide mouth.
In the calculation, angle ϕ is determined from the relationship between the length and the radii W and N. The Equation of the reflection line can be expressed
using the radius N and the obtained angle ϕ. The angle ξR0 is determined using the angle of the light
spread-ing at 12.8 from the focal point F of the Navis LED headlight used for measurement. The angle ξR can be
expressed using the angle ϕ and the obtained angle ξR0.
The coordinate values R1 and R1 can be expressed by
the length and radius W. The ray equation can be
expressed using the obtained angle ξR as well as the
coordinates R1 and R1. Using the reflection line
equa-tion and the ray equaequa-tion, the coordinates ( R , R ) of
the reflection point R are determined. The equations are shown below. The angle ϕ is obtained from the trigonometric relations. From the angle ϕ, length , and the value obtained by subtracting the radius N from
the radius W, Eq. (3) can be expressed.
tanφ=(r rW− N)/l (3)
In the Equation of the reflection line in the second quadrant, tan(ϕ) is considered as the slope and the radius N is regarded as the intercept. Thus, Eq. (4) can
be expressed using Eq. (3).
tan( ) N
y= −φ x r+ (4)
In the Equation of the reflection line in the third quadrant, tanϕ is considered as the slope and the radius N is regarded as the intercept. Thus, Eq. (5) can be
expressed using Eq. (3).
−
tan N
y= φx r (5)
Since light is specularly reflected at the reflection point R , the incident, and the reflected angles of light at the reflection point R are equal. Therefore, using Eqs. (1) and (3), the angle ξR in the second quadrant can
be expressed through Eq. (6).
Rn 2 R 1n
ξ = φ−ξ - (6)
Using Eqs. (2) and (3), the angle ξR in the third
quad-rant can be expressed through Eq. (7).
Rn 2 R 1n
ξ =− −φ ξ − (7)
The ray equation passes through the coordinates ( R , R) of the reflection point R , taking tanξR as the slope.
Using Eq. (6) when the reflection point R is in the sec-ond quadrant and Eq. (7) when the reflection point R is in the third quadrant, Eq. (8) can be expressed.
Rn R R R R1 R1 W
tan n tan n n: ( , )
y= ξ x y+ − ξ x x =−l y =r (8) It must be noted that the coordinate value R1 is the
length , and the coordinate value R1 is the radius W.
The condition for completing the calculation is that the angle ξR in the second quadrant must satisfy Eq. (9),
using the Eqs. (1), (6), and (7).
R R R 1 R 1 /2: ( 0) /2: ( 0) n n n n ξ π x ξ + −π x + > ≦ ≧ > (9)
The angle ξR in the third quadrant must satisfy Eq.
(10) using the Eqs. (2), (6), and (7).
R R R 1 R 1 /2: ( 0) /2: ( 0) n n n n ξ π x ξ + −π x + < ≦ ≦ > (10)
Table 3 shows the design calculation conditions for the otoscope. The light focus performance is compared with that of otoscope O-17, which is a funnel-type oto-scope with the highest light focusing ability, and hav-ing the diameter 2 N, the intermediate size among the
diameters of 2.9 mm, 4.1 mm, and 5.1 mm. The length and diameter 2 N conform to that of otoscope O-17. The
angle ξR0 is determined from the light spreading from
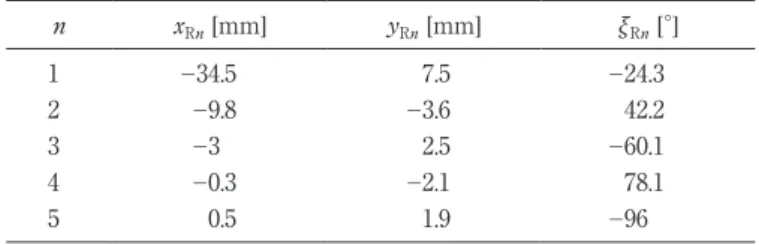
the Navis LED headlight used in the measurement. Table 4 shows the calculation results of the otoscope design. The coordinate values R and R and the angle
Table 3 Design calculation conditions of otoscope. [mm] 2N [mm] ξR0 [ ]
34.5 4.1 6.4
Table 4 Design calculation results of otoscope.
R [mm] R [mm] ξR [ ] 1 34.5 7.5 24.3 2 9.8 3.6 42.2 3 3 2.5 60.1 4 0.3 2.1 78.1 5 0.5 1.9 96
Table 5 Specifications of designed otoscopes. Object
number Object type Manufacturer name Surface shape conditionSurface [mm] 2 W [mm] 2 N [mm]
O-19 Otoscope — Funnel Aluminized gloss 34.5 13.2 4.1 O-20 Otoscope — Funnel Aluminized gloss 34.5 15 4.1
ξR are calculated for the order with values of 1 to 5.
For the order number of values 4 and 5, the condi-tion in Eq. (10) is satisfied. Table 5 shows the specifica-tions of the designed otoscope. For aluminized gloss, the Takahara Corporation s Biba mirror film was used. The Biba mirror film is a PET sheet with a thickness of 0.1 mm that is aluminum-deposited and coated with a 0.06 mm thick protective coating. In order to compare only the influence of aluminized gloss, the length , as well as the diameters 2 W and 2 N of object O-19, were
made the same as that of object O-17. For object O-20, the diameter 2 W was determined from the results of
the design calculation shown in Table 4.
3.2 Performance evaluation 3.2.1 Experimental method
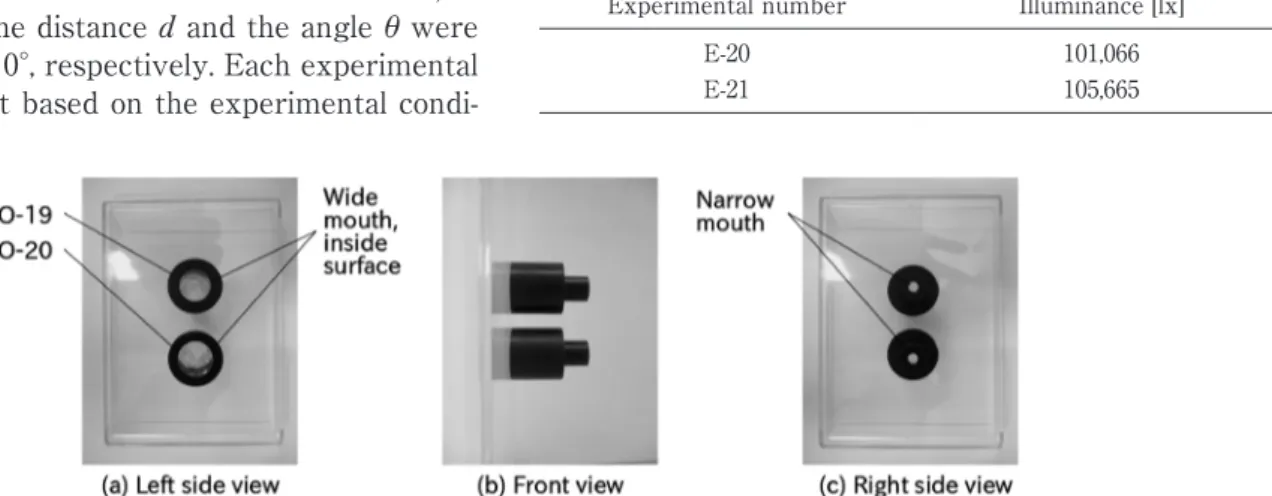
Using the designed results, we built an actual oto-scope. Thereafter, we evaluated the light focus perfor-mance of the otoscope we designed. We also built the experimental equipment using the existing otoscope, whose performance must be evaluated, and a headlight. Herein, we describe the experimental method for mea-suring the illuminance of the light at the narrow mouth of the otoscope using the constructed experimental equipment. Figure 15 shows the images of the designed otoscope. Figure 15 (a)–(c) show the left-side view, front view, and the right-side view, respectively. The images show the designed otoscopes of objects O-19 and O-20. The otoscopes were placed on a transparent board so that the wide mouth, inside surface condition, and the narrow mouth could be easily examined. Figure 15 (a) shows the wide mouth and the inside the surface of the designed otoscope, and (c) shows its narrow mouth. For the light focus performance evaluation, only the shape of the inside surface of the otoscope was con-structed. Table 6 shows the experimental conditions of the designed otoscope. The experimental number is indicated using serial numbers E-20 and E-21. Using the measured objects O-19 and O-20, the distance and the angle θ were set for the experiment. In order to compare with the illuminance of number O-17 in E-7, as shown in Table 2, the distance and the angle θ were set to 127.1 mm and 0 , respectively. Each experimental equipment was built based on the experimental
condi-tions shown in Table 6.
3.2.2 Experimental results
In the experiment using the experimental method, the light focus performance of the designed otoscope was evaluated using the measured illuminance. Table 7 shows the comparison of the illuminances for cases E-20 and E-21. The illuminance is higher in E-20 and E-21 than in object O-17 of E-7, as shown in Figure 7. The rate of increase of illuminance from O-17 of E-7, as shown in Figure 7, to E-20 is 1.74. The rate of increase of illuminance from E-20 to E-21 is 1.04. Thus, the otoscope that with an aluminized gloss inside surface has higher illuminance than the one with chromed gloss. More-over, by using aluminized gloss rather than chromed gloss, the light with an illuminance of 1.74 times can be focused. Further, from the order shown, as shown in Table 4, the maximum number of light reflections on the inside surface is 4. If the reflectance of aluminum is assumed to be about 90%, the attenuation of light due to reflection can be estimated to be about 0.6 at the maximum. Since the illuminance is higher in the designed otoscope with a diameter 2 W of 15 mm than
the existing one with a diameter of 13.2 mm, by setting the diameter 2 W to the designed 15 mm rather than
the existing 13.2 mm, light with illuminance of 1.04 times can be focused. From the experimental results shown in Table 7, the validity of the design of the new otoscope, which is optimal for light focus using a headlight that uses LED as its light source, is confirmed.
Figure 15 Images of designed otoscopes.
Table 6 Experimental conditions of designed otoscopes. Experimental
number numberObject [mm] θ [ ]
E-20 O-19 127.1 0
E-21 O-20 127.1 0
Table 7 Comparison of illuminance in case that experimental number is E-20 and E-21.
Experimental number Illuminance [lx]
E-20 101,066
4. Conclusion
In this paper, we evaluated the light focus perfor-mance of an existing otoscope using a headlight that uses LED as its light source. Furthermore, for head-lights using LED as their light source, we designed a new otoscope which is optimal for light focus and evalu-ated its light focus performance. The results obtained in this study are as follows:
1. In the existing otoscope, the illuminance increases as the diameter of the narrow mouth increases. By using an otoscope rather than a hole, light with an illumi-nance of 1.29 to 1.51 times can be focused. Regarding the condition of the inside surface, by using chromed matte for the inside surface rather than black, light with an illuminance of 1.33 to 1.88 times can be focused. Moreover, by using chromed gloss rather than chromed matte, light with an illuminance of 1.04 to 1.33 times can be focused. Even with the same chromed gloss, because of the difference between them, light with an illuminance of 1.44 to 1.7 times can be focused. By using the funnel-type inside surface in-stead of the bell-type, light with an illuminance of 1.35 to 1.88 times can be focused. As the distance between the focal point of the headlight and the narrow mouth as well as that between the angle between the central axis of the otoscope and the axis passing through the narrow mouth from the focal point of the headlight increase, the illuminance decreases.
2. Regarding the shape of the inside surface of the ex-isting otoscope, in the bell-type, when the diameter of the narrow mouth is large, the change in distance be-tween the focal point of the headlight and the narrow mouth, as well as the change in the angle between the central axis of the otoscope and the axis passing through the narrow mouth from the focal point of the headlight have a significant effect on the increase in illuminance. In the funnel-type otoscope, when the diameter of the narrow mouth is small, the change in the distance between the focal point of the headlight to the narrow mouth and the change in the angle between the central axis of the otoscope and the axis passing through the narrow mouth from the focal point of the headlight have a significant effect on the increase in illuminance. Comparing the bell-type and the funnel-type otoscopes, when the distance between the focal point of the headlight and the narrow mouth
is large and when the angle between the central axis of the otoscope and the axis passing through the nar-row mouth from the focal point of the headlight is small, the effect of the difference in shape of the inside surface on the increase in illuminance is significant. 3. In the designed otoscope, by using aluminized gloss
rather than chromed gloss for the inside surface, light with an illuminance of 1.74 times can be focused. By using the funnel-type inside surface and setting the diameter of the wide mouth to the designed 15 mm rather than the existing 13.2 mm, light with an illumi-nance of 1.04 times can be focused.
In this paper, we constructed an otoscope with an external shape that is not inserted into the ear solely for the purpose of evaluating the designed otoscope. The ultimate goals of this study are to construct an otoscope that doctors can use for actual otoscopic ex-amination and to evaluate the performance by having the doctors use the created otoscope. In the future, we will construct an otoscope that can be inserted into the ear and we will have the doctors evaluate its actual performance.
References
(1) Kaga, K.: Modern oto-rhino-laryngology, Nanzando, pp. 63–64 (2013).
(2) Hinoki, M.: Modern oto-rhino-laryngology, Kane-hara, pp. 159–163 (1983).
(3) Zusho, H.: Headlight using a fiber light source, Oto-Rhino-Laryngology Tokyo, 29-5, pp. 583–586 (1986).
(4) Otsuka, K., Nonaka, M. and Watanabe, S.: Success otolaryngology, Kanehara, pp. 21–23 (2017).
(5) Goto, F. and Yabe, H.: Customized catoptric head mirror with white LED and battery replacement, Oto-Rhino-Laryngology Tokyo, 49-3, pp. 142–144 (2006).
(6) Syouji, K. and Kojima, T.: Head Mirror Replace-ment, Practica Oto-Rhino-Laryngologica, 98-9, pp. 682–683 (2005).
(7) Onizuka, S.: Light funnel as a teaching mate-rial—A conical device for collecting or projecting light—, Journal of the Physics Education Society of Japan, 42-1, pp. 26–29 (1994).