The Development of Large-scale Farming During
a Period of Declining Rice Prices in Japan
著者
SASAKI Toru
journal or
publication title
The science reports of the Tohoku University.
7th series, Geography
volume
58
number
1/2
page range
39-57
year
2012-03
URL
http://hdl.handle.net/10097/60581
The Development of Large
-scale Farming During a Period of
Declining Rice Prices in Japan
Toru SASAKI*
Abstract The objective of this paper is to clarify the regional characteristics and pat-terns of formation for farmer households with high sales in Japanese agriculture. Toward this, using agricultural sales as the central axis, this paper examines the corre-lation between different sectors, regions, management structures, and size of cultivated areas. In particular, due to the rapid fall in the price of rice, the paper explores what survival patters have been taken by highly anticipated, large-scale farming
organiza-tions in the last 10 years, and the period for the investigation is from 1995 onwards.
Key words : declining rice prices, large-scale farming, diversified farming,
monocul-ture farming, Japanese agriculmonocul-ture
1. Introduction
One of the contemporary issues to be addressed by the Japanese Government’s agricul-tural policy is developing farmers to undertake agriculagricul-tural worker. Up to the current time, a consistent feature of the policies to achieve this has been of improving labor productivity with a focus on large-scale farming that prioritizes economic efficiency and the formation of farming
organizations, which in the long term will supply agricultural products at low prices. For example, in order to correct income disparities between agriculture and other industries, the Basic Agricultural Law of 1961 promoted an “economically viable farm1)” as an ideal image of
agricultural management, which helps achieve income parity with workers in other industries by implementing selective expansion and absorbing the excess agricultural population that would accompany economic growth. Then, the Basic Law on Food, Agriculture and Rural Areas (the New Basic Law) was established in 1999 to replace the Basic Agricultural Law. Positioning “efficient and stable management2)” as the type of farming to be promoted, this new
Law includes measures to promote and strengthen incorporations that were classified as busi-ness entities other than agricultural.
The current of research on the regional development of large-scale farming in terms of
sales and also on their current situation reflects that this group usually became the subject of research whenever the agriculture and forestry census is to be published (Takahashi et al.
* Faculty of economics, Sapporo Gakuin University, Ebetsu 069-855, Japan
1992 ; Usami 1997 ; Shogenji et al. 2002 ; Odagiri et al. 2008). It is because the current research primarily has investigated how farming was and was not achieved as an industry along with the expansion in scale of individual farms, which has been a high anticipation of structural policies. When looking at large-scale farming organizations up to the present time, then in the
majority of cases the research has proceeded by studying the scale of the farmland managed. However, in Japanese agriculture today there are a diverse range management types, and it is not the case that there is a situation in which only farmers managing large areas are undertak-ing farmundertak-ing work.
Here, through a discussion of levels of agricultural sales that starts from an understanding of how, since 1995, the slump in the price of rice has affected the development of farmer house-holds, this paper will attempt to clarify the formation pattern for large-scale farming (those
car-rying out the farming) and their contemporary situation. This investigation was carried out with 10 million yen set as the lower limit of agricultural sales to be included in the group that was investigated.
The paper was able to use of research by Usami, who used different levels of agricultural sales as indicators and who conducted a detailed analysis of trends among the large-scale
farm-ing in terms of sales (Usami 1980, 1987, 1995). Also, for the method of analysis used in this study, the paper referred to Usami’s research in order to ascertain the trends and the level of continuity in the data analyzed by Usami up to the 1990 census. In particular, the statistical processing used in this paper relies on Usami’s methodology. Also, it is recognized that while using agricultural sale levels for this paper had advantages, it also imposed limits. An advan-tage was that not only data for land-extensive agriculture, but also for labor intensive
agricul-ture and for the livestock sector could be ascertained using the same indicators. However, a limit of this method was that as the ranges for the levels of sales were fixed, regardless of the fact that the lower income boundary is different each year, then whatever their actual level of income, all farmers earning more than 10 million yen are placed within the same broad manage-ment group. In addition, because differences in agricultural income ratios for each level are not considered, farmers with different characteristics will still be bundled together in the top group of farmer households. Despite this limitation, however, it is thought that the methodol-ogy can still ascertain the main features of the situation.
The objective of this paper is to clarify the regional characteristics and patterns of forma-tion for farmer households with high sales in Japanese agriculture. Toward this, using agricul-tural sales as the central axis, this paper examines the correlation between different sectors, regions, management structures, and size of cultivated areas. In particular, due to the rapid fall in the price of rice, the paper explores what survival patters have been taken by highly anticipated, large-scale farming organizations in the last 10 years, and the period for the
2. The regional development of large-scale farming of more than 10 million yen
1) Setting of farmer households as the research subjects
First, the reason that farmers with agricultural sales of more than 10 million yen would be the subjects of the research shall be clarified. Table 1 shows changes in the lower income limit for full-time farm households. This lower income limit shows the level of income from
farm-ing that farmfarm-ing households need to earn to achieve income parity with other industries3). The
lower income limit increased from 5.63 million yen in 1994 to 6.26 million yen in 2005. In con-junction with this increase, the gross income required to secure the lower income level in 2005 rose to 28 million yen from rice production, 15 million yen from greenhouse horticulture, and more than 16 million yen from fruit orcharding. However, the totals for rice production and greenhouse horticulture in 1994 were 10.93 million yen and 10.19 million yen, respectively ; thus, is was possible to analyze and compare changes for farmer households earning more than 10 million. In 1994, field vegetable production and fruit orcharding did not reach the 10 million yen level, but if taking the agricultural sales total in the Agricultural Census to be about 70% of the actual sales total, then comparisons for these items may be possible. Therefore, farmers earning more than 10 million yen were analyzed as large-scale farming 4).
Also, when considering the scale of farming management, Table 1 shows that during this period, a further increase in scale was necessary in order for farmer households to reach the lower income limit. For example, reaching the level in 1994 would require rice production
equivalent to 5 ha to 10 ha, but this then increased to more than 15 ha in 2005. Greenhouse horticulture required a doubling in scale, from 5,000 m2 to 10,000 m2. Based on this, some
farmer households will not have been able to secure an income greater than the lower income limit. Accordingly, it is apparent that large-scale farming, which whatever their sector have
been able to increase the scale of the lower limit of sales from farming and secure a level of income on a par with other industries, have found themselves in an increasingly severe farming management environment in conjunction with the yearly rise in the analysis criteria. In this way, it is thought that an analysis of the extent to which farming households with high sales have been formed, which is the group on which policy makers have placed their hopes for the future of Japanese agriculture, provides an insight into those who will be responsible for agricul-ture in Japan in the fuagricul-ture.
2) Distribution of large-scale farming according to sector and region
Table 2 shows the regional distribution percentages of farmer households with agricultural sales of more than 10 million yen (subsequently, large-scale farming). The percentage data on
Table 1 The Change of the Lower Income Limit for Full-Time Farm Households
(ten thousand yen)
Year 1994 2000 2005 Income Limit 563 676 626 Estimated Gross Income Limit Rice Production 1,093 1,458 2,795 Greenhouse Horticulture 1,019 1,519 1,487
Field Vegetable Production 957 1,645 1,546
Fruit Orcharding 859 1,625 1,613
Dairy 1,948 2,715 2,885
Hog Raising 2,216 3,654 2,967
Cattle Fattening 1,822 3,596 3,421
Class close to an income limit and
its Income
Rice Production 5-10 ha 660 10 ha 882- 15 ha 720 -Greenhouse Horticulture 5,000 m 6712- 7,000 m 7572- 10,000 m 7472 -Open Field Vegetable Production 2 ha
- 759 5 ha
- 619 3
-5 ha
776 Fruit Orcharding (Apples in 1994) 2 ha 651- 3 ha 680- 3 ha 511
-Dairy 30-50 heads 790 30-50 heads 819 50-1,06580 heads Hog Raising 300 heads 518 - 500 heads 858 - 2,000 heads 302 - Source : MAFF
large-scale farming show that they were in the majority in Hokkaido in 2005 ─ that is, they
exceeded 50% of the total─ while in the total for all other prefectures the ratio increased from 3.8% to 6.1% in 2005. Looking at the data by region, the areas that were above the national average in 1995 were Kanto and Tosan at 5%, Tokai at 5.1%, Kyushu at 6%, and by 2005, this situation remained the same. However, while the above-mentioned regions that surpassed
the national average in 1995 increased their percentage of farmer households by 2005, the gains were small in Tohoku and Hokuriku, Kinki, and Chugoku. In other words, the table shows how the formation of large-scale farming was divided into developing regions and stagnating regions.
In addition, looking at the regional distribution ratios of large-scale farming, the item that
stands out is the change of position between Hokkaido and Kyushu. Despite the fact that over the 10-year period, the percentage of farmer households that had high sales in Hokkaido
remained over 50% in the percentages provided by each region, it has been overtaken by Kyushu. In addition, within the stagnation in some regions of the formation of large-scale
farming, in conjunction with their fall in the ranking in percentages according to region, Hokuriku, Chugoku, and Shikoku have become minority regions in terms of large-scale farming.
To summarize the distribution of large-scale farming in Japanese agriculture, approximately
70% are found within just four regions─ Hokkaido, Tohoku, Kanto Tosan, and Kyushu ─ and they have become concentrated in areas adjacent to national land.
Next, from Table 3 we can infer the characteristics of crop sectors from the percentages of
Table 2 The Distribution of Farm Households with Agricul-tural Sale of More than 10 million Yen
(%) Farm Households Farm Householdsby Region Fluctuation Rate
Year 95 00 05 95 00 05 95-05 Hokkaido 44.5 48.7 53.2 21.9 20.6 19.2 -23.2 Prefectures except Hokkaido 3.8 5.2 6.1 78.1 79.4 80.8 -9.1 Tohoku 3.0 3.4 4.3 10.2 9.9 11.0 -5.5 Hokuriku 2.1 2.3 2.7 3.4 3.0 3.1 -21.0 Kanto・Tosan 5.0 6.9 8.2 22.4 23.3 23.6 -7.4 Tokai 5.1 7.6 8.6 11.2 11.6 10.8 -15.0 Kinki 2.0 3.0 3.7 4.2 4.3 4.5 -5.6 Chugoku 1.4 1.9 2.0 3.1 2.8 2.5 -30.3 Shikoku 3.6 4.9 5.4 4.6 4.5 4.2 -18.4 Kyushu 6.0 8.4 10.1 18.6 19.5 20.6 -2.9 Okinawa 2.4 4.4 5.2 0.5 0.6 0.6 17.0
large-scale farming according to primary sector sales. In 2005, facility horticulture occupied
the top position nationwide, at 20.3% of total sales ; next was dairy, at 13.9% ; and then field vegetable production, also at 13.9%. Rice production, which has been considered to be the key crop for Japanese agriculture, was at 9.5%, a significant decline from 14.3% in 1995. More-over, in prefectures other than Hokkaido, the distribution ratios of rice production declined even further, to 7.4%, and it can no longer be said that rice is one of the main production crops for large-scale farming. The characteristics of the primary sector for large-scale farming
according to regional data are as follows : Hokkaido and Chugoku are the main producers of dairy (27.3%, 27.3%) ; Tohoku and Hokuriku of rice (22.4%, 39.6%) ; Kanto Tosan of field veg-etables (at 25.8%) ; Tokai, Shikoku, and Kyushu of facility horticulture (26.4%, 33.3%, 31.7%) ; and Kinki of fruit orcharding (28.6%). In addition, looking at the regional percent-ages according to sector, the table shows that 76% of rice production was carried out in Hok-kaido, Tohoku, and Hokuriku ; 61.8% of facility horticulture took place in Kanto Tosan and Kyushu ; and 50% of dairy was in Hokkaido and Tohoku. In conjunction with the regional dif-ferentiation, a split has emerged in the primary sector for large-scale farming between those
conducting farming using land and those using facilities.
The most noticeable changes since 1995 have been the further deepening of the downward trend in rice production and the growth of the intensive crop farming sector, such as vegetables.
Table 3 The Primary Sector of Large-Scale Farming of More than 10 Million Yen (in 2005)
(In Household) Total Rice Coarse cereals Potatoes Beans Indus-trial crop Open Field Horticul-ture Facility
Horticul-ture Fruits Flowers Dairy Cattle Poultry
Hokkaido 27,667 5,106 3,477 2,700 3,327 1,552 115 493 7,541 797 46 Tohoku 15,807 3,543 46 508 1,922 1,614 1,857 833 2,475 1,652 333 Hokuriku 4,441 1,760 32 270 424 347 203 451 434 160 41 Kanto・Tosan 34,066 1,440 498 812 8,794 8,640 2,160 3,182 4,177 1,234 473 Tokai 15,627 580 25 2,008 1,870 4,118 985 3,387 996 578 392 Kinki 6,458 372 6 479 624 1,001 1,847 769 684 263 212 Chugoku 3,535 207 0 131 386 476 447 298 966 298 129 Shikoku 6,112 60 355 144 859 2,033 758 672 465 275 202 Kyushu 29,679 615 672 4,472 1,886 9,409 2,138 2,470 2,273 3,073 1,169 Okinawa 886 12 5 271 13 32 24 300 64 98 23 Prefectures except Hokkaido 116,611 8,589 1,639 9,095 16,778 27,670 10,419 12,362 12,534 7,631 2,974 Nation 144,278 13,695 5,116 11,795 20,105 29,222 10,534 12,855 20,075 8,428 3,020 Prefectures except Hokkaido 100.0 7.4 1.4 7.8 14.4 23.7 8.9 10.6 10.7 6.5 2.6 Nation 100.0 9.5 3.5 8.2 13.9 20.3 7.3 8.9 13.9 5.8 2.1
Table 4 Change of Farm Households Selling More than 10 million Yen by Organizational Type Year Monoculturefarming Rice Semifarming ①-multiple farmingMultiple ② ①+②
monoculture primary typeRice as a
1995 62.9 12.2 25.2 - 12.0 37.1 Nation 2000 65.6 6.9 22.8 17.4 11.6 34.4 2005 66.6 6.2 21.5 16.6 12.0 33.4 1995 66.9 8.1 25.9 - 7.3 33.1 except Hokkaido 2000 70.8 4.7 22.6 10.8 6.6 29.2 2005 71.9 4.8 21.4 12.2 6.7 28.1 1995 48.6 32.3 22.6 - 28.8 51.4 Hokkaido 2000 45.4 20.3 23.6 41.8 31.0 54.6 2005 44.2 15.7 21.6 35.0 34.1 55.8 1995 56.2 38.8 33.3 - 10.4 43.8 Tohoku 2000 56.8 22.8 31.5 27.1 11.7 43.2 2005 59.4 18.3 29.5 27.3 11.1 40.6 1995 56.8 45.6 32.0 - 11.3 43.2 Hokuriku 2000 55.8 36.7 31.1 31.6 13.1 44.2 2005 56.2 43.8 30.7 34.4 13.1 43.8 1995 69.6 2.7 24.1 - 6.3 30.4 Kanto・Tosan 2000 73.2 1.6 21.1 7.5 5.6 26.8 2005 74.6 2.0 19.7 9.0 5.8 25.4 1995 76.2 2.1 19.4 - 4.4 23.8 Toukai 2000 79.4 1.8 16.5 5.8 4.1 20.6 2005 80.5 2.1 15.1 7.9 4.4 19.5 1995 69.5 6.5 22.8 - 7.7 30.5 Kinki 2000 74.1 4.0 20.1 9.4 5.8 25.9 2005 75.5 3.8 19.1 12.1 5.4 24.5 1995 68.6 7.0 24.7 - 6.7 31.4 Tyugoku 2000 72.3 4.2 21.8 8.3 5.9 27.7 2005 76.1 4.2 18.0 10.7 5.9 23.9 1995 73.6 1.1 20.8 - 5.6 26.4 Sikoku 2000 77.0 0.7 18.6 2.3 4.5 23.0 2005 79.0 0.3 17.1 2.7 3.9 21.0 1995 62.6 1.3 29.3 - 8.1 37.4 Kyusyu 2000 69.2 0.5 24.3 3.5 6.5 30.8 2005 69.8 0.5 23.4 3.7 6.8 30.2 1995 88.8 0.6 9.2 2.0 11.2 Okinawa 2000 91.6 0.4 7.7 4.4 0.7 8.4 2005 92.3 0.9 7.1 6.3 0.6 7.7
Specifically, while greenhouse horticulture is developing nationwide, regional differentiation is progressing for other sectors, with rice production dominant in East Japan and crop farming in West Japan, with the next important sectors being diary in East Japan and cattle and poultry farming in West Japan.
3) Composition of large-scale farming according to management type
As has been seen up to this point, changes occurring in the composition of large-scale
farming according to primary sector sales are not reflected in differences in the type of management. In order to confirm this point, the position of large-scale farming will be verified
by comparing this group to other groups. The first feature is that the percentage for monocul-ture farming trends consistently downwards as the sales total rises to the 7 to 10 million yen level, but it then starts to climb again from the 10 million yen level. It provides a very high percentage of the total for the 100 million yen and above level, of about 90%. The second fea-ture is that the percentage provided by diversified farming in total, which is the sum of semi
-multiple farming and diversified farming, rises up to the 7 to 10 million yen a year level, but after that it once again begins to decline. Also, looking solely at diversified farming, it pro-vides a high percentage of the total in the 15 to 50 million yen range, which suggests that large
-scale farming are shifting toward diversified farming.
With respect to this, when using Table 4 to confirm the regional characteristics of the shift by large-scale farming to diversified farming, then the following points become apparent. In
2005, the only regions where more than 30% of farmer households had shifted to diversified farming were Hokkaido, Tohoku, Hokuriku, and Kyushu. Within them, the regions with high percentages for semi-multiple farming with rice as the principal crop were Hokkaido, Tohoku,
and Hokuriku. In the secondary sector in Hokkaido, wheat, facility horticulture, and coarse cereals and potatoes constituted 70%, but from 2000 onwards only wheat showed any growth. In the secondary sector in Tohoku, facility horticulture, field vegetable production, cattle, and fruit orcharding constituted 70% ; within this percentage, diversified farming that includes cat-tle farming was the highest percentage for the entire country. In the secondary sector in Hokuriku, field vegetable production, greenhouse horticulture, and flowers constituted 56%. In Kyushu, the highest percentage was provided by semi-multiple farming of facility
horticul-ture, field vegetable production, and cattle, which were carried out by a majority of the farmer households. From this, it is possible to confirm in this region an orientation toward intensive farming among large-scale farming. However, the shift toward diversified farming has been
rapidly decelerating in Kyushu and instead, the prevailing trend has been toward intensive monoculture crop farming. In conjunction with the shift toward intensive farming, this shift toward monoculture farming among large-scale farming has progressed rapidly, moving from
Kanto toward West Japan. While in 1995 the percentage of the total provided by monoculture farming was around 70%, by 2005 it had grown to approximately 80%. In addition, the per-centage provided by rice monoculture farming had fallen to less than 5%. Further, the
best-selling sector other than rice in diversified farming also increased its percentage ; in particular, many large-scale farming were engaged in facility horticulture and field vegetable production,
which were the bestselling sectors.
4) The development structure of large-scale farming since the second half of the
1990’s
The features that can be seen in the above tables are mutually interconnected. That is to say, when considering the regional formation of large-scale farming, a situation characterized by
a stagnation trend in Hokkaido, Tohoku, and Hokuriku, and a development trend in Kanto and Kyushu, is considered to correspond to the decline of the economic position of rice production and the transition toward the intensive sector, such as greenhouse horticulture. As can be seen in the rate of change of large-scale farming in Table 2, this situation also corresponds with
the fact that, when excluding Tohoku, the number of large-scale farming in Hokkaido and
Hokuriku has been substantially decreasing. In contrast, the rate of decrease in Kanto and Kyushu has remained comparatively small. In Hokkaido, it is considered that land-extensive
farming has been developed of a kind that other prefectures are unable to carry out, such as grassland dairy farming and farming of wheat and soybean ; on the other hand, a dramatic decline has occurred in the number of farmer households in the region, as they are highly sus-ceptible to changes in profitability. In Tohoku, a significant decline in the number of large
-scale farming was not observed, which may be because the shift toward diversified farming was connected to its introduction into the intensive sector. With regards to this, while a small number of large-scale farming in Hokuriku have attempted to shift toward diversified farming,
as no changes have been observed in the rice-dependent structure, it may be considered that
the differentiation of farmer households was intensified by the slump in the price of rice. In Kyushu, where there has been a development of diversified farming, particularly in the inten-sive sector, it has changed positions with Hokkaido in terms of the formation of large-scale
farming.
In contrast to this trend toward diversified farming, a characteristic of large-scale farming
in Kanto and Tosan, Tokai, Kinki, Chugoku, and Shikoku is still one of an overwhelming prepon-derance of monoculture farmers of intensive or processing types. Even as a nationwide devel-opment, the prevailing trend among large-scale farming has been a shift toward monoculture
farming. For example, in Tokai, toward greenhouse horticulture and flowers ; in Kinki, toward fruit orcharding and flowers ; in Chugoku, toward dairy ; and in Shikoku, toward greenhouse horticulture and fruit orcharding. This shows that the development of large-scale farming has
been characterized by a change in direction, from diversified farming toward monoculture farm-ing.
3. The trend toward an enlarged scale of farmland among large-scale farming
1) The enlarged scale of large-scale farming and their position
The formation of large-scale farmer households has taken place due to the accumulation of
farmland into the hands large-scale farming, which in turn has occurred due to the ‘fluidization’
of farmland in land-extensive farming. While there have been differences in terms of
histori-cal background, this issue has been the central one for the Japanese Government’s agricultural policy in terms of finding successors to carry out agriculture in Japan. This was embodied in the Japanese Government’s efforts to realize a policy for structural reorganization that aimed to develop a production structure that is able to compete in the severe domestic and foreign agri-cultural environment which emerged in the second half of the 1990’s. This trend was charac-terized by such developments as the liberalization of agricultural produce, which was advanced under the framework created within the WTO mechanism, and also the competitive prices of agricultural imports.
But, to what extent has this policy direction been actually realized ? Looking at nation-wide trends, the percentage of farmer households of a size greater than 5 ha grew marginally, from 1.1% in 1995 to 2.6% in 2005. However, their share of the total area of farmland rose more substantially, from 8.9% to 16.4%, meaning the extent to which farmland was accumulated in the hands of farmer households of a size greater than 5 ha had increased. Regional trends in the accumulation of farmland into this group were as follows ; in Tohoku, the percentage increased from 15.7% to 24.5% ; in Hokuriku, from 9.2% to 17% ; in Kanto and Tosan, from 6.8% to 14.2% ; and in Kyushu from 7.5% to 15.8%. In other words, it is reasonable to say that in this 10 year period, the increase in the percentage of farmland held by this group indi-cates that, to some degree, the shift toward large-scale farming had progressed. But during
the same period, the total area of cultivated farmland decreased by 670,000 ha (16.3%), while the area of land abandoned and no longer cultivated increased by more than 20,000 ha. This suggests that one characteristic of the process by which farmland was being accumulated in the hands of large-scale farming was that its advance was overlapping with a reduction in the total
area of farmland in use.
Table 5 shows the extent to which large-scale farming constituted the farmer households
that were enlarging in scale. The percentage of the total area of cultivated farmland held by large-scale farming increased from 26% in 1995 to 36% in 2005. Looking at the data per
region, in Kanto Tosan it grew to 21.2% and in Kyushu to 24.3%, and the accumulation of farm-land into the hands of certain farmer households was advancing in those regions where the for-mation of large-scale farming had progressed. Further, between 1995 to 2005, the percentage
of large-scale farming that were greater than 5 ha in size in all prefectures increased from 17%
to 20% ; in contrast, however, during the same period it fell by 23% in Hokkaido. In particu-lar, despite that fact that its percentage of large-scale farming was a high 70%, within the
solely provided by those households with more than 15 ha and the rate actually declined for those with 5 ha to 10 ha, to 58%, and those with 10 ha to 15 ha, to 68%.
When considering the regional tends among farmer households that have enlarged their scale of cultivated farmland since 1995, we can present the data as follows. In Hokkaido, in conjunction with the decline in large-scale farming, the pace of the transition toward large-scale
farmland has also slowed. In Tohoku and Hokuriku, the percentage of large-scale farming of a
size greater than 5 ha was a high 50%, but the pace of the increase has stagnated. This trend is particularly prevalent in Tohoku and the formation pattern here of large-scale farming
sug-gests that the development of diversified farming has been following a course of an expansion of managed farmland contained within the region.
A feature of each of Kanto Tosan, Tokai, and Kinki, is that while the percentages of house-holds with more than 5 ha tier has been predominately trending upwards, the increase among the group of a size greater than 15 ha has been particularly prominent. In addition, in each of these regions, this group constituted less than 20% of large-scale farming ; however, when
looking solely at the percentage for farmer households with over 10 ha, the regional gap between these regions and Tohoku shrunk. Based on this, it is apparent that while households with more than 5 ha still constituted a minority of large-scale farming in these regions, their
formation was connected to the expansion of cultivated farmland (the situation in Hokuriku was similar on this point).
Table 5 The Trend of Scale Enlargement for Farm Households Selling More than 10 million Yen (2005) (In Household, Percentage) Farm Households Selling More than 10 million Yen (A) 5 ha~ (B) (A)’s share of cultivated farmland (B)/(A) 1995 to 2005 rate of (B)’s Fluctuation 5~ 10 ha ~15 ha 15 ha~10 Hokkaido 37,300 26,219 2,486 3,803 19,930 84.3 70.3 -23.5 Tohoku 15,807 7,936 4,437 1,882 1,617 16.0 50.2 -1.6 Hokuriku 4,441 2,276 1,291 553 432 12.8 51.2 2.4 Kanto・Tosan 34,066 5,592 3,955 968 669 21.2 16.4 40.0 Tokai 15,627 1,270 716 221 333 21.8 8.1 39.9 Kinki 6,458 649 332 131 186 11.6 10.0 20.6 Chugoku 3,535 699 420 145 134 7.6 19.8 5.3 Shikoku 6,112 233 183 33 17 10.9 3.8 56.4 Kyushu 29,679 5,333 4,333 706 294 24.3 18.0 59.4 Prefectures except Hokkaido 116,611 24,228 15,839 4,675 3,714 17.4 20.8 20.8 Nation 144,278 50,447 18,325 8,478 23,644 36.2 35.0 -7.1
In Kyushu, these households constituted 18% of large-scale farming, but the rate of
increase from 1995, of 59%, was the highest of any region. The rate of increase in the 5 ha to 10 ha tier was particularly high and it overtook Kanto Tosan in the nationwide ranking and drew close to Tohoku. Also, the rate of increase was high for the farmer households of a size greater than 10 ha, but not that high for those over 15 ha. Therefore, judging from the previ-ously-seen advance of the intensive sector within the crop sector, the formation of large-scale
farming was characterized by the enlargement of scale in conjunction with an acceleration of the transition toward diversified farming.
2) The enlargement of scale and shift to diversified farming for large-area farmland
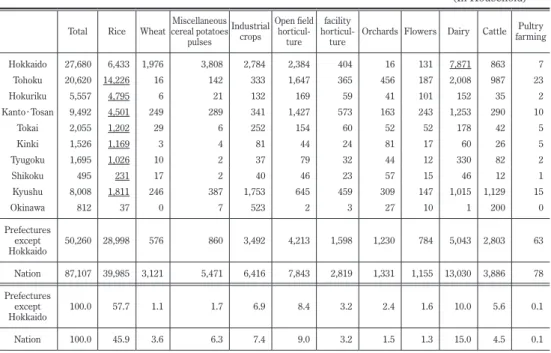
Next, based on the data in Table 6 on the best selling sectors among farmer households of a size greater than 5 ha, the management types of these large-area farms will be considered.
This is limited by the fact that the data includes farmer households of more than 5 ha that do not fall into the large-scale farming group, but it is considered that it can capture the overall
trend. Nationwide, the best seller sector is rice production at 45.9%, followed by dairy at 15%. Also, the regions where the percentage obtained by rice production exceeded the national aver-age were Tohoku (69%), Hokuriku (86%), Kanto Tosan (47.7%), Tokai (58%), Kinki (76%), Chu-goku (60%), and Shikoku (46.7). From the table, it is apparent that in practically all regions
Table 6 Households with the Size of More than 5 ha by Best Selling Sector
(In Household)
Total Rice Wheatcereal potatoes Miscellaneous pulses Industrial crops Open field horticul-ture facility
horticul-ture Orchards Flowers Dairy Cattle Pultry farming Hokkaido 27,680 6,433 1,976 3,808 2,784 2,384 404 16 131 7,871 863 7 Tohoku 20,620 14,226 16 142 333 1,647 365 456 187 2,008 987 23 Hokuriku 5,557 4,795 6 21 132 169 59 41 101 152 35 2 Kanto・Tosan 9,492 4,501 249 289 341 1,427 573 163 243 1,253 290 10 Tokai 2,055 1,202 29 6 252 154 60 52 52 178 42 5 Kinki 1,526 1,169 3 4 81 44 24 81 17 60 26 5 Tyugoku 1,695 1,026 10 2 37 79 32 44 12 330 82 2 Shikoku 495 231 17 2 40 46 23 57 15 46 12 1 Kyushu 8,008 1,811 246 387 1,753 645 459 309 147 1,015 1,129 15 Okinawa 812 37 0 7 523 2 3 27 10 1 200 0 Prefectures except Hokkaido 50,260 28,998 576 860 3,492 4,213 1,598 1,230 784 5,043 2,803 63 Nation 87,107 39,985 3,121 5,471 6,416 7,843 2,819 1,331 1,155 13,030 3,886 78 Prefectures except Hokkaido 100.0 57.7 1.1 1.7 6.9 8.4 3.2 2.4 1.6 10.0 5.6 0.1 Nation 100.0 45.9 3.6 6.3 7.4 9.0 3.2 1.5 1.3 15.0 4.5 0.1
rice is the primary crop for cultivated farmlands that have enlarged their scale. In Hokkaido, the best seller sectors were dairy (28.4%) ; rice production (23.2%) ; then miscellaneous cere-als, potatoes, and pulses (13.8%), which shows that this region has been utilizing its vast tracks
Table 7 The Transition Trend of Rice-Producing Farm Households to Diversified Farming (5 ha~)
Year Rice monoculture5 years later (in Household) The transition to diversified farming (In Household) The transition to diversified farming (%) Prefectures except Hokkaido 90~95 10,250 1,420 12.1 95~00 13,724 3,415 19.8 00~05 15,599 2,961 15.8 Hokkaido (10~30 ha) 90~95 1,924 475 19.7 95~00 2,731 1,579 36.0 00~05 2,078 1,100 33.9 Tohoku 90~95 6,197 881 12.4 95~00 7,717 1,711 18.0 00~05 8,236 1,513 15.4 Hokuriku 90~95 2,136 181 7.8 95~00 2,837 394 12.1 00~05 3,339 343 9.2 Kanto Tosan 90~95 868 194 18.1 95~00 1,334 629 31.8 00~05 1,792 437 19.4 Tokai 90~95 295 40 11.7 95~00 484 154 23.9 00~05 569 152 20.8 Kinki 90~95 364 31 7.7 95~00 546 180 24.6 00~05 606 178 22.4 Chugoku 90~95 218 30 11.9 95~00 411 88 17.4 00~05 593 88 12.6 Shikoku 90~95 19 1 4.5 95~00 65 18 21.1 00~05 77 31 26.9 Kyushu 90~95 149 59 27.5 95~00 325 233 41.0 00~05 378 213 35.0
of land to develop the type of land-extensive farming that cannot be realized in the prefectures.
In Kyushu, the best selling sectors were rice production (22.6%), industrial crops (21.9%), and cattle (14.1%), and based on this, the presence of farming groups engaged in crop and livestock farming can be confirmed.
Next, Table 7 shows the formation of large-scale farming that can be discerned from the
relationship between the enlargement of scale and shift to diversified farming. The nationwide shift to diversified farming advanced significantly from 1990 to 2000. In particular, looking at the regional data on farmer households that moved to diversified farming between 1995 to 2000, the regional percentages increased in the following order ; Shikoku, Kinki, Hokuriku, Tokai, Chugoku, Tohoku, Kanto Tosan, Hokkaido, and Kyushu. This trend continued between 1995 and 2000, with the number of farmer households shifting to diversified farming increasing in Shikoku and Kinki. However, from 2000 to 2005, the nationwide shift to diversified farming began to stagnate. It is speculated that during this period, the impact of the decrease in farmer households that support diversified farming, which was due to the further development of an aging population and an absolute shortage of labor, was particularly strongly felt. Also, com-pared to the dynamics of the situation from 1990 to 1995, during this later period the number of farmer households moving to diversified farming increased but within an overall decline in the number of farmer households, meaning it formed a secondary trend within the main trend. But even in the following five years, excluding Hokkaido the number of farmer households engaged in monoculture farming trended upwards and within farmer households that have been enlarging their scale, the prevailing trend has been a transition toward monoculture farming.
4. Formation pattern and forms of large-scale farming
1) Formation pattern of large-scale farming
Next, let us investigate the trends in the development of large-scale farming and their
management of large area farmland up to the present time. In conjunction with this, this sec-tion also explores the formasec-tion pattern of large-scale farming from the second half of the
1990s.
Hokkaido typified the following pattern : a decrease in the formation of large-scale
farm-ing in land-extensive farming and a slowing down of the pace of the shift toward large-area
farming. As pointed out by Higashiyama (2008), due to the slump in the price of rice, the amount being demanded for land rental did not match up with the amount that the farmers were able to pay. In particular, amid the slowdown in the shift to other sectors and to diversified farming due to the low levels of profits, the situation was one in which the only progression made was the decline of large-scale farming. In Hokkaido, which had a high percentage of
semi-multiple farming households with rice as the best selling crop, through the development
of land-extensive farming that combined wheat, miscellaneous cereals and potatoes, the
sensitive to price fluctuations, its nationwide position in terms of percentages of large-scale
farming has been taken by Kanto Tosan, and it will surrender its position to Kyushu.
Amid a situation of slow rate of decline of farmer households and the relatively wide dis-persion of farmer households of a size greater than 5 ha, Tohoku typified the following pattern : a transition toward diversified farming that traces an expansion path that is contained within the region, with rice production as the keynote sector. Also, in Tohoku there were many large-scale farming that had rice production as their best selling sector, but a
characteris-tic of this region was its constant level of expansion in rice production, which was connected to the shift to diversified farming for the intensive sectors of facility horticulture, field vegetable production, cattle, fruit orcharding. On a nationwide level, it overtook Tokai to capture fourth place in the percentages ranking of farmer household with high sales. However, because of the large number of farmer households that were dependant on rice production, the decline in the price of rice caused the pace of the scale enlargement to slow down, and instead transitions started to appear in the direction of diversified farming and monoculture farming.
Through specializing in the labor-intensive sector such as greenhouse horticulture,
regions such as Kanto Tosan have seen the formation of large-scale farming that are engaged in
monoculture farming. The shift toward monoculture farming is a nationwide trend, but a char-acteristic of these types of large-scale farming is their withdrawal from rice production and
spe-cialization in other sectors. This trend was occurring even before 1995, and even if these households planned to shift to diversified farming, in the majority of cases the shift was com-bined with farming of crops other than rice. Through this sort of development centered on the labor-intensive sector, this region came to occupy top position for all regions in terms of the
percentage of large-scale farming.
While in strictly numerical terms their numbers were not that high, in Tokai, Hokuriku, and West Japan, a formation pattern could be seen of an expansion in scale of cultivated land in conjunction with an accelerated pace of rising large-area farmer households. The formation of
large-scale, leased-land households could be widely seen in Tokai and Kinki and their
percent-ages of leased land of total land managed by farmer households of a size greater than 5 ha were 77% and 79% respectively, which significantly surpassed the 42% in Tohoku. The position occupied by large-scale farming was not all that high, but as the price of rice slumped, it can be
said that this group grew rapidly out of farmer households that withdrew from rice production while accumulating farmland and from farmer households specializing in monoculture farming. In contrast, in Chugoku and Shikoku since 1995, the rate of decline in farmer household num-bers and the area of farming land has been fairly high compared to the rest of the country, and while it is difficult to ascertain the trend taken by the formation of large-scale farming in this
region, it does show a formation pattern similar to Kinki.
Kyushu typifies a formation pattern for large-scale farming of the following type : an
accel-eration in the scale enlargement of farmer households that do not depend on rice production in tandem with a shift to diversified farming. In addition to the labor-intensive sectors of
green-house horticulture, fruit orcharding, and flowers, large-scale farming in the primary sector were
increasingly engaged in process farming, such as dairy and poultry. During these ten years, a movement that occurred across these sectors was a 50% reduction in rice production. In con-junction with this, there was an increase in monoculture farming in the livestock sector, while the shift to diversified farming in the labor-intensive sector also progressed. The crop sector,
such as industrial crops, grew in scale, while the percentage of large-scale farming of a size
greater than 5 ha also increased by 60%. This increase in the number of large-scale farming
demanded that the impact of the slump in the price of rice be relatively small. As a result, among all regions in the country, it provided the second highest percentage of large-scale
farm-ing after Kanto Tosan.
2) Changes in market conditions for agricultural produce
Since the second half of the 1990s, the main condition determining the formation pattern for large-scale farming has been the fluctuation in the market prices of agricultural products.
In Figure 1, 1985 is set as the base year with a value of 100 and the figure shows as index val-ues the price fluctuations for agricultural produce up to 2007 ; from this data, trends and char-acteristics caused by price fluctuations can be inferred. The reason why 1985 was set as the base year was that expenditure on agricultural products peaked during this period.
The price of rice declined constantly from 1985 onwards, excluding 1993 and 2003 when prices were affected by damage caused by bad weather. Prices in the chicken egg sector also
Figure 1 Change of Index number of price in agricultural product (1985-2007)
Source : Statistics of Agricultural Commodity Price Indices
図1 佐々木達
Figure 1 Change of Index number of price in agricultural product(1985-2007) Source: Statistics of Agricultural Commodity Price Indices
50 60 70 80 90 100 110 120 130 140 150 1985 1990 1995 2000 2005 rice vegetables fruits Hen eggs Raw milk meat
trended in a similar manner, but the difference was that in the case or rice, the lowest price was recorded after 2005 and during this period the price slumped to an index value of just 60 toward 1985. In particular, the pace of the price decline noticeably accelerated following the abolition of the Staple Food Control Law, and this suggests a reason for the stagnation or decline in the number of large-scale farming in Hokkaido, Tohoku, and Hokuriku that at this time were
attempting to enlarge their scale of rice production.
Moreover, in the case of Hokkaido in 1995, the reason why the percentage of large-scale
farming engaged in rice production in the primary sector had changed position with dairy by 2005, was that despite the fact that the price of milk also trended at a low level, the decline of the economic position of rice was a direct blow to large-scale farming. Similarly, while
live-stock prices also trended downwards, this was against the background of such factors as the BSE problem and from 2000 onwards, it began to rise once again. This points to a reason for the increase in Tohoku and Kyushu in the percentage of large-scale farming in the primary
sec-tor engaged in cattle.
While the prices of vegetables and fruit continued to rapidly fluctuate, overall they remained high. For example, the average index value for vegetables was 117 and at no time did it fall below the 1985 value. This was the backdrop to the situation in which large-scale
farming throughout the country was induced to enter the labor-intensive sector. Specifically,
it relates to the creation of a formation pattern characterized by a shift to monoculture farming in the intensive sector in Kanto Tosan and a shift to diversified farming by farmer households of a size greater than 5 ha in Tohoku and Kyushu. In this way, the formation pattern of large
-scale farming resulted in the labor-intensive sector coming to occupy an overwhelming
domi-nant position. These were the types of conditions present in the markets for agricultural prod-ucts.
5. Conclusion
The formation of large-scale farming from the second half of the 1990s further
strength-ened the overall system of liberalization for agricultural products, and the role played by the conventional policy of price maintenance was drastically reduced, with price formation being left to the market mechanism. This situation was created out of a process deeply connected to economic globalization. In particular, the rapid fall in the price of rice that followed the aboli-tion of the Staple Food Control Law caused the posiaboli-tion of rice producaboli-tion to significantly decline among large-scale farming. However, this effect was not evenly felt ; instead, the
sit-uation today is that each region is searching out its own path to take.
Within this sort of situation, 70% of all large-scale farming are found in just 4 regions─
Hokkaido, Tohoku, Kanto Tosan, and Kyushu─ and they have become concentrated in areas adjacent to national land. Moreover, there has also been a development of regional differentia-tion of farming among large-scale farming. In the primary sector, Hokkaido and Tohoku alone
provide 60% of the total rice production ; Kanto Tosan and Kyushu provide 60% of facility horticulture ; while Hokkaido and Tohoku provide 50% of dairy. In conjunction with the annual increase in regional differentiation, a split has emerged between farmer households engaged in land-extensive farming and those conducting facilities farming.
In the formation of large-scale farming, the development of large-scale rice production,
which up until recently had been the most important sector in large-scale farming in Japanese
agriculture, has stagnated. Hokkaido was strongly affected by the fall in the price of rice and the surviving large-scale farming in this region have been forced to further enlarge their scale.
The main movement among large-scale farming in Tohoku has been to enlarge the scale of their
rice production, but the prevailing trend has become a transition to diversified farming that combines the intensive sector and livestock sector. The decline of rice production has been a relative one in relation to the labor-intensive sector, and even now, it remains the most
impor-tance sector for the development of large-scale farming. An increase in the percentages of
large-scale farming in Kanto Tosan and Kyushu is evidence of this. However, even these
increases have been declining in absolute terms in the crop sector, which economically is able to generate profits, and they were created only with an extremely narrow range of conditions required for the increase to stably occur, which is why an overwhelming number of farmer households have come to be engaged in monoculture farming.
The total amount of resources held by Japanese agriculture has decreased sharply and the increase in large-scale farming as a percentage of total households needs to be seen within the
context of a trend toward further downsizing and reorganization. While limited by changes in the restricting conditions, the evaluation of the current situation for large-scale farming is that
ultimately they have aimed to pursue a path for their own farming development. However, as has been seen in Hokkaido, those regions that were able to rapidly realize large-scale farming
are precisely where the transition toward large-scale farming have stagnated. This tells a
story of a reality in which it is difficult to see much prospects for the future of Japan’s agricul-tural structure.
Notes
1) “Economically viable farms” refers to those farming households that, in a comparison between farmer households and worker households in towns and villages with a similar living environment, earn an amount from farming per household member above the average level of these worker incomes. It assumes a modern, small, family-run farm of a scale that can be entirely managed by two to three
agri-cultural workers (husband, wife, son, etc.) and when the concept was formed in 1961, the plan was intended to promote the creation of 2,500,000 farming households with an average size of 2 ha. 2) “Efficient and stable management” refers to “the promotion of efficient and stable farm management
and by establishing a farming structure in which these farm households are able to undertake an equivalent amount of agricultural production, to develop a highly productive farming structure.” The plan set a target in which the annual working hours and income of the persons who were to mainly carry out the farming work would be equivalent to the levels for workers in other industries (a target
of 8 million yen to 10 million yen a year).
3) Because the method of totaling statistics differed in 1994, 2000, and 2005, direct comparisons were impossible, while 1994 was the final year it was possible to ascertain statistical data on viable farms and so subsequent data lacks statistical continuity. Also, the goal set for the economically viable farms concept within the fundamental law for agricultural policy was to realize income parity with other industries, but today the policy focus has shifted from farmer households to the unit of farming management. However, as it still has the same goal of achieving income parity with other industries, the same method of calculation was used to calculate the lower income limit of the viable unit and based on this data, the yearly totals were compared.
4) Regarding the lower gross income limit in 2005, as it significantly increased in every sector, it is important to be aware that the grouping of farmer households into the 10 million yen or more tier may result in the total shown being excessive.
References
Higashiyama, K. (2008) : Restructuring of land-extensive farming and agriculture in Hokkaido. Rural
Issues Association of Japan edition, in Land ownership and use in regional farming and the current use
and ownership of farmland. Tsukuba-shobo, 71-79, 2008.
Odagiri, T. (2008) : Agricultural in Japan, Agricultural Census Analysis, 2005. AAFS.
Shogenji, S. (2002) : The fundamental structure of Japanese agriculture in the 21st century ; the Agricultural Census Analysis, 2000. AAFS.
Takahashi, M., ed. (1992) : The development structure of Japanese agriculture ; the world agriculture and forestry census analysis, 1990. AAFS.
Usami, S. (1982) : The Presence and structure of upper and lower tiers─1980 census analysis. : Isobe,Toshihiko, Kubotani, Junji. Ed. 1980 Census ; Structural Analysis of Japan’s Agriculture. AAFS.
Usami, S. (1987) : Trends in Agricultural Sales in Farmer households with high sales. Agriculture and
agri-cultural administration under the basic law for agriagri-cultural administration and future issue ; an Interim Report : The Agricultural Policy Research Committee.
Usami, S. (1995) : Current structure of large-scale farm management. Ino, Ryuichi ; Tomishige,
Kenichi ; Shuzo, Teruoka, Mitsushige, Miyamura, ed. in Contemporary capitalism and food and
agriculture. Otsukishoten, 77-122.