Book-tax conformity, earnings management, and
compensation contracts
著者
WONG YIU WAI
journal or
publication title
TMARG Discussion Papers
number
140
page range
1-29
year
2020-09-09
TOHOKU MANAGEMENT
&
ACCOUNTING RESEARCH GROUP
Discussion Paper
Discussion Paper No. 140
Book-tax conformity, earnings management, and compensation contracts
WONG YIU WAI
2020/9/9
GRADUATE SCHOOL OF ECONOMICS AND
MANAGEMENT TOHOKU UNIVERSITY
27-1 KAWAUCHI, AOBA-KU, SENDAI,
980-8576 JAPAN
Book-tax conformity, earnings management, and compensation contracts
Yiu Wai Wong
Assistant Professor of Graduate School of Economics and Management, Tohoku University, Sendai, Japan
Tel./Fax: +81 3 6869 3195 Email: [email protected]
Abstract
This study investigates how the degree of book-tax conformity affects managers’ compensation contracts and earnings management activity. The arguments for and against requiring book-tax conformity have been discussed in many countries for many years. There are several empirical studies about the effects of book-tax conformity on the usefulness of accounting earnings, but the existing literature on the impact of book-tax conformity on earnings management presents ambiguous results. Further, there are few studies that have examined the relationship between the degree of book-tax conformity and managers’ compensation contracts. This study focuses on this research gap. In this result, I set multi-task principal-agent model in theoretical part and OLS in empirical part to analysis the relationship between book tax conformity and earnings management. The results showed that the bonus coefficient decreases with the degree of book-tax conformity, demonstrating that book-tax conformity can indirectly affect compensation contracts. The main findings of the study are as follows: book-tax conformity prevents managers from engaging in earnings management activity as well as some production activities; and the expected utility of the principal decreases with the degree of book-tax conformity. that the results of this study can provide policy makers with information on the determine of the book tax conformity system.
Keywords: Book-tax conformity, earnings management, CEO compensation, principal-agency theory, multi-task model
Declarations
Funding (information that explains whether and by whom the research was supported): This work was supported by the Grant-in-Aid for Young Scientists (B), 17K13818, 2017-2019, provided by the Japan Society for the Promotion of Science, Japan.
Acknowledgements: This work was supported by the Grant-in-Aid for Young Scientists (B), 17K13818, 2017-2019, provided by the Japan Society for the Promotion of Science, Japan.
1
Book-tax conformity, earnings management, and compensation contracts
1. Introduction
This paper investigates how the degree of book-tax conformity affects managers’ compensation contracts and earnings management activities. According to OECD, there is the widespread perception that “the rules for the taxation of cross-border activities are regularly broken, and that taxes are paid only by the naive. Multinational enterprises (MNEs) stand accused of dodging taxes all around the world.”1 Many MNEs, including Google, Apple, Facebook, and Amazon (sometimes known as GAFA), take advantage of the different rules of taxation between countries. For example, there are two prevailing tax reporting systems. The first requires book-tax conformity, and the other allows taxable income to be different from reported accounting earnings. Book-tax conformity is required in Japan, but not in the United States. In addition, in order to calculate tax income in the EU, some member states use International Financial Reporting Standards (IFRS), some use Local Generally Accepted Accounting Principles (GAAP), and others use a separate tax GAAP. The arguments for and against requiring book-tax conformity have been discussed in many countries for many years. However, there are few studies that have examined the relationship between the degree of book-tax conformity and managers’ compensation contracts and earnings management activities. This study expands upon the current research on book-tax conformity to address this gap.
Proponents of book-tax conformity insist that increases in conformity can reduce aggressive financial reporting and excessive tax planning, and, as a result, improve the earnings quality and strengthen tax compliance. It is argued that increased conformity leads to a considerably simpler tax system that would constrain managers' opportunism (Slemrod and Blumenthal 1996; Yin 2001; Desai 2005; Whitaker 2005). Desai (2005) argues that low book-tax conformity has contributed to the simultaneous degradation of profit reporting to capital markets and tax authorities because it allows managers to mischaracterize tax savings to capital markets, and
mischaracterize profits to tax authorities.
On the other hand, opponents of book-tax conformity claim that it impairs earnings quality, and, accordingly, leads to less informative earnings information than otherwise (Hanlon and Shevlin 2005; Hanlon et al. 2005, 2008). They argue that it results in lower earnings quality because tax authorities, and other stakeholders, require different kinds of information. If information is aligned to one measure, the quality of information for investors and other financial statement users will be reduced. Because a tax system is designed to meet the government objectives, such as increasing governmental revenue, the government can provide economic incentives or disincentives for taxpayers to engage in particular activities, and reward particular constituencies. In contrast, a financial accounting system typically provides managers with some incentive to convey more information so as to mitigate information asymmetry between the managers and other constituents. Thus, the
2
opponents insist that book-tax conformity impairs the usefulness of earnings information, and, therefore, believe it is detrimental to the investors’ decision-making ability.
The arguments for and against requiring book-tax conformity have been discussed in many countries for many years. There are several empirical studies about the effects of book-tax conformity on the usefulness of accounting earnings, but the existing literature on the impact of book-tax conformity on earnings management presents ambiguous results. Further, there are few studies that have examined the relationship between the degree of book-tax conformity and managers’ compensation contracts. This study focuses on this research gap.
This paper proceeds as follows. Section 2 discusses the literature review. Section 3 describes the theoretical model setting and analysis. Section 4 describes the empirical research design. Section 5 discusses the sample selection and test results. Section 6 presents the conclusion.
2. Literature Review
Some empirical studies address the relationship between book-tax conformity and earnings management. Atwood et al. (2010) found that higher conformity is related to lower earnings persistence and a lower association between earnings and future cash flows. The empirical measure of book-tax conformity developed by Atwood et al. (2010) has already been applied to study the impact of conformity on earnings management. For instance, Blaylock et al. (2015) concluded that greater absolute earnings management is connected with stronger book-tax conformity. Watrin et al. (2014) used an alternative specification of the measure for Europe, and showed the same conclusion. In contrast, Tang (2015) associated higher mandatory conformity with lower levels of earnings management and tax avoidance. Leuz et al. (2003) did not find any significant relationship between the degree of a country’s book-tax conformity and earnings management with sample of public firms. Burgstahler et al. (2006) documented that higher conformity is associated with greater earnings management for private firms. Moreover, Coppens and Peek (2005) presented evidence of European private firms not avoiding the reporting of small losses in countries that had high book-tax conformity. If taxable income and financial statement earnings are well-aligned, it is expected that private firms would respond more to a change in the corporate tax rate than public firms would, and that this response is expected to be seen indirectly in the financial statements.
Some theoretical studies analyze the relationship between disclosure regulations and earnings management. Murakami and Shiiba (2015) found that accounting regulations directly affected relative costs of accrual-based and real earnings management in both static and dynamic settings. Murakami and Ohta (2011) compared the value relevance of earnings information under the book-tax conformity reporting and decoupling settings. They report that the market has more precise information in the conformity setting than in the decoupling setting. Also, previous studies have examined corporate tax avoidance in a Linear, Exponential, and Normal (LEN) model, but the results were ambiguous (Chen and Chu 2005; Crocker and Slemrod 2005; Ewert and Niemann
3
2014). However, there are few theoretical research studies that examined the relationship between the degree of book-tax conformity and managers’ earnings management. This paper develops a simple model to examine this relationship directly, and, by extension, address this gap. Moreover, it also tests the impact of book-tax
conformity on earnings management using cross-country data in the empirical analysis section.
3. Theoretical Model
3.1 Model description
A multi-task principal-agent model, in which the risk-neutral principal owns a firm, was developed. The firm is operated by a manager who reports the firm’s earnings. The manager chooses an unobservable production effort 𝑎𝑎𝑝𝑝 that produces actual cash flow or unmanaged earnings 𝑥𝑥 = 𝑎𝑎𝑝𝑝+ 𝜀𝜀𝑝𝑝, where 𝜀𝜀𝑝𝑝 is an uncertainty regarding
the cash flow that is normally distributed with mean zero and variance 𝜎𝜎𝑝𝑝2. These unmanaged earnings are not available as a performance measure.
Besides the production activity, the manager can take actions that increase or decrease unmanaged earnings. These actions include an earnings management activity, 𝑎𝑎𝑒𝑒+ 𝜀𝜀𝑒𝑒, where 𝜀𝜀𝑒𝑒 is an uncertainty regarding the reported earnings that is normally distributed with mean zero and variance 𝜎𝜎𝑒𝑒2. The earnings management activity has an upward bias in unmanaged earnings. In this paper, it is assumed that 𝑑𝑑𝑐𝑐 is the degree of book-tax conformity, and that it has a direct impact on taxable income such that 0 ≤ 𝑑𝑑𝑐𝑐 ≤ 1 is satisfied. The firm’s reported earnings are written as 𝑓𝑓𝑓𝑓 = 𝑥𝑥 + 𝑎𝑎𝑒𝑒, and taxable income is written as 𝑡𝑡𝑓𝑓 = 𝑥𝑥 + 𝑑𝑑𝑐𝑐 𝑎𝑎𝑒𝑒. In the perfect conformity case, 𝑑𝑑𝑐𝑐 = 1, and taxable income equals reported earnings. Managers’ actions entail convex psychological costs 𝑐𝑐�𝑎𝑎𝑝𝑝; 𝑎𝑎𝑒𝑒� = �𝑐𝑐𝑝𝑝 𝑎𝑎𝑝𝑝2+ 𝑐𝑐𝑒𝑒 𝑎𝑎𝑒𝑒2�/2 for the manager, where 𝑐𝑐𝑝𝑝 and 𝑐𝑐𝑒𝑒 are
coefficients of the marginal costs “production cost” and “earnings management cost,” respectively. In other words, these coefficients reflect the difficultly, or costs, of each action. The cost of taking productive action is assumed to be different from that of distorting the reported earnings, and production cost is assumed to be higher than earnings management cost (𝑐𝑐𝑝𝑝> 𝑐𝑐𝑒𝑒).
The manager is risk- and effort-averse, and the managers’ utility functions consist of a compensation w and activity costs, that is, 𝑈𝑈𝑀𝑀 = −exp [−𝜌𝜌(𝑤𝑤 − 𝑐𝑐)], where 𝜌𝜌 represents a constant coefficient of absolute risk aversion.
The compensation contract is assumed to be linear in managers’ performance and is based on the after-tax earnings. Therefore, in the conformity case, the managers’ compensation takes the form:
𝑤𝑤𝑀𝑀= γM+ 𝛽𝛽𝑀𝑀(𝑓𝑓𝑓𝑓 − 𝑡𝑡 ⋅ 𝑡𝑡𝑓𝑓), (1)
where 𝛾𝛾𝑀𝑀 is a fixed compensation, 𝛽𝛽𝑀𝑀 is a bonus coefficient, and t is a corporate tax rate that satisfies 0 < 𝑡𝑡 ≤ 1/2. This tax rate range is observed in practice.
4 3.2 Analysis
For unobservable managerial activities, the principal can offer performance-based compensation contracts to motivate the manager into providing the desired activity levels. In this case, the optimal contract solves the following problem:
max𝛾𝛾𝑀𝑀,𝛽𝛽𝑀𝑀𝐸𝐸 [𝑥𝑥 − 𝑡𝑡 𝑡𝑡𝑓𝑓 − 𝑤𝑤𝑀𝑀] (2)
s.t. 𝐸𝐸[𝑤𝑤𝑀𝑀] − 𝑐𝑐 − 𝜌𝜌/2 𝛽𝛽𝑀𝑀2�(1 − 𝑡𝑡)2𝜎𝜎𝑝𝑝2+ (1 − 𝑑𝑑𝑐𝑐 𝑡𝑡)2𝜎𝜎𝑒𝑒2� ≥ 0 (PC) 𝑎𝑎𝑖𝑖= argmax𝑎𝑎𝑖𝑖 𝐸𝐸 [𝑤𝑤𝑀𝑀] − 𝑐𝑐 − 𝜌𝜌/2 𝛽𝛽𝑀𝑀2�(1 − 𝑡𝑡)2𝜎𝜎𝑝𝑝2+ (1 − 𝑑𝑑𝑐𝑐 𝑡𝑡)2𝜎𝜎𝑒𝑒2� , 𝑖𝑖 ∈ {𝑝𝑝, 𝑒𝑒} (IC)
The principal’s utility is equal to the cash flow that is determined by unmanaged earnings minus the tax expense that is based on the taxable income minus managers’ compensation. In other words, although managers’ earnings management do not affect the unmanaged earnings, the result for earnings management may affect real cash flow via tax payments. (PC) is a manager’s participation constraint. The left-hand side of (PC) is a
manager’s certainty equivalent of compensation 𝑤𝑤𝑀𝑀 and effort costs.
The optimal activity choices of the mangers are:
𝑎𝑎𝑝𝑝=(1−𝑡𝑡)𝛽𝛽𝑐𝑐𝑝𝑝 𝑀𝑀, 𝑎𝑎𝑒𝑒=(1−𝑑𝑑𝑐𝑐𝑐𝑐𝑒𝑒 𝑡𝑡)𝛽𝛽𝑀𝑀 (3)
In the optimum, again, (PC) is binding so that the expected compensation can be written as 𝐸𝐸[𝑤𝑤𝑀𝑀] = 𝑐𝑐 + 𝜌𝜌/2 𝛽𝛽𝑀𝑀2�(1 − 𝑡𝑡)2𝜎𝜎𝑝𝑝2+ (1 − 𝑑𝑑𝑐𝑐 𝑡𝑡)2𝜎𝜎𝑒𝑒2�. Substituting this condition and (IC) into the principal’s utility function,
and differentiating it with respect to 𝛽𝛽𝑀𝑀, shows that the first order conditions derive the following optimal bonus coefficient and level of activities:
𝛽𝛽𝑀𝑀∗ = 𝑐𝑐𝑒𝑒(1−𝑡𝑡) 2−𝑐𝑐𝑝𝑝 𝑑𝑑𝑐𝑐 𝑡𝑡(1−𝑑𝑑𝑐𝑐 𝑡𝑡) 𝑐𝑐𝑝𝑝(1−𝑑𝑑𝑐𝑐 𝑡𝑡)2+𝑐𝑐𝑒𝑒(1−𝑡𝑡)2+ 𝑐𝑐𝑒𝑒 𝑐𝑐𝑝𝑝 𝜌𝜌�(1−𝑡𝑡)2 𝜎𝜎𝑝𝑝2+(1−𝑑𝑑𝑐𝑐 𝑡𝑡)2 𝜎𝜎𝑒𝑒2� (4) 𝑎𝑎𝑝𝑝∗ = (1−𝑡𝑡)[𝑐𝑐𝑒𝑒(1−𝑡𝑡) 2−𝑐𝑐𝑝𝑝𝑑𝑑𝑐𝑐 𝑡𝑡(1−𝑑𝑑𝑐𝑐 𝑡𝑡)] 𝑐𝑐𝑝𝑝�𝑐𝑐𝑝𝑝(1−𝑑𝑑𝑐𝑐 𝑡𝑡)2+𝑐𝑐𝑒𝑒(1−𝑡𝑡)2+ 𝑐𝑐𝑒𝑒 𝑐𝑐𝑝𝑝 𝜌𝜌�(1−𝑡𝑡)2 𝜎𝜎𝑝𝑝2+(1−𝑑𝑑𝑐𝑐 𝑡𝑡)2 𝜎𝜎𝑒𝑒2��, (5) 𝑎𝑎𝑒𝑒∗= (1−𝑑𝑑𝑐𝑐 𝑡𝑡)[𝑐𝑐𝑒𝑒(1−𝑡𝑡) 2−𝑐𝑐𝑝𝑝𝑑𝑑𝑐𝑐 𝑡𝑡(1−𝑑𝑑𝑐𝑐 𝑡𝑡)] 𝑐𝑐𝑒𝑒�𝑐𝑐𝑝𝑝(1−𝑑𝑑𝑐𝑐 𝑡𝑡)2+𝑐𝑐𝑒𝑒(1−𝑡𝑡)2+ 𝑐𝑐𝑒𝑒 𝑐𝑐𝑝𝑝 𝜌𝜌�(1−𝑡𝑡)2 𝜎𝜎𝑝𝑝2+(1−𝑑𝑑𝑐𝑐 𝑡𝑡)2 𝜎𝜎𝑒𝑒2��. (6)
It is assumed that 𝑐𝑐𝑝𝑝< 𝑐𝑐𝑒𝑒(1 − 𝑡𝑡)2/[𝑑𝑑𝑐𝑐 𝑡𝑡 (1 − 𝑑𝑑𝑐𝑐 𝑡𝑡)] so the bonus coefficient and activity levels are positive. Differentiating Equations (4), (5), and (6) with respect to the degree of book-tax conformity produces:
𝜕𝜕𝛽𝛽𝑀𝑀∗ 𝜕𝜕𝑑𝑑𝑐𝑐 = 〈𝑐𝑐𝑝𝑝𝑡𝑡�𝑐𝑐𝑒𝑒(1 − 𝑡𝑡) 2− 𝑐𝑐 𝑝𝑝(1 − 𝑑𝑑𝑐𝑐 𝑡𝑡)2− 𝑐𝑐𝑒𝑒 𝜌𝜌�(1 − 𝑡𝑡)2(1 − 2 𝑑𝑑𝑐𝑐 𝑡𝑡)𝑐𝑐𝑝𝑝 𝜎𝜎𝑝𝑝2+ (1 − 𝑑𝑑𝑐𝑐 𝑡𝑡)�(1 − 𝑑𝑑𝑐𝑐 𝑡𝑡) 𝑐𝑐𝑝𝑝− 2(1 − 𝑡𝑡)2 𝑐𝑐 𝑒𝑒�𝜎𝜎𝑒𝑒2��〉/�𝑐𝑐𝑒𝑒(1 − 𝑡𝑡)2+ 𝑐𝑐𝑝𝑝(1 − 𝑑𝑑𝑐𝑐 𝑡𝑡)2+ 𝑐𝑐𝑝𝑝 𝑐𝑐𝑒𝑒 𝜌𝜌 �(1 − 𝑡𝑡)2 𝜎𝜎𝑝𝑝2+ (1 − 𝑑𝑑𝑐𝑐 𝑡𝑡)2 𝜎𝜎𝑒𝑒2��2< 0. (7) 𝜕𝜕𝑎𝑎𝑝𝑝∗ 𝜕𝜕𝑑𝑑𝑐𝑐= 〈(1 − 𝑡𝑡)𝑡𝑡�𝑐𝑐𝑒𝑒(1 − 𝑡𝑡) 2− 𝑐𝑐 𝑝𝑝(1 − 𝑑𝑑𝑐𝑐 𝑡𝑡)2− 𝑐𝑐𝑒𝑒 𝜌𝜌�(1 − 𝑡𝑡)2(1 − 2 𝑑𝑑𝑐𝑐 𝑡𝑡)𝑐𝑐𝑝𝑝 𝜎𝜎𝑝𝑝2+ (1 − 𝑑𝑑𝑐𝑐 𝑡𝑡)�(1 − 𝑑𝑑𝑐𝑐 𝑡𝑡) 𝑐𝑐𝑝𝑝− 2(1 − 𝑡𝑡)2 𝑐𝑐 𝑒𝑒�𝜎𝜎𝑒𝑒2��〉/�𝑐𝑐𝑒𝑒(1 − 𝑡𝑡)2+ 𝑐𝑐𝑝𝑝(1 − 𝑑𝑑𝑐𝑐 𝑡𝑡)2+ 𝑐𝑐𝑝𝑝 𝑐𝑐𝑒𝑒 𝜌𝜌 �(1 − 𝑡𝑡)2 𝜎𝜎𝑝𝑝2+ (1 − 𝑑𝑑𝑐𝑐 𝑡𝑡)2 𝜎𝜎𝑒𝑒2��2< 0. (8)
5 𝜕𝜕𝑎𝑎𝑒𝑒∗ 𝜕𝜕𝑑𝑑𝑐𝑐= 𝑡𝑡�𝑐𝑐𝑒𝑒 2 (1 − 𝑡𝑡)2𝑐𝑐 𝑝𝑝 𝜌𝜌�(1 − 𝑑𝑑𝑐𝑐 𝑡𝑡)2𝜎𝜎𝑒𝑒2− (1 − 𝑡𝑡)2𝜎𝜎𝑝𝑝2� − 𝑐𝑐𝑝𝑝2(1 − 𝑑𝑑𝑐𝑐 𝑡𝑡)4− 𝑐𝑐𝑒𝑒2(1 − 𝑡𝑡)4+ 2 𝑑𝑑𝑐𝑐 𝑡𝑡 𝑐𝑐𝑝𝑝 𝑐𝑐𝑒𝑒(1 − 𝑡𝑡)2− (1 − 𝑑𝑑𝑐𝑐 𝑡𝑡)𝑐𝑐𝑝𝑝2 𝑐𝑐𝑒𝑒 𝜌𝜌�(1 − 𝑡𝑡)2 (1 − 3 𝑑𝑑𝑐𝑐𝑡𝑡)𝜎𝜎𝑝𝑝2+ (1 − 𝑑𝑑𝑐𝑐 𝑡𝑡)3𝜎𝜎𝑒𝑒2��/𝑐𝑐𝑒𝑒�𝑐𝑐𝑒𝑒(1 − 𝑡𝑡)2+ 𝑐𝑐𝑝𝑝(1 − 𝑑𝑑𝑐𝑐 𝑡𝑡)2+ 𝑐𝑐𝑝𝑝 𝑐𝑐𝑒𝑒 𝜌𝜌 �(1 − 𝑡𝑡)2 𝜎𝜎 𝑝𝑝2+ (1 − 𝑑𝑑𝑐𝑐 𝑡𝑡)2 𝜎𝜎𝑒𝑒2��2< 0. (9)
The result derives the following proposition.
Proposition 1. If the production cost is relatively low � 𝑐𝑐𝑒𝑒(1−𝑡𝑡)2
[𝑑𝑑𝑐𝑐 𝑡𝑡 (1−𝑑𝑑𝑐𝑐 𝑡𝑡)]> 𝑐𝑐𝑝𝑝> 𝑐𝑐𝑒𝑒�, the optimal production and
earnings management activities 𝑎𝑎𝑝𝑝∗, 𝑎𝑎𝑒𝑒∗, respectively, and the optimal bonus coefficient 𝛽𝛽𝑀𝑀∗ always decrease with the degree of book-tax conformity.
Proposition 1 states if the cost production cost is sufficiently low, the production and earnings management activities, and the bonus coefficient decrease with the degree of book-tax conformity. The intuition of Proposition 1 is as follows. An increase in the degree of book-tax conformity has several effects on the principal’s utility. First, according to Equation (3), the increase in the degree of book-tax conformity leads to a decrease in the levels of earnings management activities, but not in the production activities. This makes the principal set have relatively low incentive because the marginal impact of increasing 𝛽𝛽𝑀𝑀∗ decreases due to the degree of book-tax conformity. Second, the impact of the degree of book-tax conformity purely increases tax expense. This effect decreases the bonus coefficient. Third, the increase in the degree of book-tax conformity increases the compensation volatility for the manager. This effect decreases the bonus coefficient because the manager is risk averse. All things considered, the impact of the degree of book-tax conformity affects managers’ earnings management activity and bonus coefficient directly. This effect decreases managers’ production activity, coinciding with most of the current literature. Atwood et al. (2010) found that the higher conformity is related to lower earnings persistence. Proposition 1 shows that a higher conformity is related to lower
production activity, which may lead to lower earnings persistence. Further, Desai (2005) and Tang (2015) associated higher conformity with lower levels of earnings management.
Substituting Equations (4)–(6) into the binding (PC), the expected utility of the principal 𝐸𝐸𝑈𝑈𝑃𝑃 was derived as follows:
𝐸𝐸𝑈𝑈
𝑃𝑃∗=
�𝑐𝑐𝑒𝑒(1−𝑡𝑡)2−𝑐𝑐
𝑝𝑝 𝑑𝑑𝑐𝑐 𝑡𝑡(1−𝑑𝑑𝑐𝑐 𝑡𝑡)�2
2 𝑐𝑐𝑒𝑒𝑐𝑐𝑝𝑝�𝑐𝑐𝑝𝑝(1−𝑑𝑑𝑐𝑐 𝑡𝑡)2+𝑐𝑐𝑒𝑒(1−𝑡𝑡)2+ 𝑐𝑐𝑒𝑒 𝑐𝑐𝑝𝑝 𝜌𝜌�(1−𝑡𝑡)2 𝜎𝜎𝑝𝑝2+(1−𝑑𝑑𝑐𝑐 𝑡𝑡)2 𝜎𝜎𝑒𝑒2��. (10)
Differentiating Equation (11) with respect to the degree of book-tax conformity results in: 𝜕𝜕𝐸𝐸𝑈𝑈𝑃𝑃∗
𝜕𝜕𝑑𝑑𝑐𝑐 =
〈−𝑡𝑡 �𝑐𝑐𝑒𝑒(1 − 𝑡𝑡)2− 𝑐𝑐𝑝𝑝 𝑑𝑑𝑐𝑐 𝑡𝑡(1 − 𝑑𝑑𝑐𝑐 𝑡𝑡)��𝑐𝑐𝑝𝑝(1 − 𝑑𝑑𝑐𝑐 𝑡𝑡)3(1 + 𝑐𝑐𝑒𝑒 𝜌𝜌 𝜎𝜎𝑒𝑒2) − 𝑐𝑐𝑒𝑒 (1 − 𝑡𝑡)2[𝑑𝑑𝑐𝑐 𝑡𝑡 + 𝑐𝑐𝑒𝑒 𝜌𝜌(1 − 𝑑𝑑𝑐𝑐𝑡𝑡)𝜎𝜎𝑒𝑒2] + 𝑐𝑐𝑝𝑝 𝑐𝑐𝑒𝑒 𝜌𝜌(1 − 𝑡𝑡)2(1 − 2 𝑑𝑑𝑐𝑐 𝑡𝑡)𝜎𝜎𝑝𝑝2�〉
�𝑐𝑐𝑒𝑒�𝑐𝑐𝑒𝑒(1 − 𝑡𝑡)2+ 𝑐𝑐𝑝𝑝(1 − 𝑑𝑑𝑐𝑐 𝑡𝑡)2+ 𝑐𝑐𝑝𝑝 𝑐𝑐𝑒𝑒 𝜌𝜌 �(1 − 𝑡𝑡)2 𝜎𝜎𝑝𝑝2+ (1 − 𝑑𝑑𝑐𝑐 𝑡𝑡)2 𝜎𝜎𝑒𝑒2��2�
< 0. (11)
6
Proposition 2. If the production cost is relatively low � 𝑐𝑐𝑒𝑒(1−𝑡𝑡)2
[𝑑𝑑𝑐𝑐 𝑡𝑡 (1−𝑑𝑑𝑐𝑐 𝑡𝑡)]> 𝑐𝑐𝑝𝑝> 𝑐𝑐𝑒𝑒�, the expected utility of the
principal always decreases with the degree of book-tax conformity.
As mentioned above, the degree of book-tax conformity has an indirect impact on managers’ production activity via the bonus coefficient.
The change in managers’ activities according to the degree of book-tax conformity is analyzed next. According to Proposition 1, if the production cost is sufficiently low, the managers’ optimal production and earnings management activities 𝑎𝑎𝑝𝑝∗, 𝑎𝑎𝑒𝑒∗, respectively, always decrease with the degree of book-tax conformity. A comparison of optimal managers’ activities shows that:
𝑎𝑎𝑝𝑝∗
𝑎𝑎𝑒𝑒∗ =
𝑐𝑐𝑒𝑒(1−𝑡𝑡)
𝑐𝑐𝑝𝑝(1−𝑑𝑑𝑐𝑐 𝑡𝑡)< 1 (12)
The result derives the following proposition.
Proposition 3. If the production cost is relatively low � 𝑐𝑐𝑒𝑒(1−𝑡𝑡)2
[𝑑𝑑𝑐𝑐 𝑡𝑡 (1−𝑑𝑑𝑐𝑐 𝑡𝑡)]> 𝑐𝑐𝑝𝑝> 𝑐𝑐𝑒𝑒�, the degree of production
activity is never higher than the degree of earnings management activity.
Increases in the degree of book-tax conformity leads to the degree of earnings management being relatively low. The ratio of production activity to earnings management activity shows that production activity will never be higher than the earnings management activity because of the effort cost. In this paper, it is assumed that the cost of production activity is higher than that of earnings management activity. Therefore, the manager has more incentive to engage in earnings management activities. Though, when there is an increase in the degree of book-tax conformity, managers’ incentive to engage in earnings management decreases. According to Equation (12), the degree of book-tax conformity will only affect the denominator of the ratio. As mentioned above, the degree of book-tax conformity impacts the managers’ earnings management activity both directly and indirectly, while the book-tax conformity impacts the managers’ production activity indirectly, via the bonus coefficient. Overall, when the degree of book-tax conformity increases, the degree of earnings management decreases.
4. Empirical Research Design
4.1 Hypotheses development
Prior international studies found that earnings persistence, and the association between earnings and future cash flows, are lower when book-tax conformity is higher (Atwood et al. 2010). Watrin et al. (2014) showed that higher book-tax conformity yields greater downward earnings management. Also, as the Proposition 1 in Section 3 shows, managers’ earnings management activities decreases with the degree of book-tax conformity. Therefore, the following was hypothesized:
7
Assuming book-tax conformity has a negative impact on earnings management, this study next explores how book-tax conformity affects managers’ compensation contracts. Gaertner (2014) was extended by including the degree of book-tax conformity. In traditional principal-agency models, the principal pays the manager a risk premium to encourage him or her to accept the compensation contract. In fact, CEOs who are compensated after-tax bear significant additional risks associated with the tax accounts. Thus, the possibility of exogenous changes in the tax rate introduces significant compensation risks to CEOs paid on an after-tax basis (Newman 1989). The higher the book-tax conformity, the lower the compensation risk to CEOs, so the principal can pay a lower risk premium to the manager. Also, as Proposition 1 in Section 3 shows, the bonus coefficient of
managers’ compensation decreases with the degree of book-tax conformity. Therefore, the following was hypothesized:
H2: The degree of book-tax conformity is negatively associated with CEO compensation.
4.2 Resign design and sample selection 4.2.1 Book-tax conformity measure
Atwood et al. (2010) defined book-tax conformity measures as the amount of variation in current tax expense that is not captured by the variation in pre-tax income, in any given country-year. Countries that allow greater flexibility in the reporting of taxable income, given a particular level of pre-tax income, have lower book-tax conformity. Thus, to keep in line with Atwood et al. (2010), book-tax conformity is calculated by estimating the conditional variance of current tax expenses from the following model, estimated by country-year:
CTEt= θ0+ θ1 PTBIt+ θ2ForPTBIt+ θ3DIVt+ et, (13)
where CTE is current tax expense2, t is the year indicator, PTBI is the pre-tax book income, ForPTBI is the estimated foreign pre-tax book income (foreign tax expense / total tax expense x PTBI)3, DIV is the total dividends, and e is a disturbance term with mean zero. CTE, PTBI, ForPTBI, and DIV are divided by lagged total assets to control for cross-sectional scale differences. The measure of book-tax conformity is calculated as the scaled ranking of the root mean squared errors (RMSEs) obtained from country-year estimates of Equation (13).
Like Atwood et al. (2010), when a higher RMSE corresponds to lower book-tax conformity, vice versa, the analysis uses descending ranks (i.e., the highest RMSE in a given year is ranked 0, and the lowest is ranked n - 1, where n is the number of included countries in that year), then divides them by n - 1 to scale the rankings so that they range between zero and one. The higher ranks on the book-tax conformity measure indicates higher conformity.
As a robustness test, Watrin et al. (2014) was followed to calculate book-tax conformity by calculating the
2 All financial variables are drawn from Standard & Poor’s (S&P) Capital IQ platform.
3 Like Atwood et al. (2010), the database does not break pre-tax book income into its domestic and foreign
components, nor does it break foreign tax expenses into its current and deferred components. ForPTBI is the foreign percentage of pre-tax book income as foreign tax expense/total tax expense.
8
absolute value of permanent book-tax differences for each country-year:
PermBTDi,t = PTBIi,t− (Taxationi,t/ TaxRatek,t), (14)
where PermBTD is the permanent book-tax difference, t is the year indicator, i is the firm indicator, Taxation is the total taxation4, and TaxRate is the corporate tax rate of the country k5. Like Watrin et al. (2014), the mean of all the absolute values of permanent book-tax differences in one country in a given year was taken, and a rank assigned to each country in each year based on PermBTDi,t in Equation (14). Also, the analysis uses descending ranks (i.e., the highest RMSE in a given year is ranked 0 and the lowest is ranked n - 1, where n is the number of included countries in that year), then divides them by n - 1 to scale the rankings. The final scaled rank is calculated as the average rank over a 10-year period (2008–2018).
4.2.2 Earnings management measure
Following prior literature, discretionary accruals were used as a proxy for accrual-based earnings management. In this study, the discretionary accruals, based on the Jones model in Equation (15), were modified in Equation (16) (Dechow et al. 1995). The abnormal accruals were also based on the Jones model in Equation (17), and augmented for net income (Kothari et al. 2005) as the measure of earnings management in Equation (18). The discretionary accrual is estimated cross-sectionally each country-year using all firm-year observations in the same two-digit SIC code6:
TAit= ι0+ ι1(1/ASSETit−1) + ι2ΔSALESit+ ι3PPEit+ νit, (15) TAit= κ0+ κ1(1/ASSETit−1) + κ2(ΔSALESit− ΔARit) + κ3PPEit+ ξit, (16)
TAit= λ0+ λ1(1/ASSETit−1) + λ2ΔSALESit+ λ3PPEit+ λ4ROAit+ 𝜋𝜋it, (17)
TAit= μ0+ μ1(1/ASSETit−1) + μ2(ΔSALESit− ΔARit) + μ3PPEit+ μ4ROAit+ τit, (18)
where TAit is the total accruals as the change in non-cash current assets minus the change in current liabilities, excluding the current portion of long-term debts, minus depreciation and amortization, scaled by lagged total assets; t is the year indicator; i is the firm indicator; ASSET is the total assets; ΔSALESit is the change in sales scaled by lagged total assets; PPEit is net property, plant and equipment scaled by lagged total assets; ΔARit is the change in accounts receivables scaled by lagged total assets; and ROAit is net income scaled by lagged total assets.
4 Total taxation is the sum of current and deferred tax expenses of firm i in year t. Like Watrin et al. (2014), all
the financial variables are scaled by lagged total assets.
5 The tax rate of country k in year t are taken from KPMG’s Corporate Tax Rate Table (see
https://home.kpmg/xx/en/home/services/tax/tax-tools-and-resources/tax-rates-online/corporate-tax-rates-table.ht ml).
6 To further strengthen the quality of measure, all industry-country-years with fewer than 10 observations were
9
4.3 Test for CEO compensation and the association between book-tax conformity and earnings management
CEO compensation and the association between book-tax conformity and earnings management was tested using the cross-section of firm-year observations. To mitigate the influence of error terms that are correlated across firms; across time and across country, I follow the recommendation in Petersen (2009) by estimating all regression models using ordinary least squares(OLS), using standard errors clustered by industry, and including year fixed effects . Specifically, the following models (with country and firm subscripts suppressed) were estimated: 𝐸𝐸𝐸𝐸𝐸𝐸𝑓𝑓𝐸𝐸𝐸𝐸𝑝𝑝𝑡𝑡= 𝜙𝜙0+ 𝜙𝜙1 𝐵𝐵𝐵𝐵𝐵𝐵𝑡𝑡+ 𝜙𝜙2𝑁𝑁𝐸𝐸𝑁𝑁𝑡𝑡+ 𝜙𝜙3𝑁𝑁𝐸𝐸𝑁𝑁 ∗ 𝐵𝐵𝐵𝐵𝐵𝐵𝑡𝑡+ 𝜙𝜙4𝐵𝐵𝐵𝐵𝐶𝐶𝑡𝑡+ 𝜙𝜙5𝐿𝐿𝐸𝐸𝑉𝑉𝑡𝑡−1+ 𝜙𝜙6 𝐿𝐿𝐿𝐿𝐿𝐿𝐿𝐿𝑡𝑡+ 𝜙𝜙7𝐿𝐿𝑆𝑆𝑆𝑆𝐸𝐸𝑡𝑡−1+ 𝜙𝜙8𝐸𝐸𝐵𝐵𝐶𝐶𝑡𝑡−1+ 𝜙𝜙9 𝐽𝐽𝑆𝑆𝑡𝑡+ 𝜙𝜙10𝐿𝐿𝑆𝑆𝑡𝑡+ 𝜙𝜙11𝑆𝑆𝑃𝑃𝑡𝑡+ 𝜙𝜙12𝐷𝐷𝐵𝐵𝑆𝑆𝑁𝑁𝐷𝐷𝐿𝐿𝑈𝑈𝐶𝐶𝑡𝑡+ 𝜙𝜙13𝐷𝐷𝐷𝐷𝑈𝑈𝐷𝐷𝑆𝑆𝐵𝐵𝐵𝐵𝐷𝐷𝐷𝐷𝑡𝑡+ 𝜙𝜙14𝐶𝐶𝐿𝐿𝐷𝐷𝑡𝑡−1+ 𝜙𝜙15𝐵𝐵𝐶𝐶𝐵𝐵𝐿𝐿𝐸𝐸𝑡𝑡−1+ ∑ 𝜙𝜙𝑗𝑗 16,𝑗𝑗 𝐶𝐶𝑒𝑒𝑎𝑎𝑓𝑓_𝐷𝐷𝐸𝐸𝐷𝐷𝐷𝐷𝐷𝐷𝑡𝑡,𝑗𝑗+ ∑ 𝜙𝜙𝑗𝑗 17,𝑘𝑘 𝑆𝑆𝐼𝐼𝑑𝑑𝐸𝐸𝑠𝑠𝑡𝑡𝑓𝑓𝐷𝐷_𝐷𝐷𝐸𝐸𝐷𝐷𝐷𝐷𝐷𝐷𝑡𝑡,𝑘𝑘+ ∑ 𝜙𝜙𝑗𝑗 17,𝑘𝑘 𝐵𝐵𝐸𝐸𝐼𝐼𝐸𝐸𝐼𝐼𝑡𝑡𝑓𝑓𝐷𝐷_𝐷𝐷𝐸𝐸𝐷𝐷𝐷𝐷𝐷𝐷𝑡𝑡,𝑘𝑘+ 𝜐𝜐𝑡𝑡, (19) 𝐵𝐵𝐿𝐿𝐸𝐸𝑃𝑃𝑡𝑡= 𝜒𝜒0+ 𝜒𝜒1 𝐵𝐵𝐵𝐵𝐵𝐵𝑡𝑡+ 𝜒𝜒2𝐿𝐿𝐿𝐿𝐿𝐿𝐿𝐿𝑡𝑡+ 𝜒𝜒3𝐿𝐿𝐿𝐿𝐿𝐿𝐿𝐿 ∗ 𝐵𝐵𝐵𝐵𝐵𝐵𝑡𝑡+ 𝜒𝜒4𝐵𝐵𝐵𝐵𝐶𝐶𝑡𝑡+ 𝜒𝜒5𝐶𝐶𝐿𝐿𝐷𝐷𝑡𝑡+ 𝜒𝜒6𝐶𝐶𝐿𝐿𝐷𝐷𝑡𝑡−1+ 𝜒𝜒7𝐿𝐿𝐵𝐵𝐷𝐷𝐶𝐶𝐿𝐿𝐷𝐷𝑡𝑡+ 𝜒𝜒8𝐶𝐶𝐸𝐸𝐵𝐵𝑡𝑡+ 𝜒𝜒9 𝐶𝐶𝐸𝐸𝐵𝐵𝑡𝑡−1+ 𝜒𝜒10𝐿𝐿𝐵𝐵𝐷𝐷𝐶𝐶𝐸𝐸𝐵𝐵𝑡𝑡+ 𝜒𝜒11𝐿𝐿𝐸𝐸𝑉𝑉𝑡𝑡+ 𝜒𝜒12𝐵𝐵𝐷𝐷𝐿𝐿𝑡𝑡+ 𝜒𝜒13𝑃𝑃𝑃𝑃𝐸𝐸𝑡𝑡+ 𝜒𝜒14𝑆𝑆𝑁𝑁𝐵𝐵𝐷𝐷𝑁𝑁𝑁𝑁𝑡𝑡+ 𝜒𝜒15𝑆𝑆𝑁𝑁𝑉𝑉𝑡𝑡+ 𝜒𝜒16𝐿𝐿𝑆𝑆𝑆𝑆𝐸𝐸𝑡𝑡−1+ 𝜒𝜒17𝐷𝐷𝐵𝐵𝑆𝑆𝑁𝑁𝐷𝐷𝐿𝐿𝑈𝑈𝐶𝐶𝑡𝑡+ 𝜒𝜒18𝐷𝐷𝐷𝐷𝑈𝑈𝐷𝐷𝑆𝑆𝐵𝐵𝐿𝐿𝐶𝐶𝐵𝐵𝐷𝐷𝐷𝐷𝑁𝑁𝑁𝑁𝐸𝐸𝑡𝑡+ ∑ 𝜒𝜒𝑚𝑚 19,𝑚𝑚 𝐶𝐶𝑒𝑒𝑎𝑎𝑓𝑓_𝐷𝐷𝐸𝐸𝐷𝐷𝐷𝐷𝐷𝐷𝑡𝑡,𝑚𝑚+ ∑ 𝜒𝜒𝑛𝑛 20,𝑛𝑛 𝑆𝑆𝐼𝐼𝑑𝑑𝐸𝐸𝑠𝑠𝑡𝑡𝑓𝑓𝐷𝐷_𝐷𝐷𝐸𝐸𝐷𝐷𝐷𝐷𝐷𝐷𝑡𝑡,𝑛𝑛+ ∑ 𝜒𝜒𝑛𝑛 20,𝑛𝑛 𝐵𝐵𝐸𝐸𝐸𝐸𝐼𝐼𝑡𝑡𝑓𝑓𝐷𝐷_𝐷𝐷𝐸𝐸𝐷𝐷𝐷𝐷𝐷𝐷𝑡𝑡,𝑛𝑛+ 𝜔𝜔𝑡𝑡, (20) where 𝐸𝐸𝐸𝐸𝐸𝐸𝑓𝑓𝐸𝐸𝐸𝐸𝑝𝑝 is the discretionary accruals, and 𝐵𝐵𝐵𝐵𝐵𝐵 is the measure for book-tax conformity.
Based on H1 and the result of Proposition 1, if firm-years with higher conformity are associated with greater (downward) earnings management, 𝜙𝜙1< 0 is predicted. The following dummy variable was inserted: 𝑁𝑁𝐸𝐸𝑁𝑁 equals 1 if discretionary accruals are negative, and 0 otherwise. The measure of book-tax conformity interacts with this indicator variable to empirically assess how much higher or lower the discretionary accruals are when book-tax conformity changes. Consistent with the expectation that higher book-tax conformity is associated with greater downward earnings management, compared with lower book-tax conformity, 𝜙𝜙3> 0 was predicted.
Several controls and fixed effects were used because accounting research has identified numerous factors that affect earnings management behaviors. The controlling for statutory tax rate (𝐵𝐵𝐵𝐵𝐶𝐶) variable is to ensure that the book-tax conformity measure is not just reflecting differences in statutory tax rates that exist across different countries (Atwood et al. 2010). Controlling for leverage (𝐿𝐿𝐸𝐸𝑉𝑉) is based on the assumption that managers are more likely to use discretion in accounting as they offset tightening debt-covenant constraints (Sweeny 1994). Also, control for loss (𝐿𝐿𝐿𝐿𝐿𝐿𝐿𝐿) was included because of the incentive to manage earnings in order to avoid reporting losses.
Regarding the firm size (𝐿𝐿𝑆𝑆𝑆𝑆𝐸𝐸), positive accounting theory postulates that large firms engage in greater earnings management than small firm do because of the differences in political costs (Watts and Zimmerman 1978). The
10
market-to-book ratio (𝐸𝐸𝐵𝐵𝐶𝐶) was used to control for growth. In addition to judicial independence and shareholder interests, investor protection was used to determine country-specific effects, as prior research has shown that investor protection has a negative influence on the magnitude of earnings management (Leuz et al. 2003; La Porta et al. 1998). Also, prior research shows that the Big 8 audit firms constrain earnings management through discretionary accruals (DeFond and Jiambalvo 1991; Becker et al. 1998), but, according to the period of the sample, a Big 4 dummy variable (𝐷𝐷𝐵𝐵𝑆𝑆𝑁𝑁𝐷𝐷𝐿𝐿𝑈𝑈𝐶𝐶) was used to control the auditor type between the largest four audit firms. Also, Zang (2012) found that firms with longer operating cycles (𝐵𝐵𝐶𝐶𝐵𝐵𝐿𝐿𝐸𝐸) have greater flexibility for accrual management because they have larger accrual accounts and a longer period for accruals to reverse. Furthermore, the industry and year fixed effects were controlled.
Equation (20) estimates how book-tax conformity affects CEO compensation (𝐵𝐵𝐿𝐿𝐸𝐸𝑃𝑃). In this study, the natural log of CEO cash compensation and total board member cash compensation was the dependent variable7. Based on H2 and the result of Proposition 1, if firm-years with higher conformity are associated with less
compensation through greater downward earnings management, then 𝜒𝜒1< 0 is predicted. The following dummy variable was inserted: 𝐿𝐿𝐿𝐿𝐿𝐿𝐿𝐿 equals 1 if pre-tax incomes are negative, and 0 otherwise. ROA and RET were included because they are important determinants of cash compensation (Sloan 1993). Also, the standard deviation of incomes and stock returns are to control for risks in earnings dependent compensation (Gaertner 2014). Controlling for firm size (𝐿𝐿𝑆𝑆𝑆𝑆𝐸𝐸) is based on political costs, as larger firms face more scrutiny on CEO pay than smaller firms do (Leone et al. 2006). Several control variables that prior research have shown were also included.
4.4 Sample selection
The group structure data, financial data, and compensation data were drawn from the Standard & Poor’s (S&P) Capital IQ platform. All firm-year observations from 2007 to 2018 were obtained from the necessary data to compute the earnings management and book-tax conformity measure. Following the prior literature, all observations with missing SIC code and financial institutions (SIC 6000-6999), and regulated industries (SIC 4400-5000) were excluded from the sample. All firm-year observations from countries that do not have at least 40 usable firm-year observations, which is a less stringent data availability criterion than previous research used, were deleted. To mitigate the influence of outliers, the top and bottom 0.5% of each year were winsorized. To test Equation (20), the firm-year observations with missing compensation data were removed. The sample selection procedure yields 163,195 firm-year observations from 34 countries to test Equation (19), and 38,988 firm-year observations from 34 countries to test Equation (20).
Table 1 lists the sample countries and country-specific averages from the results of estimating Model (13) and (14). Also, it presents the average RMSE, average BTD, average Corporate tax rate (CTR) for each country, as well as the number of years, N(years) and the number of firms, N(firms), that each country appears in the sample. The countries are sorted from high to low average book-tax conformity (Watrin et al. (2014) measure).
11
As corporate tax rate increases, book-tax conformity decreases. In other words, when the statutory tax rate is high, firms have higher incentives for tax planning. As the result, high statutory tax rate countries have a relatively high BTD (indicating low book-tax conformity). The relationship between statutory tax rate and RMSE is shown to be similar.
[Insert Table 1 here]
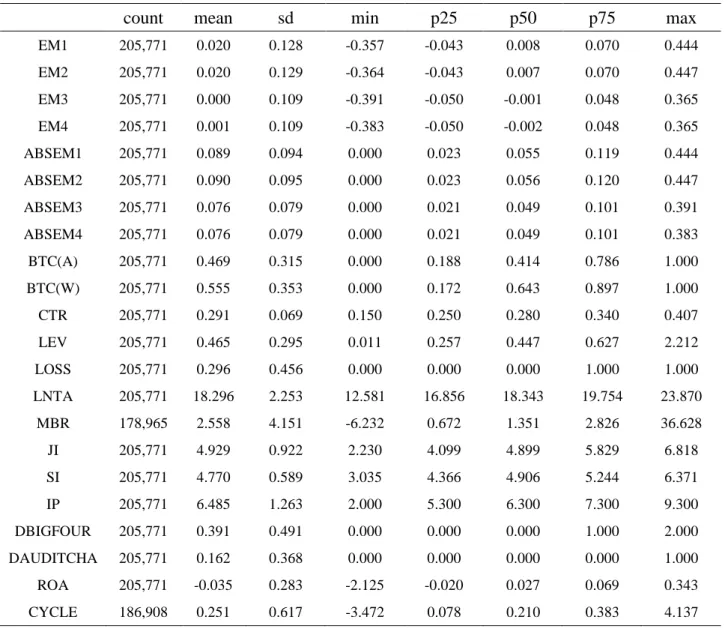
4.5 Descriptive statistics
Table 2 presents the descriptive statistics for the sample of equation (19), the means of EM group are near zero. The mean of BTC(A) and BTC(W) are 0.469 and 0.555, because the rank of two book-tax conformity measures are different. For example, the average Wartin et al. (2014) measure of Japan is 0.8672, but under the average Atwood et al. (2010) measure is 0.1746, also the number of firms of Japan is 2,642 per year. This different causes the different in the mean of BTC(A) and BTC(W). Table 3 presents the descriptive statistics for the sample of equation (20), due to the difficulty of collecting data, the number of data of dependent variable LNCOMP is only 51,251. As the result the sample size of regression of equation (20) is 38,988. This phenomenon has been seen in many previous studies related to CEO compensation. The mean of ROA and ROAt-1 are -0.039 and -0.035, but the median 0.026 and 0.027. Although the distribution of ROA and ROAt-1 are left-skewed, the impact on the analysis is not big.
[Insert Table 2 here] [Insert Table 3 here]
Table 4 presents the correlation between the sample of equation (19). First the correlation between EM group and BTC are all negative (p<0.01), the correlation between BTC and CTR are all negative (p<0.01). The correlation between EM group and LOSS are all positive (p<0.01), that means when a firm have a loss after tax, manager will have more incentive to manage the earnings. The correlation between EM group and ROA also show the same result. Table 5 presents the correlation between the sample of equation (20). First the correlation between LNCOMP and BTC are all negative (p<0.01). Also, the correlation between CTR and ROA are negative. That means when the statutory corporate tax rate is high, firm will have less incentive to make a higher profit. About the correlation between SIZE and ROA is positive (p<0.01) and correlation between SIZE and STDROA, RET and STDRET are all negative (p<0.01), big firm can raised a good performance in such scale effect, on another hand, the performance is more stable and the stock price is relatively low.
[Insert Table 4 here] [Insert Table 5 here]
5. Results
The results reported in Table 6 and 7. Table 6 address the effect of book tax conformity on earnings
management. Regarding the signed values of discretionary accruals (Table 6, Panel A) and absolute values of discretionary accruals (Table 6, Panel B), the coefficients of book tax conformity (𝛷𝛷1) are all significant
12
negative8. Thus, as book tax conformity increases, earnings management decreases for positive discretionary accrual firms, consistent with H1. Simultaneously, as book tax conformity increases, downward earnings management increases. As the result, when book tax conformity increase, earnings management (absolute values of discretionary accruals) will decrease. The result is different from Wartin et al. (2014), but in this study, I included more control variable for the cost of earnings management. Also, the result from theoretical part had shown that when the degree of book-tax conformity increases, manager will have less incentive to manage earnings. The second regression (Table 7) examines the impact of book tax conformity on CEO compensation (H2). I find that book tax conformity is associated with significantly less CEO compensation (𝜒𝜒1< 0). Even though I had already included some firm performance as the control variables, the coefficients are still negative, consistent with H2. About the relationship between firm’s performance and CEO compensation, the result shows that the coefficients of ROA, ROAt-1 and STDRET are negative, on other hand, coefficients of STDROA,
RET and RETt-1 are positive. Rego and Wilson (2009) also reported the similar result. They estimated US data
from 1996 to 2001 and their results showed that the relationship between CEO compensation and RET is positive but the relationship between ROA and compensation is not significant. As in equation (1), Total compensation can be divided into fixed compensation and bonus. For the part of fixed compensation, no matter firm have a loss or profit, it will not be negative. In general, the fixed compensation of a big firm is higher, if more big firms have a loss, the coefficients of ROA may be negative. Compare with ROA, investor focus on RET because of the investment return. So, the coefficients of RET is positive. Simultaneously, the coefficient of STDRET show that investors do not prefer uncertainty.
6. Concluding Remarks
Regarding the increase in elaborate international tax shelter strategies during early 2000s, the internationally agreed standards of transparency and exchange of information in tax area ensured consistent and effective implementation of international transparency standards. However, BEPS is still a big issue on the political agenda because of the aggressive tax planning by multinational enterprises (MNEs). This paper investigated how the degree of book-tax conformity affects managers’ compensation contracts and earnings management activity by using theoretical and empirical model simultaneously. This paper found that the bonus coefficient decreases with the degree of book-tax conformity. The main findings are as follows: book-tax conformity prevents the manager from engaging in earnings management activity as well as some production activities, as the result, the CEO compensation will be relatively decrease; and the expected utility of the principal decreases with the degree of book-tax conformity. These findings are supported by theoretical and empirical test. Some of these results are consistent with previous literature and real-world examples. For example, according to Ito Review9, the performance and compensation bonus of Japanese companies appears to be considerably lower than global standards, especially in countries with lower book-tax conformity, such as the United States. The
8 I got the same result with different book tax conformity measure BTC(W).
9 See the Ito Review of Competitiveness and Incentives for Sustainable Growth-Building Favorable
13
results of this paper provide one reason why compensation contracts are different among countries. Also, Zicke and Kiy (2017) founded that the effect of German Accounting Law Modernization Act is a greater amount of absolute discretionary accruals. Thus, when the degree of book-tax conformity decrease, earnings management activity will become more aggressive.
In summary, this study shows that book tax conformity can prevents the earnings management activity. However, this investigation has some caveats. First, the model in this study had not separate earnings management activity and tax aggressiveness. Some theoretical models tested firm’s tax avoidance behavior (Ewert and Niemann 2014; Waegenaere et al. 2015). If I add a tax planning or tax avoidance activity into the theoretical analysis part, the result may be different. However, the main purpose of this study is to investigate the relationship between book-tax conformity affects managers’ compensation contracts and earnings
management activity by using theoretical and empirical model simultaneously. Generally, BTD is used in many studies as the measure of tax avoidance, but it is used in the calculation of book-tax conformity measures BTC. Thus, I did not add tax planning or tax avoidance activity into the model. Second, compare with equation (19), the number of observations of equation (20) is less than 1/4, only 38,988. Compare with firm’s financial or accounting data, the number of available data on CEO compensation is less. Most prior literature on CEO compensation faces the same problem. Since the result of this study is useful.
Using Global data allows me to study countries that employ different systems. Therefore, this study contributes to the ongoing debate in many countries regarding whether high book tax conformity is associated with more earnings management. Of course, earnings management is one aspect of earnings quality. The results suggest that a higher book tax conformity can prevent earnings management. Therefore, the results indicate that U.S. should move from a low book tax conformity system to a high book tax conformity system. If mandatory application of IFRS is decided by Japanese government, they should keep the high book tax conformity system. Overall, this study provides a new aspect for the relationship between book tax conformity and earnings
management. I build a theoretical model to comprehensively investigate the relationship between book-tax conformity affects managers’ compensation contracts and earnings management activity. Prior literature tested the relationship between book tax conformity and earnings management or earnings management and CEO compensation, respectively. I believe that the results of this study can provide policy makers with information on the determine of the book tax conformity system.
14 References
Atwood, T. J., Drake, M. S., & Myers, L. A. (2010) Book-tax conformity, earnings persistence and the
association between earnings and future cash flows. Journal of Accounting and Economics, 50(1), 111–125. Becker, C. L., DeFond, M. L., Jiambalvo, J., & Subramanyam, K. R. (1998). The effect of audit quality on
earnings management. Contemporary accounting research, 15(1), 1-24.
Blaylock, B., Gaertner, F., & Shevlin, T. (2015) The association between book-tax conformity and earnings management. Review of Accounting Studies, 20(1), 141–172.
Burgstahler, D. C., Hail, L., & Leuz, C. (2006) The importance of reporting incentives: Earnings management in European private and public firms. The Accounting Review, 81(5), 983–1016.
Chen, K. P., & Chu, C. C. (2005) Internal control versus external manipulation: A model of corporate income tax evasion. RAND Journal of Economics, 36(1), 151–164.
Coppens, L., & Peek, E. (2005) An analysis of earnings management by European private firms. Journal of
International Accounting, Auditing and Taxation, 14(1), 1–17.
Crocker, K. J., & Slemrod, J. (2005) Corporate tax evasion with agency costs. Journal of Public Economics, 89(9-10), 1593–1610.
Dechow, P. M., Sloan, R. G., & Sweeney, A. P. (1995). Detecting earnings management. Accounting review, 193-225.
DeFond, M. L., & Jiambalvo, J. (1991). Incidence and circumstances of accounting errors. Accounting review, 643-655.
Desai, M. A. (2005) The degradation of reported corporate profits. Journal of Economic Perspectives, 19(4), 171–192.
Desai, M. A., & Dharmapala, D. (2006). Corporate tax avoidance and high-powered incentives. Journal of
financial Economics, 79(1), 145-179.
De Waegenaere, A., Sansing, R., & Wielhouwer, J. L. (2015). Financial accounting effects of tax aggressiveness: Contracting and measurement. Contemporary Accounting Research, 32(1), 223-242.
Ewert, R., & Niemann, R. (2014) A theory of tax avoidance: Managerial incentives for tax planning in a
multi-task principal-agent model.CESifo Working Paper No. 4851.CESifo Group Munich.
Gaertner, F.B. (2014) CEO after-tax compensation incentives and corporate tax avoidance.Contemporary
Accounting Research, 31(4), 1077–1102.
Hanlon, M., Kelley Laplante, S., & Shevlin, T. (2005) Evidence for the possible information loss of conforming book income and taxable income. The Journal of Law and Economics, 48(2), 407–442.
Hanlon, M., Maydew, E. L., & Shevlin, T. (2008) An unintended consequence of book-tax conformity: A loss of earnings informativeness. Journal of Accounting and Economics, 46(2-3), 294–311.
Hanlon, M., & Shevlin, T. (2005) Book-tax conformity for corporate income: An introduction to the issues. InJ. M. Poterba (Ed.), Tax policy and the economy, volume 19 (pp. 101-134).Cambridge, MA: MIT Press. Jones, J. J. (1991). Earnings management during import relief investigations. Journal of accounting research,
29(2), 193-228.
15 Journal of accounting and economics, 39(1), 163-197.
Petersen, M. A. (2009). Estimating standard errors in finance panel data sets: Comparing approaches. The
Review of Financial Studies, 22(1), 435-480.
Porta, R. L., Lopez-de-Silanes, F., Shleifer, A., & Vishny, R. W. (1998). Law and finance. Journal of political
economy, 106(6), 1113-1155.
Leone, A. J., Wu, J. S., & Zimmerman, J. L. (2006). Asymmetric sensitivity of CEO cash compensation to stock returns. Journal of accounting and economics, 42(1-2), 167-192.
Leuz, C., Nanda, D., & Wysocki, P. D. (2003) Earnings management and investor protection: An international comparison. Journal of Financial Economics, 69(3), 505–527.
Murakami, Y., & Shiiba, A. (2015) Accrual-based and real earnings management in dynamic settings. Available at SSRN 1435992.
Murakami, Y., & Ohta, Y. (2011) Conformity or decoupling: A comparative analysis on different tax regimes. 2011 American Accounting Association Annual Meeting – Tax Concurrent Sessions.
Newman, H. A. (1989) Selection of short-term accounting-based bonus plans. The Accounting Review, 64(4), 758–772.
Slemrod, J. B., & Blumenthal, M. (1996) The income tax compliance cost of big business. Public Finance
Quarterly, 24(4), 411–438.
Sloan, R. G. (1993). Accounting earnings and top executive compensation. Journal of accounting and
Economics, 16(1-3), 55-100.
Sweeney, A. P. (1994). Debt-covenant violations and managers' accounting responses. Journal of accounting
and Economics, 17(3), 281-308.
Tang, T. Y. (2015) Does book-tax conformity deter opportunistic book and tax reporting? An international analysis. European Accounting Review, 24(3), 441–469.
The Ministry of Economy, Trade and Industry (METI) (2014) , Final report of the Ito Review “Competitiveness
and Incentives for Sustainable Growth : Building Favorable Relationships between Companies and Investors” Retrieved from
https://www.meti.go.jp/english/policy/economy/corporate_governance/pdf/FRIR.pdf
Watrin, C., Ebert, N., & Thomsen, M. (2014) Book-tax conformity and earnings management: Insights from European one- and two-book systems. The Journal of the American Taxation Association, 36(2), 55–89. Watts, R. L., & Zimmerman, J. L. (1978). Towards a positive theory of the determination of accounting
standards. Accounting review, 112-134.
Whitaker, C. (2005) How to build a bridge: Eliminating the book-tax accounting gap. The Tax Lawyer, 59(4), 981–1020.
Yin, G. K. (2001) Getting serious about corporate tax shelters: Taking a lesson from history. SMUL Rev., 54, 209.
Zang, A. Y. (2012). Evidence on the trade-off between real activities manipulation and accrual-based earnings management. The accounting review, 87(2), 675-703.
16 Table 1. Level of Book Tax conformity measures by country
Country N(years) Avg. BTD
Avg. RANK
(Watrin et al.) Avg. RMSE
Avg. RANK
(Atwood et al.) Avg. CTR N(firms)
Taiwan 11 0.0623 0.9617(1) 0.0103 0.9363(1) 0.1873 1,354 South Korea 11 0.0712 0.8942(2) 0.0142 0.7593(8) 0.2417 1,368 Japan 11 0.0678 0.8672(3) 0.0346 0.1746(30) 0.3644 2,642 Sri Lanka 11 0.0832 0.8186(4) 0.0192 0.5749(16) 0.2873 88 Egypt 7 0.0745 0.8007(5) 0.0241 0.3848(21) 0.2364 68 Italy 11 0.0868 0.7465(6) 0.025 0.3584(25) 0.3005 107 China 11 0.0844 0.7404(7) 0.013 0.7956(6) 0.25 2,525 Spain 1 0.086 0.7273(8) 0.02 0.4545(19) 0.25 39 Thailand 11 0.0822 0.7264(9) 0.011 0.8961(2) 0.2391 296 Vietnam 11 0.0872 0.6835(10) 0.0131 0.7909(7) 0.2355 163 Pakistan 11 0.0891 0.6808(11) 0.0245 0.3591(24) 0.3364 203 Turkey 11 0.0882 0.6697(12) 0.0115 0.8788(3) 0.2018 135 Malaysia 11 0.0885 0.6459(13) 0.0131 0.7964(5) 0.2473 542 India 11 0.0939 0.5869(14) 0.0259 0.3259(26) 0.3397 2,552 South Africa 3 0.0998 0.5801(15) 0.0138 0.7404(10) 0.28 41 Bangladesh 8 0.0941 0.5693(16) 0.0359 0.0981(32) 0.2625 93 Switzerland 11 0.1407 0.5664(17) 0.0151 0.7106(11) 0.1826 79 Singapore 11 0.1023 0.5281(18) 0.0186 0.5778(15) 0.1718 219 Indonesia 11 0.1178 0.518(19) 0.0247 0.3663(22) 0.2573 178 Finland 7 0.1174 0.4654(20) 0.0182 0.5914(13) 0.2129 43 Russia 3 0.1168 0.4378(21) 0.0139 0.7566(9) 0.2 41 Philippines 11 0.1305 0.4373(22) 0.0122 0.8363(4) 0.3045 52 Germany 11 0.1309 0.3924(23) 0.0195 0.5617(17) 0.296 261 France 11 0.188 0.2796(24) 0.0531 0(34) 0.333 292 Netherlands 5 0.198 0.2714(25) 0.0169 0.6475(12) 0.25 42 Poland 11 0.191 0.2589(26) 0.0357 0.0778(33) 0.19 245 Norway 8 0.2362 0.2574(27) 0.0204 0.5027(18) 0.2625 45 Denmark 2 0.217 0.2467(28) 0.0218 0.429(20) 0.22 41 Sweden 11 0.2786 0.182(29) 0.0275 0.273(27) 0.2411 288 UK 11 0.3005 0.1555(30) 0.0303 0.1932(29) 0.2345 525 Israel 11 0.359 0.1326(31) 0.0192 0.5891(14) 0.2505 139 Australia 11 0.6681 0.0723(32) 0.0318 0.1694(31) 0.3 691 US 11 1.0826 0.023(33) 0.0275 0.2579(28) 0.3882 1,767 Canada 11 1.1213 0.0131(34) 0.025 0.3605(23) 0.2818 1,123
17
Table 2. Descriptive Statistics of Select Variables: Discretionary Accruals
count
mean
sd
min
p25
p50
p75
max
EM1 205,771 0.020 0.128 -0.357 -0.043 0.008 0.070 0.444 EM2 205,771 0.020 0.129 -0.364 -0.043 0.007 0.070 0.447 EM3 205,771 0.000 0.109 -0.391 -0.050 -0.001 0.048 0.365 EM4 205,771 0.001 0.109 -0.383 -0.050 -0.002 0.048 0.365 ABSEM1 205,771 0.089 0.094 0.000 0.023 0.055 0.119 0.444 ABSEM2 205,771 0.090 0.095 0.000 0.023 0.056 0.120 0.447 ABSEM3 205,771 0.076 0.079 0.000 0.021 0.049 0.101 0.391 ABSEM4 205,771 0.076 0.079 0.000 0.021 0.049 0.101 0.383 BTC(A) 205,771 0.469 0.315 0.000 0.188 0.414 0.786 1.000 BTC(W) 205,771 0.555 0.353 0.000 0.172 0.643 0.897 1.000 CTR 205,771 0.291 0.069 0.150 0.250 0.280 0.340 0.407 LEV 205,771 0.465 0.295 0.011 0.257 0.447 0.627 2.212 LOSS 205,771 0.296 0.456 0.000 0.000 0.000 1.000 1.000 LNTA 205,771 18.296 2.253 12.581 16.856 18.343 19.754 23.870 MBR 178,965 2.558 4.151 -6.232 0.672 1.351 2.826 36.628 JI 205,771 4.929 0.922 2.230 4.099 4.899 5.829 6.818 SI 205,771 4.770 0.589 3.035 4.366 4.906 5.244 6.371 IP 205,771 6.485 1.263 2.000 5.300 6.300 7.300 9.300 DBIGFOUR 205,771 0.391 0.491 0.000 0.000 0.000 1.000 2.000 DAUDITCHA 205,771 0.162 0.368 0.000 0.000 0.000 0.000 1.000 ROA 205,771 -0.035 0.283 -2.125 -0.020 0.027 0.069 0.343 CYCLE 186,908 0.251 0.617 -3.472 0.078 0.210 0.383 4.137 Variable Definitions:
𝐸𝐸𝐸𝐸1 = earnings management in consolidated financial statements of firm measured as signed values of discretionary accruals based on the Jones model in Equation (15); 𝐸𝐸𝐸𝐸2 = earnings management in consolidated financial statements of firm measured as signed values of discretionary accruals based on the Modified Jones model in Equation (16); 𝐸𝐸𝐸𝐸3 = earnings management in consolidated financial statements of firm measured as signed values of discretionary accruals based on the Performance Jones model in Equation (17); 𝐸𝐸𝐸𝐸4 = earnings management in consolidated financial statements of firm measured as signed values of discretionary accruals based on the Performance modified Jones model in Equation (18); 𝐷𝐷𝐵𝐵𝐿𝐿𝐸𝐸𝐸𝐸1 = earnings management in consolidated financial statements of firm measured as absolute values of discretionary accruals based on the Jones model in Equation (15); 𝐷𝐷𝐵𝐵𝐿𝐿𝐸𝐸𝐸𝐸2 = earnings management in consolidated financial statements of firm measured as absolute values of discretionary accruals based on the Modified Jones model in Equation (16); 𝐷𝐷𝐵𝐵𝐿𝐿𝐸𝐸𝐸𝐸3 = earnings management in consolidated financial statements of firm measured as absolute values of discretionary accruals based on the Performance Jones model in Equation (17); 𝐷𝐷𝐵𝐵𝐿𝐿𝐸𝐸𝐸𝐸4 = earnings management in consolidated financial statements of firm measured as absolute values of discretionary accruals based on the Performance modified Jones model in Equation (18); 𝐵𝐵𝐵𝐵𝐵𝐵(𝐷𝐷) = book-tax conformity of firm as measured by Atwood et al. (2010); 𝐵𝐵𝐵𝐵𝐵𝐵(𝑊𝑊)= book-tax conformity of firm as measured by Watrin et al. (2014); 𝐵𝐵𝐵𝐵𝐶𝐶= corporate tax rate of firm as measured by Watrin et al. (2014); 𝐿𝐿𝐸𝐸𝑉𝑉= leverage of firm calculated as the sum of liabilities divided by lagged total assets; 𝐿𝐿𝐿𝐿𝐿𝐿𝐿𝐿= dummy variable of firm equal to 1 if a firm reports a loss after tax,0 otherwise; 𝐿𝐿𝑆𝑆𝑆𝑆𝐸𝐸= size of firm calculated as the natural logarithm of firm’s lagged total assets; 𝐸𝐸𝐵𝐵𝐶𝐶= market-to-book ratio of firm; 𝐽𝐽𝑆𝑆= judicial independence of firm; 𝐿𝐿𝑆𝑆= protection of minority shareholder’s interest of firm; 𝑆𝑆𝑃𝑃= strength of investor protection of firm; 𝐷𝐷𝐵𝐵𝑆𝑆𝑁𝑁𝐷𝐷𝐿𝐿𝑈𝑈𝐶𝐶= dummy variable of firm equal to 1 if the firm’s auditor is one of Big 4,0 otherwise; 𝐷𝐷𝐷𝐷𝑈𝑈𝐷𝐷𝑆𝑆𝐵𝐵𝐵𝐵𝐷𝐷𝐷𝐷= dummy variable of firm equal to 1 if the firm’s auditor changed in previous year, 0 otherwise; 𝐶𝐶𝐿𝐿𝐷𝐷= return on asset of firm calculated as the after tax net income divided by lagged total assets; 𝐵𝐵𝐶𝐶𝐵𝐵𝐿𝐿𝐸𝐸= business cycle of firm calculated as the days receivable plus the days inventory less the days payable and then divided by 365.
18 Table 3. Descriptive Statistics of Select Variables: Compensation
count mean sd min p25 p50 p75 max
LNCOMP 51,251 25.976 1.718 20.016 24.927 26.154 27.188 29.343 BTC(A) 205,771 0.469 0.315 0.000 0.188 0.414 0.786 1.000 BTC(W) 205,771 0.555 0.353 0.000 0.172 0.643 0.897 1.000 CTR 205,771 0.291 0.069 0.150 0.250 0.280 0.340 0.407 LOSS 205,771 0.304 0.460 0.000 0.000 0.000 1.000 1.000 ROA 205,771 -0.039 0.271 -2.103 -0.024 0.026 0.066 0.295 ROAt-1 205,771 -0.035 0.283 -2.125 -0.020 0.027 0.069 0.343 STDROA 177,611 0.121 0.316 0.002 0.017 0.036 0.083 2.990 RET 178,988 0.198 0.928 -0.938 -0.276 -0.003 0.359 10.983 RETt-1 170,586 0.263 0.989 -0.940 -0.236 0.037 0.425 11.000 STDRET 143,695 0.821 1.070 0.067 0.308 0.516 0.902 10.011 LEV 205,770 0.543 0.607 0.006 0.269 0.472 0.680 12.983 CFO 205,771 0.019 0.210 -1.387 -0.015 0.050 0.111 0.478 MBR 178,965 2.558 4.151 -6.232 0.672 1.351 2.826 36.628 PPE 205,771 0.322 0.278 0.000 0.104 0.264 0.464 1.781 INTANG 205,771 0.040 0.101 0.000 0.000 0.000 0.029 0.740 INV 205,771 0.133 0.140 0.000 0.015 0.100 0.195 0.754 SIZE 205,771 18.296 2.253 12.581 16.856 18.343 19.754 23.870 DBIGFOUR 205,771 0.391 0.491 0.000 0.000 0.000 1.000 2.000 DAUDITCHA 205,771 0.162 0.368 0.000 0.000 0.000 0.000 1.000 Variable Definitions:
𝐿𝐿𝑁𝑁𝐵𝐵𝐿𝐿𝐸𝐸𝑃𝑃 = Firm’s CEO compensation calculated as the natural logarithm of CEO compensation; 𝐵𝐵𝐵𝐵𝐵𝐵(𝐷𝐷) = book-tax conformity of firm as measured by Atwood et al. (2010); 𝐵𝐵𝐵𝐵𝐵𝐵(𝑊𝑊)= book-tax conformity of firm as measured by Watrin et al. (2014); 𝐵𝐵𝐵𝐵𝐶𝐶= corporate tax rate of firm as measured by Watrin et al. (2014); 𝐿𝐿𝐿𝐿𝐿𝐿𝐿𝐿= dummy variable of firm equal to 1 if a firm reports a loss after tax,0 otherwise; 𝐶𝐶𝐿𝐿𝐷𝐷= return on asset of firm calculated as the after tax net income divided by lagged total assets; 𝐿𝐿𝐵𝐵𝐷𝐷𝐶𝐶𝐿𝐿𝐷𝐷= standard deviation of return on asset for the prior four years; 𝐶𝐶𝐸𝐸𝐵𝐵= firm’s return; 𝐿𝐿𝐵𝐵𝐷𝐷𝐶𝐶𝐸𝐸𝐵𝐵= standard deviation of firm’s return for the prior four years; 𝐿𝐿𝐸𝐸𝑉𝑉= leverage of firm calculated as the sum of liabilities divided by lagged total assets; 𝐵𝐵𝐷𝐷𝐿𝐿= cash flow operations of firm calculated as cash flow operations divided by lagged total assets; 𝐸𝐸𝐵𝐵𝐶𝐶= market-to-book ratio of firm; 𝑃𝑃𝑃𝑃𝐸𝐸= net property, plant and equipment of firm calculated as the net property, plant and equipment divided by lagged total assets; 𝑆𝑆𝑁𝑁𝐵𝐵𝐷𝐷𝑁𝑁𝑁𝑁= intangible asset of firm calculated as the sum of intangible asset divided by lagged total assets; 𝑆𝑆𝑁𝑁𝑉𝑉= inventory of firm calculated as the sum of inventory divided by lagged total assets; 𝐿𝐿𝑆𝑆𝑆𝑆𝐸𝐸= size of firm calculated as the natural logarithm of firm’s lagged total assets; 𝐷𝐷𝐵𝐵𝑆𝑆𝑁𝑁𝐷𝐷𝐿𝐿𝑈𝑈𝐶𝐶= dummy variable of firm equal to 1 if the firm’s auditor is one of Big 4,0 otherwise; 𝐷𝐷𝐷𝐷𝑈𝑈𝐷𝐷𝑆𝑆𝐵𝐵𝐵𝐵𝐷𝐷𝐷𝐷= dummy variable of firm equal to 1 if the firm’s auditor changed in previous year, 0 otherwise.
19 Table 4: Correlations: Discretionary Accruals
EM1 EM2 EM3 EM4 BTC(A) BTC(W) CTR LEV LOSS LNTA MBR
EM1 1.000 EM2 0.982*** 1.000 EM3 0.713*** 0.697*** 1.000 EM4 0.698*** 0.716*** 0.979*** 1.000 BTC(A) -0.095*** -0.096*** -0.008*** -0.011*** 1.000 BTC(W) -0.238*** -0.238*** -0.025*** -0.031*** 0.496*** 1.000 CTR 0.119*** 0.120*** 0.004 0.007** -0.593*** -0.258*** 1.000 LEV -0.064*** -0.062*** -0.014*** -0.011*** -0.080*** 0.001 0.131*** 1.000 LOSS 0.031*** 0.029*** 0.052*** 0.056*** -0.156*** -0.342*** 0.044*** 0.041*** 1.000 LNTA -0.027*** -0.028*** -0.057*** -0.057*** 0.114*** 0.233*** 0.037*** 0.075*** -0.349*** 1.000 MBR 0.033*** 0.037*** 0.011*** 0.014*** 0.027*** -0.087*** -0.034*** -0.032*** 0.026*** -0.082*** 1.000
20 Table 4 (continued)
EM1 EM2 EM3 EM4 BTC(A) BTC(W) CTR LEV LOSS LNTA
JI 0.109*** 0.110*** 0.023*** 0.025*** -0.574*** -0.454*** 0.278*** -0.067*** 0.253*** -0.074*** SI 0.106*** 0.106*** 0.016*** 0.018*** -0.386*** -0.413*** 0.170*** -0.071*** 0.215*** -0.079*** IP 0.147*** 0.147*** 0.024*** 0.026*** -0.373*** -0.466*** 0.325*** 0.004 0.220*** -0.104*** DBIGFOUR 0.026*** 0.026*** -0.032*** -0.031*** -0.053*** 0.005* -0.009*** -0.018*** -0.056*** 0.365*** DAUDITCHA -0.034*** -0.032*** 0.002 0.004 0.017*** 0.050*** 0.006** 0.023*** 0.021*** -0.041*** ROA -0.015*** -0.015*** -0.062*** -0.065*** 0.157*** 0.328*** -0.064*** -0.174*** -0.556*** 0.372*** CYCLE -0.031*** -0.031*** -0.008*** -0.008*** 0.126*** 0.148*** -0.071*** -0.099*** -0.072*** 0.044***
21 Table 4 (continued)
MBR JI SI IP DBIGFOUR DAUDITCHA ROA1 Cycle1
JI -0.022*** 1.000 SI -0.025*** 0.839*** 1.000 IP -0.067*** 0.421*** 0.471*** 1.000 DBIGFOUR -0.059*** 0.245*** 0.274*** 0.177*** 1.000 DAUDITCHA 0.008*** -0.064*** -0.082*** -0.046*** -0.122*** 1.000 ROA -0.085*** -0.253*** -0.205*** -0.191*** 0.070*** -0.016*** 1.000 CYCLE -0.046*** -0.145*** -0.102*** -0.094*** -0.053*** -0.002 0.135*** 1.000
22 Table 5: Correlations: Compensation
LNCOMP BTC(A) BTC(W) CTR LOSS ROA ROAt-1 STDROA RET RETt-1 STDRET
LNCOMP 1.000 BTC(A) -0.198*** 1.000 BTC(W) -0.361*** 0.496*** 1.000 CTR 0.123*** -0.593*** -0.258*** 1.000 LOSS -0.141*** -0.147*** -0.345*** 0.043*** 1.000 ROA 0.108*** 0.162*** 0.348*** -0.066*** -0.569*** 1.000 ROAt-1 0.096*** 0.157*** 0.328*** -0.064*** -0.455*** 0.683*** 1.000 STDROA -0.098*** -0.114*** -0.314*** 0.026*** 0.336*** -0.578*** -0.577*** 1.000 RET -0.038*** -0.034*** -0.068*** 0.017*** 0.016*** -0.032*** -0.087*** 0.065*** 1.000 RETt-1 -0.024*** -0.010*** -0.054*** -0.021*** -0.022*** 0.016*** -0.023*** 0.070*** -0.084*** 1.000 STDRET -0.155*** -0.009*** -0.204*** -0.013*** 0.195*** -0.213*** -0.213*** 0.289*** 0.249*** 0.269*** 1.000
23 Table 5 (continued)
LNCOMP BTC(A) BTC(W) CTR LOSS ROA ROAt-1 STDROA RET RETt-1 STDRET
LEV 0.004 -0.050*** -0.047*** 0.046*** 0.023*** -0.095*** -0.164*** 0.133*** 0.015*** 0.052*** 0.049*** CFO 0.129*** 0.120*** 0.269*** -0.026*** -0.472*** 0.683*** 0.664*** -0.482*** -0.024*** -0.056*** -0.216*** MBR 0.080*** 0.027*** -0.087*** -0.034*** 0.006* -0.051*** -0.085*** 0.111*** -0.085*** 0.246*** 0.124*** PPE -0.093*** 0.029*** -0.036*** -0.021*** 0.055*** 0.072*** -0.002 -0.018*** 0.033*** 0.090*** 0.105*** INTANG 0.210*** -0.011*** -0.200*** -0.027*** 0.048*** -0.056*** -0.072*** 0.040*** 0.008** 0.018*** 0.002 INV -0.053*** 0.150*** 0.178*** -0.046*** -0.239*** 0.206*** 0.175*** -0.175*** -0.006* 0.027*** -0.062*** SIZE 0.610*** 0.114*** 0.233*** 0.037*** -0.338*** 0.355*** 0.372*** -0.368*** -0.093*** -0.076*** -0.257*** DBIGFOUR 0.454*** -0.053*** 0.005* -0.009*** -0.061*** 0.075*** 0.070*** -0.099*** -0.030*** -0.052*** -0.140*** DAUDITCHA -0.087*** 0.017*** 0.050*** 0.006** 0.017*** -0.013*** -0.016*** 0.014*** -0.009*** 0.011*** 0.024***
24 Table 5 (continued)
LEV CFO MBR PPE INTANG INV SIZE DBIGFOUR DAUDITCHA
LEV 1.000 CFO -0.121*** 1.000 MBR 0.046*** -0.124*** 1.000 PPE 0.069*** 0.052*** -0.034*** 1.000 INTANG 0.085*** -0.041*** 0.122*** -0.155*** 1.000 INV 0.142*** 0.088*** -0.009*** -0.070*** -0.061*** 1.000 SIZE -0.051*** 0.373*** -0.082*** 0.003 0.070*** 0.081*** 1.000 DBIGFOUR -0.043*** 0.097*** -0.059*** -0.047*** 0.051*** -0.070*** 0.365*** 1.000 DAUDITCHA 0.027*** -0.019*** 0.008*** 0.003 -0.010*** 0.013*** -0.041*** -0.122*** 1.000
25 Table 6, Panel A Results of Regressions: Discretionary Accruals
Predicted Sign EM1 EM2 EM3 EM4
Constant -0.0172 -0.0157 0.0716*** 0.0707*** (-1.31) (-1.21) (12.68) (12.41) BTC(A) - -0.0390*** -0.0391*** -0.00969*** -0.0102*** (-7.39) (-7.23) (-4.30) (-4.44) DNEG -0.179*** -0.180*** -0.146*** -0.146*** (-37.70) (-37.54) (-45.51) (-45.63) DNEG*BTC + 0.0500*** 0.0490*** 0.0270*** 0.0262*** (8.56) (8.30) (6.53) (6.33) LEV 0.00262* 0.00208 -0.00136 -0.00134 (1.68) (1.30) (-1.28) (-1.23) LOSS -0.000752 -0.00134 -0.00292*** -0.00280*** (-0.64) (-1.12) (-4.41) (-4.27) JI -0.00793*** -0.00810*** 0.000530 0.0000596 (-4.16) (-4.15) (0.72) (0.08) SI 0.0126*** 0.0126*** -0.00161 -0.00104 (4.84) (4.64) (-1.55) (-1.08) IP 0.00727*** 0.00714*** 0.000989*** 0.000926*** (6.50) (6.33) (3.47) (3.22) DBIGFOUR -0.00131* -0.00138* -0.00118*** -0.00131*** (-1.78) (-1.84) (-2.70) (-3.05) DAUDITCHA -0.00437*** -0.00407*** -0.000909* -0.000488 (-6.08) (-5.59) (-1.91) (-1.02) CYCLE -0.00267*** -0.00282*** -0.00138*** -0.00125*** (-5.22) (-5.40) (-3.01) (-2.66) ROA 0.0124*** 0.0117*** -0.0179*** -0.0186*** (4.14) (3.91) (-8.12) (-8.52) LNTA 0.00150*** 0.00154*** -0.000152 -0.0000866 (3.85) (3.93) (-1.01) (-0.58) MBR 0.000875*** 0.000956*** 0.000330*** 0.000421*** (8.27) (9.04) (4.45) (5.63)
YEAR fixed effect Yes Yes Yes Yes
Industry fixed effect Yes Yes Yes Yes
Country fixed effect Yes Yes Yes Yes
N 163,195 163,195 163,195 163,195
R^2a 0.474 0.475 0.479 0.480