Effects of Dietary Protein, Lipid, and
Digestible Carbohydrate Levels on the Weight
Gain, Feed Conversion Efficiency, and Protein
Efficiency Ratio of Tilapia nilotica
著者
TESHIMA Shin-ichi, KANAZAWA Akio, UCHIYAMA
Yoshihiro
journal or
publication title
南海研紀要
volume
6
number
1
page range
56-71
URL
http://hdl.handle.net/10232/15661
56 Mem. Kagoshima Univ. Res. Center S. Pac, Vol.6. No. I, 1985
Effects of Dietary Protein, Lipid, and Digestible
Carbohydrate Levels on the Weight Gain, Feed
Conversion Efficiency, and Protein Efficiency
Ratio of Tilapia nilotica*
Shin-ichi Teshima**, Akio KANAZAWA**, and Yoshihiro UcHIYAMA*
Abstract
Feeding trials using purified diets, designed as 2-way layout experiments, were
conducted to examine the effects of dietary protein (casein), lipid (a 1 to 1 mixture of
soybean oil and pollack liver oil), and digestible carbohydrate (dextrin) on the growth of Tilapia nilotica in terms of weight gain, feed conversion efficiency, and protein efficiency ratios. Tilapia fingerlings grew best on diets containing 40% protein, 12%
lipid and 30% digestible carbohydrate. When the dietary lipid level was fixed at 10%, good growth was obtained with 30% protein + 40% digestible carbohydrate, 40% protein + 30% digestible carbohydrate, and 30% protein + 30% digestible carbo hydrate. The optimum digestible energy for T. nilotica was around 380-410 kcal/100 g diet. It also seems likely that T. nilotica utilizes lipids more effectively than digestible carbohydrates as energy sources when receiving the 35% protein-diets which meet the protein requirement. These results indicate that T. nilotica fingerlings grow optimally on deits containing 30-40% protein, 12-15% lipids, and 30-40% digestible
carbohydrate.
Introduction
Tilapia has been intensively cultivated by fish-farmers in Japan since about 1970
using formula diets. However, most of the nutritional studies on any Tilapia species
were concerned with supplemental feeding in extensive ponds (STICKNEY and Hesby, 1977; Collins and Smitherman, 1978; Miller, 1978). Several studies have inves tigated the protein requirements of Tilapia using test diets (Davis and STICKNEY, 1978 ; Mazid et al., 1978, 1979 ; Teshima et al., 1978 ; Jauncey, 1982 ; Kesamaru et al.,
* This work was presented at the meeting of the Japanese Society of Scientific Fisheries, held in Tokyo, April, 1984:
* * Laboratory of Marine Nutritional Chemistry, Faculty of Fisheries, Kagoshima University, 50-20
Mem. Kagoshima Univ. Res. Center S. Pac, Vol.6, No. I, 1985 57
1982). In these studies, however, the protein requirements were determined using isocaloric diets with varying protein levels, whose energy levels were fixed arbitrarily with lipids and/or carbohydrates. The protein requirements of fish are likely to vary with the dietary levels of lipids and carbohydrates used as the major energy sources along with types of proteins used (Adron et al., 1976 ; Garling and Wilson, 1976). In the present study, therefore, we intend to estimate the optimum dietary protein levels for Tilapia nilotica in relation to the lipid and carbohydrate levels in diets containing casein as a sole protein source. The feeding experiments were designed as two-way layout experiments (3x3 types) (Ishikawa et al., 1967), and the results were evaluat ed statistically.
Materials and Methods
The fingerlings of T. nilotica were obtained from commercial Tilapia farms in Kagoshima (either Fuji-Enterprise or Shiroyama-gosan Co.) and maintained on a commercial carp ration for about 1 week prior to feeding trials using test diets. Three feeding experiments were conducted to clarify the effects of protein, lipid, and digest ible carbohydrate levels in diets on growth of T. nilotica. In feeding trials, experimen tal groups were designed as two-way layout experiments, regarding dietary protein, lipid, and digestible carbohydrate levels as factors P, L, and C, respectively. The fingerlings were reared for 4 weeks in every feeding trial under the conditions given in Table 1. In Experiments I and II, feeding trials were replicated.
Table 1. Experimental conditions on the feeding trials of T. nilotica
Experiment-1 Experiment-II Experiment-Ill
Trial-1 Trial-2 Trial-I Trial-2 Trial-I
Date of experiment August December October December October
Feeding period (weeks) 4 4 4 4 4
Initial body weight (g) 1.29 1.60 0.88 1.58 0.88
Number of fish/tank (30 /) 15 12 15 12 15
Feeding level of diets*1 7% 1% 1% 1% 1%
Daily feeding frequency*2 Twice Twice Twice Twice Twice Water temperature (°C) 27-29 25-27 27-29 25-27 26-28
* 1 The basal ration of test diets was similar to that of the purified diet for T. zillii used in the previous study (Teshima et at., 1978). Test diets contained the following ingredients
(% of dry diets) : casein (20, 30 or 40), dextrin (10, 20, 30 or 40), pollack liver oil-soybean
oil (1:1, w/w) (3, 4, 9, II, 14 or 19), linoleic acid (1.0), L-tryptophan (0.5), L-methionine (0.5). minerals (4.0). vitamins (1.0), agar (3.0), and a-cellulose (equal to 100%). The pH
value of diets was adjusted to 7.0.
58 TESHIMA et al. : Effects of Nutrient Levels in Diets on Growth of Tilapia
The base ration of test diets was similar to that of the purified diets for T. zillii
(Teshima et al., 1978). The test diets contained varying levels of protein, lipid, and/ or digestible carbohydrate using casein, pollack liver oil-soybean oil (1 : 1), and dextrin ; respectively. The composition of the test diets appears in Tables 1, 2, 4, and 6. The methods for preparing the feed and of rearing the fingerlings were described previously (Teshima et al., 1978).
The diets were evaluated in terms of body weight gain (%), feed conversion
efficiency (FCE), and protein efficiency ratio (PER). FCE is the weight gain (g) offish divided by the weight (g) of dry feed intaked. PER is the weight (g) of fish divided by
the weight (g) of protein intaked. The feeding trial data were analyzed using analysis of variance. The effects of dietary protein, lipid, and carbohydrate levels, and their interactions on weight gain, FCE, and PER were evaluated statistically.
Digestible energy (DE) levels were provisionally calculated by using the following values; protein 4.5, lipids 9.0, and digestible carbohydrate 4.0 kcal/g.
Results
In Experiment I, the effects of dietary protein and lipid levels on the growth of T.
nilotica were examined with 9 diets containing varying levels of protein (20%, 30%, and
40%) and lipid (4%, 12%, and 20%) and with a fixed digestible carbohydrate level of 30%. Tables 2 and 3 and Fig. 1 show the results of Experiment I. The analysis of
variance (Table 3) showed that the weight gain of T. nilotica varied significantly (P<
0.01) with both dietary protein and lipid levels examined. The FCE and PER of diets
were also significantly (P<0.01) different with both dietary protein and lipid levels. A
significant difference was not detected in the interaction between protein and lipid
levels for weight gain, FCE and PER. Fig. 1 shows the effects of dietary protein and
lipid levels on the weight gain, FCE, and PER in T. nilotica. The weight gain and
FCE increased with increasing levels of protein from 20% to 40% and lipid from 4% to 12%. However, further increases in lipid levels from 12% to 20% did not show a
significant improvement of weight gain and FCE. The PER decreased significantly as the dietary protein levels were increased, whereas it increased slightly with the increas
ing lipid levels in the diets. This indicates that dietary protein could be utilized more efficiently in a high-lipid diet than in a low-lipid diet, suggesting a protein-sparing effect of lipids. From the results of Experiment I, T. nilotica is likely to obtain
optimum growth on the diets containing 40% protein and 12% lipid when the dietary
digestible carbohydrate level is fixed at 30%.
In Experiment II, the dietary lipid level was fixed at 10%, and the effects of dietary
protein and digestible carbohydrate levels on growth of T. nilotica were examined with
9 diets containing varying levels of protein (20%, 30%, and 40%). The results of Experiment II are given in Tables 4 and 5, and Fig. 2 and 3. The analysis of variance for the data from Experiment II (Table 5) showed that the weight gain of Tilapia varied
Mem. Kagoshima Univ. Res. Center S. Pac. Vol.6, No. I, 1985 59
significantly (P<0.01) with both dietary protein and digestible carbohydrate levels examined. The FCE varied with both dietary protein and digestible carbohydrate levels significantly at the 10% level but not significantly at the 5% level. The PER was significantly (P<0.01) different with dietary protein levels but not with the digestible carbohydrate levels examined. The interaction between protein and digestible carbo hydrate levels was not significant with the FCE and PER data but significant (P<0.01)
with the weight gain data. Fig. 2 show the effects of dietary protein and digestible
carbohydrate levels on weight gain, FCE, and PER which were estimated without regard to the interaction between protein and digestible carbohydrate levels. The FCE was improved with increasing protein levels from 20% to 40% and also with the increasing digestible carbohydrate levels from 20% to 40%, but it did not vary signifi cantly with the increase in digestible carbohydrate levels from 30% to 40%.
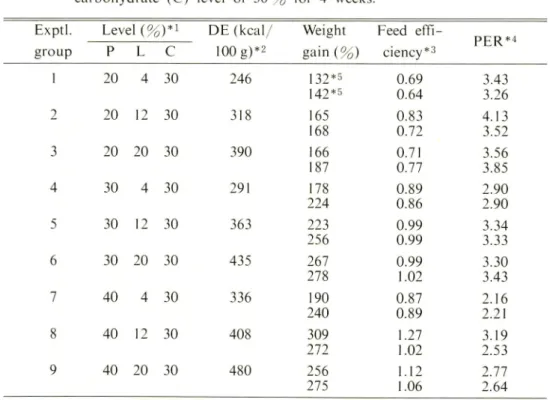
Table 2. Results of Experiment-I. The fish were fed the diets containing different levels of protein (P) and lipid (L) at the fixed digestible carbohydrate (C) level of 30 % for 4 weeks.
Exptl. group Level (%)*! P L C DE(kcal/ 100 g)*2 Weight gain(%) Feed effi ciency*3 PER*4 1 20 4 30 246 132 *5 142*5 0.69 0.64 3.43 3.26 2 20 12 30 318 165 168 0.83 0.72 4.13 3.52 3 20 20 30 390 166 187 0.71 0.77 3.56 3.85 4 30 4 30 291 178 224 0.89 0.86 2.90 2.90 5 30 12 30 363 223 256 0.99 0.99 3.34 3.33 6 30 20 30 435 267 278 0.99 1.02 3.30 3.43 7 40 4 30 336 190 240 0.87 0.89 2.16 2.21 8 40 12 30 408 309 272 1.27 1.02 3.19 2.53 9 40 20 30 480 256 275 1.12 1.06 2.77 2.64
* 1 The dietary protein and lipid levels were adjusted with casein and pollack liver oil-soybean oil (1 : 1), respectively.
#2 Provisional digestive energy (DE) : protein, 4.5 kcal/g ; lipid, 9.0 kcal/g ;
digestible carbohydrate, 4.0 kcal/g. *3 Feed conversion efficiency =g gain/g feed.
#4 Protein efficiency ratio = g gain/g protein intaked.
60 Teshima et al. : Effects of Nutrient Levels in Diets on Growth of Tilapia
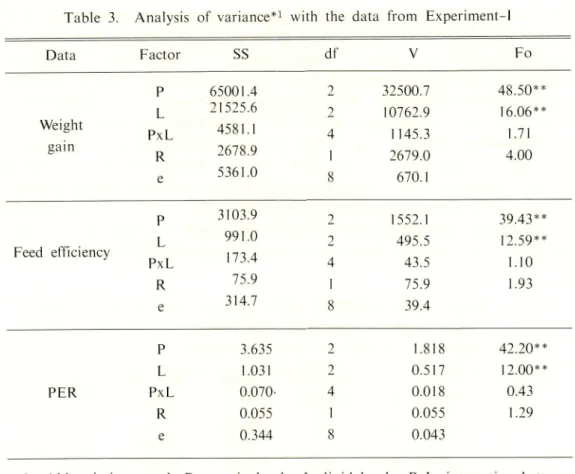
Table 3. Analysis of variance*1 with the data from Experiment-1
Data Factor SS df V Fo P 65001.4 2 32500.7 48.50** L 21525.6 2 10762.9 16.06** Weight PxL 4581.1 4 1145.3 1.71 gain R 2678.9 1 2679.0 4.00 e 5361.0 8 670.1 P 3103.9 2 1552.1 39.43** L 991.0 2 495.5 12.59** Feed efficiency PxL 173.4 4 43.5 1.10 R 75.9 I 75.9 1.93 e 314.7 8 39.4 P 3.635 2 1.818 42.20** L 1.031 2 0.517 12.00** PER PxL 0.070- 4 0.018 0.43 R 0.055 1 0.055 1.29 e 0.344 8 0.043
#1 Abbreviations used: P, protein levels; L, lipid levels; PxL, interaction between factors P and L ; R, variability of data between the feeding trials ; e, error; SS, sum of squares; df, degree of freedom; V. variance ; Fo, variance ratio. Two asterisks (**) indicate a statistically significant difference (P<0.0l).
As for the weight gain data, a significant interaction was detected between protein
and digestible carbohydrate levels (Table 5). This implies that the effects of dietary
protein and digestible carbohydrate levels on the weight gain of T. nilotica were
variable with the dietary level of a counterpart of each other. Fig. 3 shows the effects of dietary protein and digestible carbohydrate levels on weight gains which were
estimated in consideration of the interaction. The weight gain of Tilapia increased as
dietary proein levels were increased from 20% to 40% in the case of the diets containing
20% and 30% levels of digestible carbohydrate. As for the 40% carbohydrate-diets, the
weight gain of Tilapia increased with increasing protein levels from 20% to 30%, but
decreased at the 40% protein level. The effect of digestible carbohydrate levels in diets resembled that of dietary protein levels. The increases in digestible carbohydrate levels from 20% to 40% resulted in improvement of weight gain, except for the case of the diet containing 40% protein and 40% carbohydrate. In Experiments II, the highest weight
Mem. Kagoshima Univ. Res. Center S. Pac, Vol.6, No. 1, 1985 260 r 220 -180 140 0.8 -0.5 -4.3 r 2.4 1.5 _L 20 30 Protein (%) 20 30 Protein {%) 20 30 Protein (%) _ i 40 40 i . 40 260 220 180 140 0.£ 0.5 -4.3 2.4 -J_ 4 12 20 Lipid {%) 4 12 Lipid (%) 4 12 Lipid {%) _ i _ 20 20
Fig. 1. The effects of dietary protein and lipid levels on growth of
T. nilotica. The means and confidence limits (P=0.95) for weight gain, feed conversion efficiency, and protein efficiency ratio were estimated from the data of Experiment-I.
62 Teshima et al.: Effects of Nutrient Levels in Diets on Growth of Tilapia
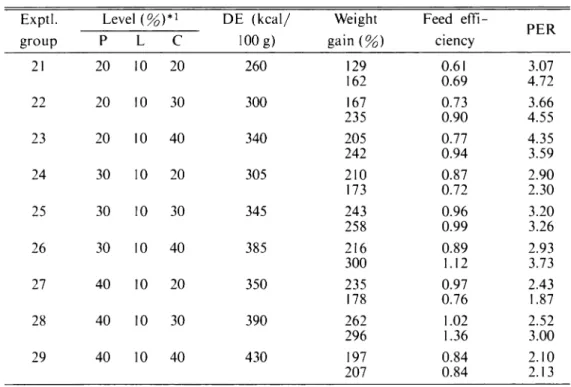
Table 4. Results of Experiment-II. The fish were fed the diet containing different levels of protein (P) and digestible carbohydrate (C) at the fixed lipid (L) level of 10.0% for 4 weeks.
Exptl. Level (%)*! DE (kcal/ 100 g) Weight gain(%) Feed effi ciency PER group P L c 21 20 10 20 260 129 162 0.61 0.69 3.07 4.72 22 20 10 30 300 167 235 0.73 0.90 3.66 4.55 23 20 10 40 340 205 242 0.77 0.94 4.35 3.59 24 30 10 20 305 210 173 0.87 0.72 2.90 2.30 25 30 10 30 345 243 258 0.96 0.99 3.20 3.26 26 30 10 40 385 216 300 0.89 1.12 2.93 3.73 27 40 10 20 350 235 178 0.97 0.76 2.43 1.87 28 40 10 30 390 262 296 1.02 1.36 2.52 3.00 29 40 10 40 430 197 207 0.84 0.84 2.10 2.13
* 1 The protein and digestible carbohydrate levels were adjusted with casein and dextrin, respectively.
carbohydrate. However, a significant difference (P<0.05) was not detected among the 3 diets containing the following levels of protein and digestible carbohydrate ; 30%
protein + 40% carbohydrate, 40% protein + 30% carbohydrate, and 30% protein + 30%
carbohydrate.
The results of Experiments I and II suggest that the optimum dietary protein level for T. nilotica is about 30-40%, although it varies with the levels and kinds of
non-protein energy souces such as lipids and digestible carbohydrates when casein was used as a protein source. In Experiment III, feeding trials were conducted to clarify the availability of dietary lipids and digestible carbohydrate by T. nilotica when the diets contained sufficient protein for meeting the protein requirement. T. nilotica fingerlings were fed 9 diets containing varying levels of lipids (5%, 10%, and 15%) and digestible carbohydrate (20%, 30%, and 40%) at a fixed protein levels of 35%. The results of Experiment III are shown in Tables 6 and 7, and Fig. 4. The analysis of variance (Table 7) showed that the weight gain of T. nilotica was significantly different with dietary lipids (P<0.01) and digestible carbohydrate (P<0.05) levels. The FCE and PER were also significantly different with the lipid levels examined (P<0.01) but not with the digestible carbohydrate levels. Fig. 4. shows the effects of dietary lipid and
260 r 220 -180 140 1.1 r 0.8 " 0.5 -4.3 2.4 1.5
-Mem. Kagoshima Univ. Res. Center S. Pac, Vol.6, No. I, 1985
20 30 Protein (%) 20 30 Protein (%) _i_ 20 30 Protein (%) 40 i_ 40 40 260 220 -180 140 -1.1 0.8 0.5 20 30 40 Carbohydrate (%) 20 30 40 Carbohydrate (%) 4.3 I
~j
2.4- r ^
i
1.5 i i i , 20 30 Carbohydrate (%) 40Fig. 2. The effects of dietary protein and digestible carbohydrate
levels on growth of T nilotica. The means and confidence
limits (P=0.95) for weight gain, feed conversion efficiency, and
protein efficiency ratio were estimated from the data of Experiment-II.
TESHIMA et al. : Effects of Nutrient Levels in Diets on Growth of Tilapia
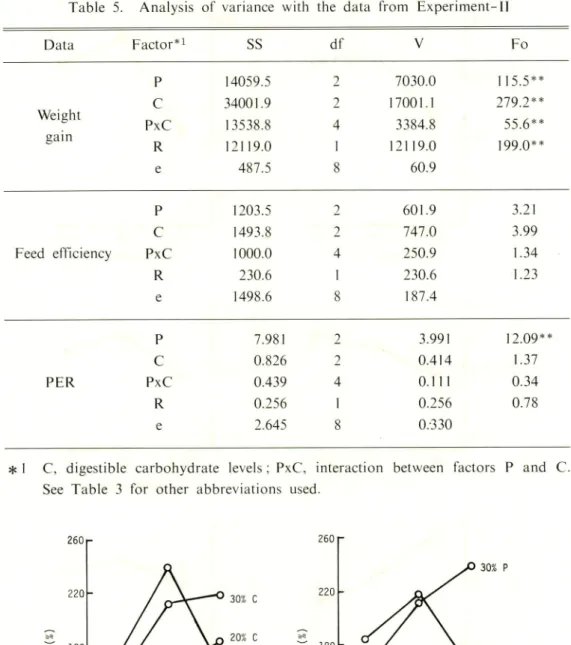
Table 5. Analysis of variance with the data from
Experiment-Data Factor*1 SS df V Fo P 14059.5 2 7030.0 115.5** Weight C 34001.9 2 17001.1 279 2** PxC 13538.8 4 3384.8 55.6** gain R 12119.0 1 12119.0 199.0** e 487.5 8 60.9 P 1203.5 2 601.9 3.21 C 1493.8 2 747.0 3.99 Feed efficiency PxC 1000.0 4 250.9 1.34 R 230.6 1 230.6 1.23 e 1498.6 8 187.4 P 7.981 2 3.991 12.09** C 0.826 2 0.414 1.37 PER PxC 0.439 4 0.111 0.34 R 0.256 1 0.256 0.78 e 2.645 8 0.330
* 1 C, digestible carbohydrate levels : PxC, interaction between factors P and C.
See Table 3 for other abbreviations used.
260r 220 140 120 20 30 Protein (%) 30% C 20% C 40% C 40 260 P 220 180 -140 120 30% P 20 30 40 Carbohydrate (%)
Fig. 3. The effects of dietary protein and digestible carbohydrate levels on weight
gain of T. nilotica, which were evaluated from the data of Experiment-II in
Mem. Kagoshima Univ. Res. Center S. Pac, Vol. 6. No. 1, 1985 65
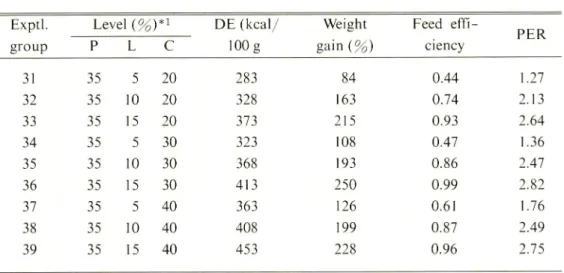
Table 6. Results of Experiment-Ill. The fish were fed the diets containing different
levels of lipid (L) and digestible carbohydrate (C) at the fixed protein (P) level of 35 % for 4 weeks.
Exptl. Level {%j*i DE (kcal/
100 g Weight gain(%) Feed effi ciency PER group P L C 31 35 5 20 283 84 0.44 1.27 32 35 10 20 328 163 0.74 2.13 33 35 15 20 373 215 0.93 2.64 34 35 5 30 323 108 0.47 1.36 35 35 10 30 368 193 0.86 2.47 36 35 15 30 413 250 0.99 2.82 37 35 5 40 363 126 0.61 1.76 38 35 10 40 408 199 0.87 2.49 39 35 15 40 453 228 0.96 2.75
* I The lipid and digestible carbohydrate levels were adjusted with pollack liver
oil-soybean oil (1:1) and dextrin, respectively.
Table 7. Analysis of variance with the data from Experiment-Ill
Data Factor SS df V Fo*1
Weight C 3691.4 2 1845.8 7.88* gain L e 49163.1 937.5 2 4 24581.6 234.3 104.91** C 183.7 2 91.8 3.61 Feed efficiency L 3183.4 2 1591.8 62.62** e 101.9 4 25.4 C 0.096 2 0.049 1.04 PER L 2.582 2 1.290 27.39** e 0.191 4 0.047
*1 Asterisks indicate significant differences (*, P<0.05 ; **, P<0.01
digestible carbohydrate levels on the weight gain, FCE, and PER. The weight gain improved with the increase in lipid levels from 5% to 15% and also with the increase in digestible carbohydrate levels from 20% to 30%. But the increase in digestible carbohydrate levels from 30% to 40% did not result in a significant increase in weight gains. The increase in lipid levels from 5% to 10% or 15% was effective in improving
66 Teshima et al. : Effects of Nutrient Levels in Diets on Growth of Tilapia 240 200 160 120 -l.Or 0.7 0.4 1.3r 2.4 1.5 20 30 40 Carbohydrate (%) 20 30 40 Carbohydrate (%)
^—I
?
_L 20 30 40 Carbohydrate {%) 240 r »• 200 160 120 1.0 r 0.7 0.4 4.3 p 2.4 1.5 5 10 Lipid (%) 5 10 Lipid (%) _J_ 15 5 10 15 Lipid (%)Fig. 4. The effects of dietary lipid and digestible carbohydrate levels on growth of T. nilotica. The means and confidence limits (P=0.95) for weight gain, feed conversion efficiency, and protein efficiency ratio were estimated from the data of
300 260 220 180 140 100
Mem. Kagoshima Univ. Res. Center S. Pac, Vol.6, No. I, 1985
30% P .. 20% P. 30% P ••' ' .•
m\.
,i>"'"
• /.Q 0ti/.i
o o ; 20% p O 40% C(35% P)6 30% C(35% P)
O20%C(35%P) 1 1 1 1— 30% P 40% p 240 280 320 360 400Digestible energy (Kal/100 g)
Fig. 5.
The effect of digestible energy levels in diets on weight gain of T. nilotica.
The marks A, # and (J in the figure shows the data obtained from
Experiments I, II, and III, respectively. P and C indicate dietary protein and
digestible carbohydrate levels, respectively.
440
67
40% P
480
the FCE and PER, whereas that in digestible carbohydrate levels from 20% to 40% had
no significant effect on these parameters. This suggests that T nilotica possibly utilizes
lipids more effectively than digestible carbohydrates as energy sources in the 35 %
protein-diet which probably meets the protein requirements of this fish. The results
of Experiment III show that T. nilotica probably obtains the optimum growth on diets
containing 15% lipid and 30% digestible carbohydrate when the dietary protein
level is fixed at 35 %.
Fig. 5. shows the relationship between DE (kcal/100 g diet) and weight gain (%)
of T. nilotica. The effects of DE and DE/P ratio [DE (kcal/kg)/ protein (%)] on the
weight gain varied with dietary protein levels. In the 20% protein-diets, the weight gain
improved with increasing DE levels, but the growth of Tilapia was very poor as
compared with the diets containing higher protein levels. In the 30% protein-diets, the
weight gain also improved with the increasing DE levels and showed the highest value
at a DE level of 385 (diet 26, DE/P = 128) and 435 (diet 6, DE/P = 145). In the 35%
protein-diets, the highest weight gain was attained at a DE level of 413 (diet 36, DE/
P = 118). In the 40% protein diets, the highest weight gain was obtained at a DE level
of 390 (diet 28, DE/P = 97.5) and 408 (diet 8, DE/P = 102), however it decreased
slightly (diet 9) or markedly (diet 29) when the DE levels exceed more than 430. These68 Teshima et al. : Effects of Nutrient Levels in Diets on Growth of Tilapia
results show that the optimum DE levels are about 380-410 kcal/100 g when diets contain the minimum amount of protein to satisfy the protein requirement of T
nilotica. Also, the present study suggests that the optimum DE/P ratio for T. nilotica
is likely to decrease with the increasing protein levels in diets from 30% to 40%. Considering the results of Experiments I, II and III together, it is concluded that 77. nilotica grows best when the diets contain 30-40% protein, 12-15% lipid, and 30-40% digestible carbohydrate under the conditions adopted in the present study.
Discussion
Tilapia are generally regarded as herbivorous and omnivorous fish. In fact, Houser (1975) and Bayne et al. (1976) have shown that vegetable proteins could be used in large quantities successfully in Tilapia diets. Davis and Stickney (1978) have demonstrated that 77. aurea grew well on diets with soybean meal as the protein source. As for Sarotherodon mossambicus, some plant proteins have been revealed to be usable in diets as partial substitutes for fish meal (Jackson et al., 1982). In the case of 77.
nilotica, however, Kesamaru and Miyazono (1978a) have shown that the dietary
value of soybean meal was inferior to that of animal proteins such as a white fish meal, brown fish meal, and silkworm pupa meal. Interestingly, they have demonstrated that a wheat germ protein had a high dietary value comparable to white fish meal for 77.
nilotica, suggesting that the optimum dietary protein levels for this fish is about 40%
when a white fish meal was used as a sole protein source (Kesamaru and Miyazono, 1978a, 1978b).
Apart from the above studies using formula diets composed of natural ingredients, the protein requirements of Tilapia species have been investigated by several groups of workers using the purified diets containing casein as a sole protein source. Previously we have shown that the optimum dietary protein level for T. zillii was 35-40% (Te
shima et al., 1978). Mazid et al. (1979) have also revealed that the same species of
Tilapia required about 35% protein for optimum growth while 30% protein for
maximum body protein deposition. Kesamaru et al. (1982) have demonstrated that 77. nilotica showed the best growth on a diet with 40% protein. In these studies using purified diets, however, the optimum dietary protein levels were determined by one-way layout experiments without regard to the variabilities of experimental data. Also, only a little information on the relationship between the protein requirements
and dietary energy levels in 77. nilotica is available* .
In the present study, the optimum dietary protein level for growth of T. nilotica was examined using purified diets containing casein as a sole protein source in relation to the dietary energy levels which were altered with either lipids or digestible
carbo-* While this work was in press, Wang el al. (1985a, 1985b) published a paper on the optimum dietary protein and digestible energy levels for T. nilotica.
Mem. Kagoshima Univ. Res. Center S. Pac, Vol.6. No. 1, 1985 69
hydrate, and the data obtained were statistically evaluated. Growth of 77. nilotica improved with increasing protein and lipid levels irrespective of one another's level
when the diets contained 30% digestible carbohydrate. Whereas, the effects of dietary
protein and digestible carbohydrate levels on growth were affected with the levels of a counterpart of each other when dietary lipid levels were fixed at 10%. The increase in protein levels from 20% to 30% and digestible carbohydrate levels from 20% to
30% resulted in a marked improvement of growth. However, further increases in protein
levels from 30% to 40% and digestible carbohydrate levels from 30% to 40% did not
show a marked improvement of growth. Particularly, growth of T. nilotica was suppress ed when fed the 40% protein-diet containing higher levels of non-protein energy
sources such as 40% digestible carbohydrate and 10% lipids. The optimum dietary
protein levels for T. nilotica thus varied with the kind and dietary level of non-protein energy sources, lipids and carbohydrate. In the present study, the optimum dietary
protein level for T nilotica fingerlings was estimated to be 30-40% in diets when casein was used as a sole protein source and sufficient energy was provided with soybean oil-pollack liver oil (1 : 1) and dextrin. The optimum dietary protein levels for T nilotica obtained in the present study are apparently similar to those reported for Tilapia species which had been assessed using casein (Teshima et al, 1978; Mazid et al, 1979;
Kesamaru et al, 1982) and other protein sources (Davis and STICKNEY, 1978: Winfree and Stickney, 1981 ; Viola and Arieli, 1982; Jauncey, 1982).
The present study also showed that the weight gain of T. nilotica improved with increasing DE levels, indicating that the optimum level was around 380-410 kcal/100 g. This value was slightly lower than the optimum DE level for the rainbow trout Salmo
gairdneri (Takeuchi et al., 1978) and was higher than that for the carp Cyprinus
carpio (Takeuchi et al., 1979).
Mazaid et al. (1978) have shown that T. zillii required the same 10 amino acids reported to be essential for other fish. Jackson et al. (1982) have also pointed out that the nutritive value of dietary protein for 5. inossambicus was related to the content of essential amino acids. Moreover, Bowen (1980) has repoted that S. mossambicus in Lake Valencia, Venezuela, grew rapidly on a low-protein diet by assimilating detrital non-protein amino amino acids. The above information supposes that the protein requirements of Tilapia are variable with the quality of protein sources used. Accordingly, we think that the protein requirements of Tilapia should be examined in further detail in the future in relation to the amino acid pattern of dietary proteins along with the kind and level of non-protein energy sources. To obtain a reliable answer to these question, it may desirable to replicate the feeding experiments in a factorial design.
Acknowledgement
70 Teshima et al. : Effects of Nutrient Levels in Diets on Growth of Tilapia
Masamoto, Fuji-enterprise Co., for supplying Tilapia fingerlings during this study.
References
Adron, J. W., Blair, A., Cowey, C. B., and Shanks, A. M., 1976, Effect of dietary
level and energy source on growth, feed conversion and body composition of
turbot (Scophthalamus maximus L.). Aquaculture, 7, 125-132.
Bayne, D. R., Dunseth, D., and Ramirios, C. G., 1976, Supplemental feed containing coffee pulp for rearing Tilapia in Central America. Aquaculture, 7, 385-390. Bowen, S. T., 1980, Detrital nonprotein amino acids are the key to rapid growth of
Tilapia in Lake Valencia, Venezuela. Science, 207, 1216-1218.
Collins, W. J. and Smitherman, R. O., 1978, Production of tilapia hybrids with cattle manure or a commercial diet. Proc. Am. Fish. Soc, Auburn, AL (ed. by
Smitherman, R. O., Shelton, W. L., and Grover, J. N.), 43-54.
Davis, A. T. and Stickney, R. R., 1978, Growth response of Tilapia aurea to dietary
protein quality and quantity. Trans. Am. Fish. Soc, 107, 479-483.
Garling, Jr. D. L. and Wilson, R. P., 1976, The optimum dietary protein to energy ratio for channel catfish fingerlings. J. Nutr., 106, 1368-1375.
Hauser, W. J., 1975, Influence of diet on growth of juvenile Tilapia zillii. Prog. Fish.
Cult., 37, 33-35.
Ishikawa, H., Fujimori, T., and Kume, H., 1976, "Design of Experiments for
Chemists and Chemical Technologists (in Japanese)", Upper Vol. Tokyo-kagakudojin, Tokyo, 69-142.
Jackson, A. J., Capper, B. S., and Matty, A. J., 1982, Evaluation of some plant
proteins in complete diets for the Tilapia Sarotherodon
mossambicus.
Aquacuture, 27, 97-109.
Jauncey, K., 1982, The effects of varying dietary protein levels on the growth, food
conversion, protein utilization and body composition of juvenile Tilapia
(Sarotherodon mossambicus). Aquaculture, 27, 43-54.
Kesamaru, K. and Miyazono, I., 1978a, Studies on the nutrition of Tilapia nilotica.
I. The growth of T. nilotica on diets containing various dietary proteins. Bull.
Fac. Agr. Miyazaki Univ., 25, 341-349.
Kesamaru, K. and Miyazono, I., 1978b, Studies on the nutrition of Tilapia nilotica. II. The nutritive values of diets containing various dietary proteins. Bull. Fac.
Agr. Miyazaki Univ., 25, 351-359.
Kesamaru, K., Okumura, N., Takeda, H., and Kuroki, A., 1982, Studies on the
nutrition of Tilapia nilotica. III. Protein requirements of fingerling Tilapia
nilotica. Bull. Fac. Agr. Miyazaki Univ., 29, 285-291.
Mazid, M. A., Tanaka, Y., Katayama, T., Simpson, K. L., and Chichester, C. O.,
1978, Metabolism of amino acids in aquatic animals-III. Indispensable amino acids for Tilapia zillii. Bull. Japan. Soc. Sci. Fish., 44, 739-742.
Mem. Kagoshima Univ. Res. Center S. Pac. Vol.6, No. 1, 1985 71
Mazid, M. A., Tanaka, Y., Katayama, T., Asadur Rahman, M., Simpson, K. L., and Chichester, CO., 1979, Growth response of Tilapia zillii fingerlings fed isocaloric diets with variable protein levels. Aquaculture, 18, 115-122.
Miller, J. W., 1979, A preliminary study of feeding pelleted versus non-pelleted feeds to Tilapia nilotica in ponds. In "Proc. World Symp. on Finfish Nutrition and Fishfeed Technology, Hamburg, 1978, Berlin (ed. by Halver, J. E. and Tiews, K.)", Vol. 1, 371-377.
STICKNEY, R. P. and Hesby, J. H., 1977, Water quality-Tilapia aurea interactions in ponds receiving swine and poultry wastes. In "Proc. 8th World Maricult. Soc. Costa Rica, 1977 (ed, by Avault, J. W.)", Louisiana State Univ., Baton Rouge,
55-72.
Takeuchi, T., Yokoyama, M., Watanabe, T., and Ogino, C, 1978, Optimum ratio of dietary energy to protein for rainbow trout. Bull. Japan. Soc. Sci. Fish., 44,
729-732.
Takeuchi, T., Watanabe, T., and Ogino, C, 1979, Optimum ratio of dietary energy to protein for carp. Bull. Japan. Soc. Sci. Fish., 45, 983-987.
Teshima, S., Ojeda Gonzalez, G. M., and Kanazawa, A., 1978, Nutritional require ments of Tilapia : Utilization of dietary protein by Tilapia zillii. Mem. Fac. Fish. Kagoshima Univ., 27, 49-57.
Viola, S. and Arieli, Y., 1982, Nutritional studies with a high-protein pellet for carp and Sarotherodon spp. (Tilapia). Bamidgeh, 34, 39-46.
Wang, K., Takeuchi, T., and Watanabe, T., 1985a, Effect of dietary protein levels on growth of Tilapia nilotica. Bull. Japan. Soc. Sci. Fish., 51, 133-140.
Wang, K., Takeuchi, T., and Watanabe, T., 1985b, Optimum protein and digestible energy levels in diets for Tilapia nilotica. Bull, Japan. Soc. Sci. Fish., 51,
141-146.
Winfree, R. A. and Stickney, R. R., 1981, Effects of dietary protein and energy on growth, feed conversion efficiency and body composition of Tilapia aurea. J.
Nutr., Ill, 1001-1012.