権利
Copyrights 日本貿易振興機構(ジェトロ)アジア
経済研究所 / Institute of Developing
Economies, Japan External Trade Organization
(IDE-JETRO) http://www.ide.go.jp
シリーズタイトル(英
)
ASEDP
シリーズ番号
73
journal or
publication title
Actors for Poverty Reduction in Vietnam
page range
[141]-168
year
2006
Cu Chi Loi
1. INTRODUCTION
Since economic reform (Doi moi) was launched in the late 1980s, Vietnam’s economy has integrated well into the world economy. Up to the present, Vietnam’s foreign trade regime has experienced remarkable changes and most of the trade barriers have been removed. The country has signed trade agreements with different markets such as the EU and the US and integrated some major trade blocks such as AFTA, OPEC, and is preparing to join the WTO. With favorable market conditions, in 2005 country’s exports performed very well with a growth rate of more than 20 percent per year and as a result the country’s foreign trade value has been higher than its GDP.
Vietnam also has been remarkably successful in attracting substantial foreign direct investment (FDI). With the improvement of the investment climate, FDI in Vietnam has been increasing at a rapid pace. Cumulative FDI rose from 28 projects for a total of 140 million dollars in 1988, to over 700 projects and 5.5 billion dollars in 1993, to 6,164 projects totaling roughly 60 billion dollars by 2004 (World Bank et. al. [2005]). The FDI has played important role in some key sectors of the national economy such as oil, or in some manufacturing industries such as textiles and garments, and in the footwear industry, and recently in some service sectors such as telecommunications, transportation, and finance.
The significant contribution of foreign investment and out-performance of foreign trade, in fact are the foundation for the strong national economic performance which has experienced an annual growth rate about 7-8 percent for the period 2000-2005. In its turn the good economic performance has generated a huge number of jobs for people and contributed significantly to country’s poverty reduction for which Vietnam has been recognized as one of the most successful countries in the world.
In this report we conduct an analysis on the impact of the economic integration process to employment generation and poverty reduction in Vietnam during a ten year period from the mid 1990s to 2004. In order to achieve the target, in addition to Introduction and Conclusion Remarks the report is organized into three parts. In the first part, the report gives an overview of country’s population growth, employment, and
unemployment. In the second part, the report will make some evaluations of the economic integration on employment and income in Vietnam by an analysis on the process of economic integration and its impact on job creation and income generation at aggregate level, and in some labor intensive industries as case studies. In the third part, the report addresses the impact of the foreign trade and FDI on poverty reduction in Vietnam.
2. POPULATION AND EMPLOYMENT
2.1 Population growth and labor force participation
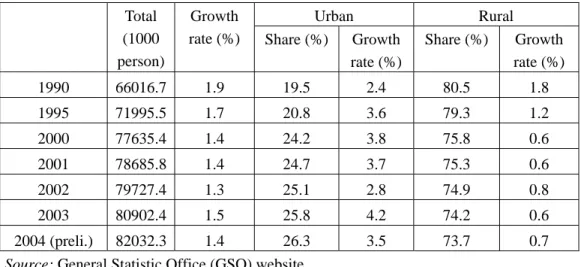
The high population growth rates in over the past decades have turned Vietnam into one of the biggest nations in the world in terms of population size. For 30 years from the 1960s to the early 1990s, the Vietnamese population doubled from 30 million to more than 60 million, and for last ten years, on average the population has increased by about 1.5 million annually. As a result, in 2003 the population of Vietnam topped 80 million – 13th biggest country in the world, and the second biggest nation in the South East Asian region in terms of population size.
Table 1: Vietnam’s population
Urban Rural Total
(1000 person)
Growth
rate (%) Share (%) Growth rate (%) Share (%) Growth rate (%) 1990 66016.7 1.9 19.5 2.4 80.5 1.8 1995 71995.5 1.7 20.8 3.6 79.3 1.2 2000 77635.4 1.4 24.2 3.8 75.8 0.6 2001 78685.8 1.4 24.7 3.7 75.3 0.6 2002 79727.4 1.3 25.1 2.8 74.9 0.8 2003 80902.4 1.5 25.8 4.2 74.2 0.6 2004 (preli.) 82032.3 1.4 26.3 3.5 73.7 0.7
Source: General Statistic Office (GSO) website
Like other less developed countries which are characterized by the domination of agricultural production, most of the Vietnamese population live in rural areas which accounts for about 70 percent of its inhabitants and most of this portion of the population
work in the agricultural sector (including forestry and fishery activities) (GSO data1). Having a huge population settled in such a limited area of land (especially arable land) is problematic for the social and economic development of Vietnam. The arable land per capita in Vietnam is quite low, and the high population growth in past years has reduced the amount of arable land per capita substantially. During the 1990s the per capita arable land area was reduced from 0.33 ha to 0.28 ha. This is a severe problem given the fact that Vietnam is not rich in land suitable for agricultural production, even though Vietnam does have the advantage of having a vast sea area2.
As a consequence of the high rate of population growth in the past decades, the percentage of young Vietnamese has increased substantially, and therefore the share of the population at working age has also gone up quickly. The share of population at working age in Vietnam is about 70 percent of total population and this share has been increasing in recent years. In 1996, the ratio of population at working age (15 and older) was just 66.3 percent, and in 2000 the ratio was up to about 70 percent. Hence, in recent years, more than one million people reach working age each year (Nguyen Tran Binh [2005]).
2.2 Employment
2.2.1 Employment structure
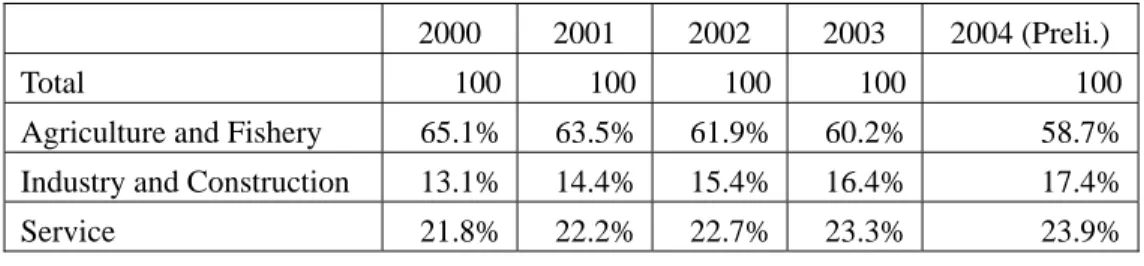
Vietnam’s employment is heavily concentrated in agriculture, forestry, and fisheries, however the structure of employment has experienced a substantial change. The share of employment in the agricultural sector has declined significantly, and the loss of jobs in the agricultural sector has been picked up by both the industrial and service sectors. In the early 1990s, employment in the agricultural sector occupied more than 70 percent. This share was reduced significantly to about 59 percent by 2004. Agricultural jobs losses were replaced by jobs in the industrial sector as its share of employment expanded from 13 percent in 2000 to about 17.5 percent in 2004. The service sector also plays an important role in terms of employment. The share of employment in the service sector has been increasing. In 2000, employment in the service sector was about 22 percent, and it
1
In this report, many statistical data are drawn from GSO website. When this report indicates ‘GSO data’, they are the data presented in GSO website: http://www.gso.gov.vn (as of December 2005).
2
‘In terms of factor endowment, Vietnam is the poorest country in the region. According to UNDP, Vietnam’s agricultural land per capita in 1998 was just 0.1 ha while the figure for Indonesia was 0.18, Thailand was 0.35, and 0.39 for Malaysia. (Le Xuan Ba et. al. [2001])
increased to about 24 percent in 2004. (See Table 2)
Table 2: Employment distribution by main economic sector
2000 2001 2002 2003 2004 (Preli.)
Total 100 100 100 100 100
Agriculture and Fishery 65.1% 63.5% 61.9% 60.2% 58.7% Industry and Construction 13.1% 14.4% 15.4% 16.4% 17.4%
Service 21.8% 22.2% 22.7% 23.3% 23.9%
Source: GSO website
Employment is generated more by industrial and service sectors than the agricultural sector. It is a special feature that the agricultural sector has experienced negative employment growth as the number of people working in the sector declined from 24.5 million people to about 24.4 million people from 2001 to 2004, and this is the reason for the decline in the agricultural sector. The engine of employment generation is the industrial sector as it alone generated about 500-600 hundred thousand job per year for period of 2001-2004. The service sector in this period increased its importance in job creation as the number of jobs generated by the sector was about 90 percent of industrial sector. The decline in the employment share of the agricultural sector in absolute numbers, and rapid expansion of the service and industrial sectors is partly attributed to the promulgation of the Enterprise Law in 2000 which simplified enterprise registration. A large increase in the number of new small and medium enterprises in manufacturing and service sectors in recent years has increased the importance of these sectors in job generation.
It is estimated that since passing the Enterprise Law (2000) to September 2003 there have been 72,601 newly registered enterprises (in the period 1991-1999 this figure was just 45000). The annual number of newly registered enterprises after passing the Law period is about 3.75 times higher than before the Law. The Enterprise Law has mobilized about 145,000 billion VND (about USD 9.5 billion, higher than the figure of foreign invested capital). The new registered capital in four years after the Law is about four times higher than nine years before the Law. The Enterprise Law also has created about 1.6 to 2.0 million jobs, and this brought the total employment in private enterprises to 6 million or about 16 percent of the total labor force (Ministry of Planning and
Investment (MPI) data3).
The non-state economic sector in Vietnam (private enterprises, collectives, and the household economy) is still very weak due to the discrimination policies of the past. In recent years as economic reforms have sped up, the performance of the non-state sector has improved significantly. Although the employment share of the domestic private sector has declined slightly in recent years, the domestic private sector is still the main engine of job generation. About eighty percent of annual employment is generated by the domestic private sector.
2.2.2 Unemployment and Underemployment
Under Doi moi, the economy has experienced a remarkable turn around, and Vietnam’s economy has become one of the best performers in terms of GDP growth rates. The good performance of the economy has contributed significantly to the employment generation for the population. As a result the urban unemployment rate has been brought down from two digit rates in the early days of Doi moi down to less than six percent in 2003 and 2004. As shown in Figure 1, the unemployment rate in urban areas is strongly associated with the performance of the economy.
Figure 1: GDP Growth Rate and Urban Unemployment Rate
3 5 7 9 11 13 15 1989 1996 1999 2000 2001 2002 2003 2004 Per cen ta g e Unemployment rate GDP Growth rate
Source: Nguyen Tran Binh, 2005; GSO website
3
When this report indicates ‘MPI data’, they are the data drawn from MPI website:
Although it performed well, the economy has failed to generate enough employment for the population and unemployment and underemployment still exit. The failure to generate a sufficient number of jobs for the population is rooted in different issues such as the high rate of labor force participation growth, but it is also because of the economic growth pattern. In fact, during the past years, capital intensive industries were promoted such as cement, steel, chemicals, and the like while labor intensive industries were neglected. As a result, the unemployment rate remains near six percent, and the rate of underemployment is still high in both urban and rural areas.
Underemployment is very common in rural areas. While unemployment is mostly associated with urban areas, underemployment is largely a rural and agricultural phenomenon. Although a large share of the labor force is engaged in the agricultural sector these people share a very small land area. The Red River Delta is one of the most populated areas of the country. The farmers in this area own only about one thousand square meters per person which is too small for people to work full-time in the agricultural sector.
Statistical data shows some improvement in the level of underemployment in rural areas as the time utilization rate in this area has been increased, however the rate of time used in the area has never been higher than 80 percent (GSO data). This means that one fifth of that time has become redundant, and it also means that one fifth of the human resource available has been wasted. The other way to look at the issue of underemployment in rural areas is to estimate the population that are looking for additional work. The data from MOLISA reveals that the average ratio of people who look for additional jobs in urban areas was about 13 percent of the employed population for the period 1996-2002. The figure for rural areas is much higher as it stood at 37 percent (MOLISA [2003]).
The strong population growth in recent years has created big pressure on the economy to generate enough jobs for all those seeking them. The agriculture sector in Vietnam is still the main source of employment as it accounts for about 60 percent of the total labor force, but the role of this sector in terms of job generation has been declining in recent times. The service and industrial sectors have become more important in job generation as these two sectors have absorbed most of new job seekers since 2000. The good performance of the economy has contributed strongly to the reduction of unemployment rates, however the economy still has to find new engines to generate enough jobs to solve the unemployment and underemployment problem.
3. IMPACT OF ECONOMIC INTEGRATION ON POVERTY REDUCTION
3.1 Economic integration process
3.1.1 Foreign direct investment
Right after Doi moi was launched the Law of Foreign Direct Investment in Vietnam was stipulated in 1986. Together with the establishment and gradual improvement of the legal framework for FDI, Vietnam also signed international bilateral and multilateral agreements on investment encouragement and protection. Such agreements, which concern 45 countries and territories so far, have a wider scope of application than the regulations stipulated in the Law on Foreign Investment. Thanks to the promulgation of the Law of Foreign Direct Investment and the improvement of the internal business environment afterwards, foreign direct investment grew rapidly and foreign investment has played an important role in the national economic performance as the sector has comprised about 15 percent of GDP in recent years.
Table 3: Foreign direct investment in Vietnam 1989 -2004
Number of new projects Registered capital (US$ mil.) Realized capital (US$ mil) 1988 - 1990 214 1582.0 -- 1991 - 1995 1397 19077.6 6517.8 1996 - 2000 1730 25627.6 12944.8 2001 - 2004 2823 13560.7 10543.9 2001 550 3230.0 2450.5 2002 802 2963.0 2591.0 2003 748 3145.5 2650.0 2004 723 4222.2 2852.4 Total 6164 59847.9 30006.5
Source: GSO website.
Based on GSO data, cumulative FDI rose from 28 projects for a total of 140 million dollars in 1988, to over 700 projects and 5.5 billion dollars in 1993, to 6,164 projects for roughly 60 billion dollars by 2004. In early 1990s, the inflow of FDI was very large as reaching nearly 10 percent of GDP between 1994 and 1997 and Vietnam became
then the top recipient of FDI among all developing countries and transition economies (World Bank et. al. [2005]). The regional economic crisis which broke out in the second half of 1997, in fact, had a negative impact on the flow of FDI to Vietnam as it experienced a sharp decline. The decline of FDI in this period was not only attributed to international environment, but also to the unfavorable investment climate within the country. In recent years, with the improvement of the internal business environment, the volume of FDI commitments is again reaching close to 10 percent of GDP.
It should be noted that the success of attracting foreign direct investment during this period was due to the fact that foreign investors came to Vietnam to enjoy foreign trade opportunities available in Vietnam. A huge number of projects came to the textile garment and footwear sectors to enjoy the low labor cost and preferential treatments such as quotas, and low tariffs in foreign market such as the EU and the US. In addition, foreign direct investment comes to Vietnam to exploit the business opportunities in the domestic market. During the 1990s the domestic market was strongly protected and this encouraged foreign investors to take advantage of this system. Cement, steel, or motorcycle industries were typical examples that foreign investors jumped into Vietnam’s market to exploit. Although FDI comes to different sectors of the economy, the manufacturing sector has absorbed the largest share of total FDI. The accumulated FDI data indicates that by the end of 2004, the manufacturing sector had absorbed about 48 percent of registered capital and 44 percent of total realized capital. Foreign-invested enterprises now account for almost 100 percent in oil and gas, 84 percent in automobile assembling, 45 percent in electronics, 41 percent in textile and garments, 38 percent in chemicals, 32 percent in steel, and 25 to 30 percent in cement, rubber and plastics, and food and beverages (GSO data).
As majority of foreign investors were from other Asian countries, the regional financial crisis (which began in 1997) in fact negatively impacted the foreign direct investment flow into Vietnam. Although Asian foreign investors still were at the top, the volume of foreign investment capital has gone down sharply since then, and the trend has recovered only in the last two years. It is unfair to blame the downward flow of foreign investment only on the regional financial crisis. The domestic business environment was another main reason for this fact as well. An unstable and less attractive environment and a complicated administration have also drawn away foreign investment.
Up to now foreign investors form 72 countries and territories have invested in Vietnam. Asia is the most important source of capital and the most important Asian investors are from Singapore, Taiwan, Korea, Hong Kong and Japan. Taken together, these countries account for almost two thirds of total FDI to Vietnam. Outside of Asia,
France, The Netherlands and the United Kingdom are among the most important investors. The GSO data shows that after the signing of the US-Vietnam Bilateral Trade Agreement (USBTA), investment from American companies in Vietnam increased steadily. Between 2002 and 2004, US related FDI grew by 27 percent per year, compared to just around 3 percent from 1996 to 2001.
3.1.2 Foreign trade
The most important feature of Vietnam’s foreign trade regime after Doi moi is that the Vietnamese government tried very hard to establish diplomatic and foreign trade relationships with different countries and trade blocs. In the early 1990s, Vietnam re-established a diplomatic relationship with the EU, and then signed a trade agreement with this market bloc, this was an important step for Vietnam in join the world economy. Since then Vietnam has signed different bilateral or multilateral trade agreements with many different countries and trade blocs. Vietnam has become an AFTA/ASEAN member, and it also has joined APEC, and signed a landmark trade agreement with US, and the country is working hard to become a WTO member (at the time this study was conducted).
By signing trade agreements, the door has been opened to many important markets such as the EU, Japan, the US, which benefits Vietnamese exporters not only in terms of sizable markets, but also with preferential treatments given by these countries. A lot of Vietnamese goods have enjoyed low tariffs to these markets, especially textile and garment products which account for the main share of the country’s export earning in recent years. All of these efforts have benefited country’s trade and as a result, Vietnam’s foreign trade has performed remarkably well in recent years. The sum of exports and imports represent by now more than 130 percent of total GDP. Exports have grown at an average rate of 18 percent per year since 2000 (See Table 4).
Table 4: Foreign trade performance
Total Export Import
Volume (mill. $US) Growth rate (%) Volume (mill. $US) Growth rate (%) Volume (mill. $US) Growth rate (%) 1995 13604.3 37.7 5448.9 34.4 8155.4 40.0 2000 30119.5 29.4 14483.0 25.5 15636.5 33.2 2001 31247.0 3.7 15029.0 3.8 16218.0 3.7 2002 36438.8 16.6 16705.8 11.2 19733.0 21.7 2003 45405.1 24.6 20149.3 20.6 25255.8 27.9 2004 58458.1 28.7 26504.2 31.5 31953.9 26.5
Source: GSO website
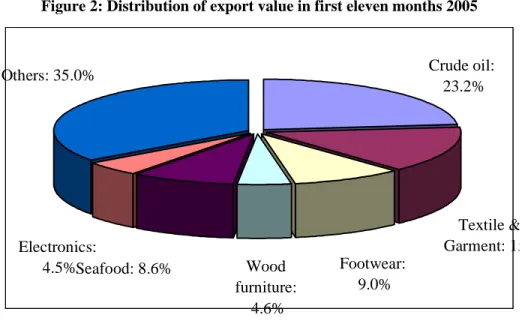
The exports cover many different items but these main export items can be categorized into three groups: agricultural products such as rice, coffee, cashew nuts, seafood; mining products including coal, crude oil; and manufacturing products. Among the successful exporters, the manufacturers such as textiles garments, footwear and seafood processing are at top (for non-oil exports) (see Figure 2).
Figure 2: Distribution of export value in first eleven months 2005
Others: 35.0% Electronics: 4.5%Seafood: 8.6% Wood furniture: 4.6% Footwear: 9.0% Textile & Garment: 15 Crude oil: 23.2%
By exploiting the advantages of low labor costs, natural resource availability, and huge market demand, these manufacturers have had a remarkable export performance since the early 1990s. Footwear, and textile and garment producers have benefited from huge market demand and preferential market access (quotas) soon after Doi moi and have become key exports. Seafood producers in recent years have exploited well the country’s natural advantages to increase their share in the country’s total export repatriation. As a result, manufacturing export has accounted for the main share of the country’s export earning and it has replaced the domination of crude oil and agricultural items since 2002 (GSO data).
The good performance of foreign trade in Vietnam during the 1990s and early years of the 21st century is partly attributed to the contribution of foreign investment in Vietnam. Foreign investors have participated strongly in two main areas: manufacturing and crude oil exploitation, and in these two areas foreign invested firms account for a significant part of total exports. In the first eleven months of 2005, foreign invested firms accounted for 57 percent of the country’s total exports, and if crude oil is excluded, the share of foreign firms in Vietnam still accounted for 34 percent of total non-oil exports.
In sum, the ‘open door reform policy’ launched in the late 1980s indicated the strong aspiration of Vietnam to integrate into the world economy in order to improve the performance of the national economy and to improve the livelihoods of the Vietnamese people. Many reforms have taken place, and the foreign trade regime as well as the overall economic environment of Vietnam has been improved and has become more attractive. Vietnam has become one of the most attractive markets for foreign investment and the national economy has been well integrated into the world economy.
3.2 Impact of economic integration on employment and livelihood 3.2.1 Employment and income in foreign invested enterprises
As contributions in the foreign investment sector to total GDP in general and in the industrial sector in particular has gone up rapidly in past years from 10 per cent in 1998 to about 15 per cent in 2004 (GSO data), there is no doubt that foreign invested enterprises contributed substantially to job generation. It is estimated that the share of the labor force working for the foreign sector in 2000 was about 0.6 percent of the total work labor force (MOLISA [2003]). However the share of the labor force working in the foreign sector varies from region to region. In some regions the share is quite high. The share of labor force working in the foreign investment sector increased significantly from 1996 to 2002 in the Red River Delta and the South East region. It should be noted that
non-oil foreign investment in Vietnam is located mostly in these two regions of the country as these two regions are the most advanced in terms of infrastructure and labor force. Among these two regions, the South East is much more advanced and it has attracted the major share of foreign investment in Vietnam. Up to the end of 2003, foreign investment in Ho Chi Minh City, Binh Duong, Dong Nai (the three main provinces of the South East region) accounted for 46 percent of the total capital and 49 percent of the legal capital, while Hanoi, Hai Phong, Hai Duong, Hung Yen (the four main provinces of the Red River Delta) accounted for 16 percent of the total capital and 16 percent of the legal capital (MPI data).
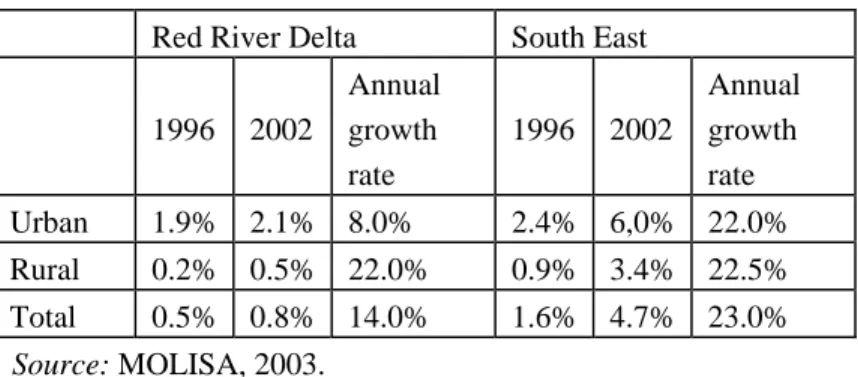
Although the share of employees working in the foreign sector compared to the total is still small, especially in rural areas such as the Red River Delta, the rate of growth is quite remarkable. The data from MOLISA shows that in the Red River Delta, total employment of workers working in the foreign sector increased from 33.9 thousand persons in 1996 to 73.8 thousand persons in 2002 which is equivalent to about 15 percent per year, and in this the region annual growth rate of employees working for foreign sector in urban areas during this period was 8.0 percent, and for rural areas, surprisingly, it was 22 percent. In the South East region, the number of employees working for foreign sector increased from 80.8 thousand persons in 1996 to 278.5 thousand persons or the equivalent of about 23 percent per year, and the annual growth rate of the number of employees from 1996 to 2002 in urban areas was 22 percent, and in rural areas was 22.5 percent. In terms of growth rate of employment between urban and rural areas, figures in past years reveals no bias against rural areas, in fact, rural areas benefited more from foreign investment for its employment (See Table 5).
Table 5: Share of labor force and annual growth rate of number of persons working in foreign sector for period 1996-2002
Red River Delta South East 1996 2002 Annual growth rate 1996 2002 Annual growth rate Urban 1.9% 2.1% 8.0% 2.4% 6,0% 22.0% Rural 0.2% 0.5% 22.0% 0.9% 3.4% 22.5% Total 0.5% 0.8% 14.0% 1.6% 4.7% 23.0% Source: MOLISA, 2003.
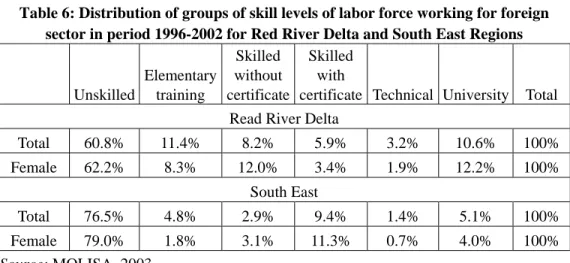
MOLISA data indicates that about 60 percent of the labor force working for foreign invested firms are unskilled workers and as shown in Table 6 if elementary training is considered unskilled work, the share of the unskilled group in total staffs working in these enterprises accounts for 70 percent in the Red River Delta, and about 80 percent in the South East Region. The reason behind this is the lack of skilled labor, rather than the motivation of exploiting unskilled labor by foreign invested firms. This reflects the fact that labor training in Vietnam has been neglected for a long time, and now not only foreign firms, but also Vietnamese firms are encountering problems of labor skill.
The labor force working in foreign invested firms is fairly balanced between male and female workers although slightly favoring female workers. The ratio of female to male labor in firms located in Red River Delta is almost fifty - fifty, but the gender equity is more favorable to female workers in the South with a ratio of 60: 40. This could be explained by a fact that most textile, garment and shoe making firms, which utilize more female labor than male labor, are located in the South (of course there is some motivation because of the lower wage rate for female labor, see Box 1). Given this fact it can be said that female workers have benefited more from foreign investment in terms of employment. In addition, unskilled female workers are the biggest group that has benefited most from this integration trend, but unskilled female workers receive lower wages as shown in the next section (see Table 6).
Table 6: Distribution of groups of skill levels of labor force working for foreign sector in period 1996-2002 for Red River Delta and South East Regions
Unskilled Elementary training Skilled without certificate Skilled with
certificate Technical University Total Read River Delta
Total 60.8% 11.4% 8.2% 5.9% 3.2% 10.6% 100% Female 62.2% 8.3% 12.0% 3.4% 1.9% 12.2% 100% South East Total 76.5% 4.8% 2.9% 9.4% 1.4% 5.1% 100% Female 79.0% 1.8% 3.1% 11.3% 0.7% 4.0% 100% Source: MOLISA, 2003.
Box 1: Footwear Industry: a typical example of well integrated industry
Footwear is one of the outperforming industries in Vietnam. The industry has contributed significantly to country’s total export repatriation: about 9 percent of country’s total export earning, and 13 percent of total non-oil exports in 2005. A special figure of the industry is that the industry has attracted a huge amount of foreign investment, and the industry’s employment share is the biggest among manufacturing industries.
Currently, there are 233 leather and footwear enterprises employing 400,000 workers. Among these enterprises, 1/4 are foreign invested or joint ventures including industry and 10 joint ventures and 100 % foreign-funded in the leather industry. Most of footwear and leather enterprises are located in the South of Vietnam - the South East region.
Dong Nai Province, located in South East Region, is one of major centers of country’s footwear manufacturing. The province’s footwear industry has attracted many foreign investors who come and produce shoes for export. It is amazing that these foreign firms employ an unbelievable number of workers. In some enterprises number of workers comes to almost ten thousand, and most of them are female and come from rural areas and from other provinces.
Country's Employment Share of Major manufacturings in 2002 17.9% 16.3% 15.1% 8.1% 7.1% 5.3% Footwear Bevarage Garment Glass Textile Furniture
Box 1 (Continued):
Export employment share of footwear industry in Dong Nai Province
1995 1996 1997 1998 1999 2000 Footwear export
value/ Total export
value 10.7 47.4 31.2 25.3 27.5 24.1
Footwear employment/ Total industrial
employment 15.4 25.5 28.4 27.7 25.8 23.9
Employment in foreign firms/ Total footwear firm
employment 80.9 91.6 93.7 93.9 93.9 93.8
Average number of employment of foreign
firm (person) 3,875 4,960 5,517 5,673 5,933 5,865 Source: Dong Nai Provincial Statistical Office, 2000.
Because most of Vietnam’s labor force works in the agricultural sector and the foreign investment which comes to this sector is very small, the low share of total employment working for foreign invested firms as shown in Table 5 could disguise the importance of the sector in terms of job creation. In the manufacturing sector, foreign invested firms play a much more important role in job creation. It is true that many foreign invested firms in Vietnam are operating in textile and garment, and shoe making industries which are very much labor-intensive. According to the results of the Enterprise Survey 2001-2003, conducted by GSO (also drawn from GSO website), in the industrial sector, foreign invested firms in recent years have generated about 15 percent of the total labor force working in the sector, and this share has been increasing. Female labor has benefited more from job creation by these firms than male labor. The share of female workers working in foreign firms also is increasing (See Table 7).
Table 7: Share of total and female workers working in different industrial ownership sectors
Total Female 2000 2001 2002 2000 2001 2002
State sector 59.0% 53.8% 48.5% 55.0% 49.2% 43.4% Private sector 29.4% 33.8% 36.6% 28.7% 32.3% 33.7% Foreign sector 11.5% 12.4% 14.8% 16.3% 18.5% 22.8%
Source: GSO website
3.2.2 Income of workers in foreign investment sector
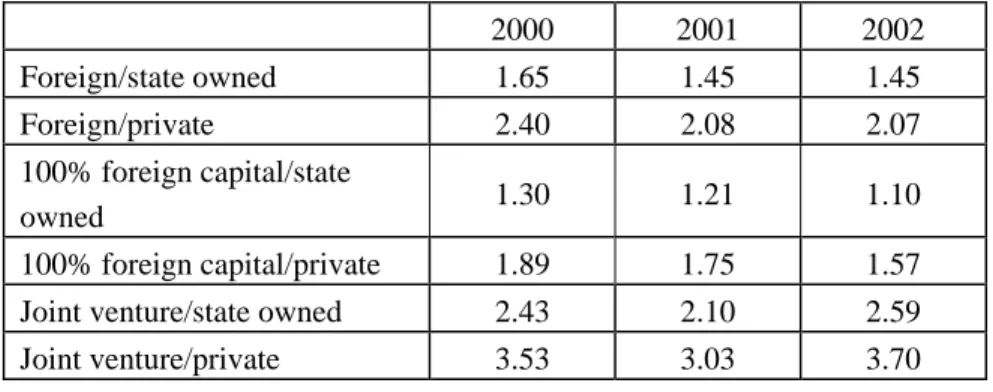
Foreign direct invested firms as mentioned above have generated quite a large number of jobs for Vietnamese job-seekers. More importantly, the workers in foreign invested firms have also benefited from the income for services they provide to foreign invested firms. GSO’s Enterprise Survey data reveal that the income of those working for foreign firms is much higher than the income generated from Vietnamese firms, either state owned or private ones. It should be noted that the foreign sector in Vietnam comprises two types: joint-venture and 100% foreign capital firms. A large number of joint- venture firms are in special industries such as oil which requires mostly high skilled labor.
Table 8: Ratio of wage rate of foreign invested firm over domestic firms
2000 2001 2002 Foreign/state owned 1.65 1.45 1.45 Foreign/private 2.40 2.08 2.07 100% foreign capital/state owned 1.30 1.21 1.10 100% foreign capital/private 1.89 1.75 1.57 Joint venture/state owned 2.43 2.10 2.59
Joint venture/private 3.53 3.03 3.70
Source: GSO website.
As shown in Table 8 workers are benefited more from working for foreign firms. In the worst case, worker working for foreign invested firms, in general, earn 10 percent more than working for state owned enterprises (in 2002), and in the best case he
or she can earn 3.7 times more than working for private enterprises if he or she works for a joint venture company. The benefits of working for foreign invested firms and enjoying higher wage rates is also found in the textile and garment industries as show in Box 2, in which regardless of working skill, the worker still enjoys a higher wage rate compared to the person working for a Vietnamese firm with the same labor skills . In Box 2, the gender bias also reveals that female workers always enjoy higher wage rates compared to her male counterparts.
Box 2: The Textile and garment industries and their impact on employment and income by an employment survey carried out by the Vietnam Institute of Economics in 2000
The textile and garment industries (especially the latter) are ones which have experienced excellent performance in past years. These industries have accounted for about 15 percent of the total manufacturing output value, and they have generated a significant share of employment - about 22 percent of the total manufacturing labor force in recent years. The export value of the textile and garment industries in 2005 accounted for 15 percent of the country’s total export value and it was the second biggest exporter after crude oil.
Distribution of labor force in foreign firm by skill level Technically trained: 9.0% Vocaltionall y trained: 21% Univesity: 18% Non-trained: 52%
Box 2 (continued):
In 2000, The Vietnam Institute of Economics carried out a survey over 150 textile and garment companies in two main regions of the country: the North and the South. The sample was selected randomly at a size of 150, and it covered both textile and garment firms, both domestic and foreign. The surveyed data indicated that foreign firms generated 15 percent of total employees of which 60 percent were female and 20 percent were of migrated workers from rural areas. Half of the labor force of foreign invest firms were unskilled. If vocational trained workers, which are at a low standard, are added to the unskilled group, it ends up being about 73 percent. Foreign invested firms in the sector are not only important in terms of job creation, but income as well. The estimation on the wage rate among skill level groups, gender groups indicates the bias of wage rate of workers between foreign vs. domestic firms, and male and female workers.
Average monthly wage rates in foreign and domestic firms by skill level and gender differences in 2000 and t-test for difference
Domestic vs. Foreign firms Foreign (1,000 VND) Domestic (1,000 VND) Difference (1,000 VND) ttst Unskilled 961.94 857.38 104.56 3.08 Vocational trained 1,114.32 913.52 104.56 2.48 Technician 1,783.44 1,138.93 200.81 3.19 University 4,044.36 1,596.75 644.51 7.94 Male vs. Female Male (1,000 VND) Female (1,000 VND) Difference (1,000 VND) ttst Unskilled 935.24 1,069.47 -134.22 -2.64 Vocational trained 817.29 934.46 -117.17 -2.44 Technician 1,069.31 1,376.22 -306.91 -2.22 University 1,656.97 2,144.48 -487.52 -2.25
3.2.3 Employment generated by foreign trade
Vietnam’s trade regime in the 1990s retained two extremes: some industries were very highly exported, and some others were import substitution ones. The export oriented industries included, garment, footwear, wood processing, seafood (food processing), and import substitution industries including steel, cement, motorcycle manufacturers and so on. It is very interesting that the export oriented industries are labor intensive, and import substitution industries are ones that utilize limited labor. The emergence of export oriented industries, in fact, is a result of two factors: 1) well- exploiting opportunities given by international economic integration, and 2) well- exploiting the country’s advantage of labor abundance. As a result, the export oriented industries benefited people very much by generating jobs and incomes. In contrast, most of the import substitution industries are heavy industries. Even though some industries have developed fairly well under government protection, the development of these industries has brought back few benefits to people in terms of job creation and direct income.
Export oriented industries as mentioned above in fact have employed an important share of the total labor force working for in the manufacturing sector. For example, leather and footwear industries in 2003 employed about 18 percent of the total employment of the manufacturing sector, and the figure for the garment industry was about 15 percent. These export oriented industries are an important source of job generation, indeed (GSO’s Enterprise Survey). The contrast between export oriented industries and import substitution ones in terms of job creation can be found in the Figure 3.
As indicated by Figure 3, the most of positive net export ratio industries are on the right hand of the panel and these industries are located in upper right corner4. It means that export oriented industries are much more labor intensive than non-export oriented industries. Among eighteen manufacturing industries, as classified by GSO in the Industrial Survey, according to our estimation, only four have a positive net export ratio including garment, food processing, footwear, and wood processing. Among the four
4
The data of this figure have been created from I/O Table 2000, and industrial survey dataset provided by GSO. In fact these two datasets are not consistent as industry classification is different from each other. The mapping these two sources was made based on mostly the name of lines, therefore it was a difficult task. Fortunately, for some export oriented industries such as garment, leather and footwear the classification between two sources are fairly consistent to map. This mapping is not perfect, but to some extent, the result is good and reflects reality.
positive net export ratio industries three of them in 2000 utilized about 50 percent of total labor force working for the manufacturing sector, and these are leather and footwear (17.9 percent), food processing (16.4 percent) and garment (15.1 percent). The correlation between export/output and labor share of each industry also shows the same trend that higher ratio of export to output the higher labor share (employing more labor). Hence, it can be said that the foreign trade regime, which has promoted export oriented industries in recent years, has created a benefit to Vietnamese workers as it created a huge number of jobs for people.
Figure 3: Employment share (percentage of total) and net export ratio of manufacturing industries in 2000 0 0.05 0.1 0.15 0.2 -1 -0.5 0 0.5 1
Net export ratio
La
bo
r sh
ar
e
Source: I/O Table 2000 (unpublished), GSO website
However it should also be noted that economic integration has hurt some Vietnamese industries very much despite strong protection carried out by the government, and therefore employment in these industries has been also reduced. Among these industries, textiles and machinery and equipment are typical as these industries are not competitive and under the pressure of inflow of foreign made goods. A number of enterprises have been shut down. In period from 1995 to 1999 the number of workers in the textile industry was reduced from 256 thousand people to 212 thousand, and in period from 1996 to 1999, number of workers in machinery and equipment was reduced from 42 thousand people to 39 thousand (GSO [2000]).
3.2.4 Income of the workers participated in export industries
Export oriented industries as presented have generated a significant amount of jobs for workers, however whether workers working for these industries are better paid compared to those in import substitution industries is still questionable. The data from the industrial survey in 2002 (the results can also be viewed on the GSO website) shows that workers working for export oriented industries such as garment and footwear industries are lower paid.
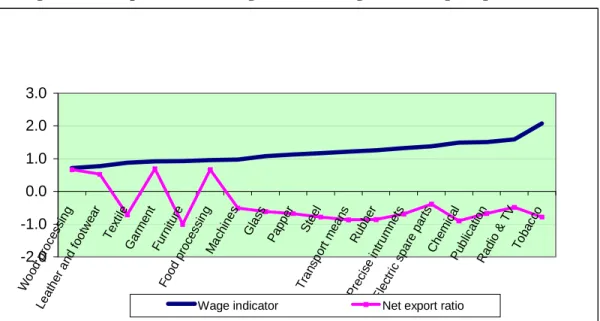
As presented in Figure 4, wood processing, leather and footwear, garment, and food processing industries with positive net export ratio are ones that have the wage rate lower than the average wage rate for all manufacturing industries. These results need to be explained carefully. Does it mean that economic integration has harmed workers with lower wage rate? It is hard to draw such a conclusion. The lower wage rates in exported oriented industries could be because these industries have employed mostly unskilled laborers who are naturally subject to lower wages. The export oriented industries have well-exploited the advantage of the Vietnamese labor force which includes mostly unskilled labor with low wage payment, and as they exploit the country’s advantages, industries have been successful in integrating into the world economy. The low wage of these industries, among other things, is one of the sources of the high competitiveness of these industries.
Figure 4: Net export ratio and wage indicator (wage rate/average wage rate)
-2.0 -1.0 0.0 1.0 2.0 3.0 Wo od p roce ssin g Lea the r a nd f ootw ear Text ile Ga rme nt Fu rnitu re Foo d p roce ssin g Ma chin es Gla ss Pa ppe r Ste el Tra nsp ort me ans Ru bbe r Pre cise intr umn ets Ele ctri c sp are pa rts Ch em ical Pu blic atio n Ra dio & T V Tob acc o
Wage indicator Net export ratio
Export oriented industries comprise mostly of female labor. For example in 2002, the share of female labor in garment industry was 81.7 percent; it was 82.6 percent for the leather and footwear industries, and 56.7 percent for the food processing industry (GSO’s Enterprise Survey 2002). The low wage rate in these export oriented industries implies that women in general have not benefited as much as men from the economic integration. As most of these female laborers are migrant workers who come from the countryside and work for enterprises in these industries with very little training, it is coincident that workers in export oriented industries are low paid because they are female and unskilled workers. The lower wage rate of labor in export oriented enterprises compared to non-export oriented ones is in fact is due to labor skills rather than export oriented firms over-exploiting workers. In other words, given the same skill that workers hold, the employees in export oriented firms may not receive lower wages than those in non-export oriented firms, although this assumption is not supported by any available comparable data. This is convincing due to the fact that the labor market in Vietnam is fairly open. Even if there are some regulations regarding the minimum wage rate, labor working for foreign invested firms get a higher minimum wage rate than for domestic firms, but such minimum wage rates are in fact non-binding (or non-effective), because most firms (foreign and domestic ones in manufacturing sector) pay a wage rate higher than the minimum one.
To see whether workers in foreign invested firms get lower wage rates as mentioned above (when comparing across industries), it is better to look at a single industry where the difference in labor skill requirement due to industry specification can be cancelled out. Again, data surveyed by the Institute of Economics on textile and garment firms in 2000 could not find any evidence to support the argument that export oriented firms pay lower wage rates. As shown in Table 9, the difference in wage rate between export oriented firms and non-export oriented firms is not statistically significant for all different skill level groups, there is even some evidence of a higher wage rate in export oriented firms. (In the Table, export oriented firms are ones that have export value ratio to total firm sale greater than 50 %.)
Table 9: Monthly wage rate of workers in export oriented vs. non-export oriented firms by labor skill groups in 2000 in textile and garment industry
Non-export oriented firms (mil. VND) Export oriented firms (mil. VND) Difference (mil. VND) ttest Management 1.47 2.29 -0.82 -1.61 Specialized worker 0.99 1.23 -0.24 -1.58 Technician worker 0.90 1.11 -0.21 -1.80 Unskilled worker 0.68 0.73 -0.05 -0.79 Other 0.61 0.76 -0.15 -1.71 Total 0.84 0.94 -0.10 -1.17 Number of observation 26 122 - -
Source: Vietnam Institute of Economics, 2000.
Vietnam’s economic integration, which is characterized by foreign investment and foreign trade in general, has had positive impacts on employment and income of the people. Foreign investment enterprises have been increasing their importance in terms of output contribution, and employment and income of people as well. The export oriented industries have generated an important share of employment for manufacturing sectors, and even though the wage rates of these export industries are lower than the average ones, this does not mean that these industries are exploiting the workers, and workers are not harmed by working for these industries.
3.3 Impact of economic integration on poverty reduction 3.3.1 Export performance and poverty reduction
It is noteworthy that the trade liberalization in Vietnam so far has generated great opportunities for labor-intensive industries to expand their markets. Needless to say, some industries such as textiles, or some other manufacturing industries have suffered in the process, however it is easy to observe some labor-intensive industries like the garment, electronics, footwear, and food processing ones have gained substantially from the trade liberalization process. The great performance of these labor intensive industries has contributed significantly to the reduction in the poverty rate in Vietnam from more than 70 percent in early 1990s to more than 20 percent in 2004 (World Bank et. al. [2005]).
Among these gaining industries, it is important to name the great export performance of a number of agricultural products on which a large share of Vietnamese population, and its labor force are depending. Rice, seafood, coffee, cashew nuts have experienced high rates of export growth, and Vietnam has found itself to be among the world biggest exporters of these products.
In the early days of Doi moi, Vietnam suffered from shortages of rice and the country had to import about one million tons of rice per year. However over the course of economic reform and trade liberalization with relaxing export controls, the annual rice export has been increasing rapidly. Vietnam very quickly became a rice exporter just a few years after economic reform was launched in the late 1980s and now it is the second biggest rice exporter in the world. In 2005, Vietnam exported more than five million tons of rice. As a result of the good performance of rice exports, the welfare of farmers has been improved. Seshan (2005) found that the rice households gained substantially from the rice exports: “Rural households across the income distribution experienced an increase in their welfare, with poor rural households gaining more as a fraction of their initial real income, relative to better-off rural households. This was also reflected in the reduction of poverty incidence by 9 percentage points among rural households.” (Seshan [2005: 33]).
Like the rice production, coffee exports have also performed very well to the benefit of farmers. Having started from almost zero Vietnam has quickly became the second biggest coffee exporter in the world in 2001, and coffee growing in fact has become a good income source for farmers in the Central Highlands area. The poverty rate of the Central Highlands area is therefore much lower than the rate of other mountainous areas. Furthermore, the poverty rate for the Central highlands area has been declining much faster than in other regions with the same geographic conditions. (See Table 10)
Table 10: Poverty rates in selected mountainous areas
2001-2002 2003-2004
North West
Overall poverty rate 68.7 54.4
Food poverty rate 28.1 25.4
Central Highlands
Overall poverty rate 51.8 32.7
Food poverty rate 17.0 14.9
3.3.2 FDI and poverty reduction
There are a number of motivations for foreign investors to invest in Vietnam such as taking advantage of the great potential market, political stability, and the low cost of labor. Much amount of FDI has been put in labor intensity industries like garment, footwear, food processing ones. This trend indicates that these investments have tried to take advantage of low labor costs, and this also means that FDI in Vietnam helps generate jobs and income for people.
Our estimation based on the General Statistic Office data shows the significant association between FDI and the poverty rate. Statistical data indicates that by 2004, among 63 provinces/cities three provinces had no FDI. In terms of FDI per capita Binh Duong province was at the top with the figure of 2060 USD and following by Ba Ria Vung Tau, Dong Nai, Hanoi and Ho Chi Minh City. In general, we found that the per capita FDI is strongly associated to the income per capita. This means that the province with higher per capita FDI has higher per capita income, or in other words, FDI has contributed significantly to improve the income of the people. (See Figure 3)
Figure 3: Per capita income and FDI by province/cities in 2004
500 700 900 1100 1300 1500 1700 1900 0 0.5 1 1.5 2 2.5
Per capita FDI (000 USD)
P e r c a p ita In co m e ( 0 0 0 V N D )
Note: FDI per capita is estimated from data of GSO website, and per capita income are estimated from 2004 Vietnam Household Living Standards Survey, GSO (unpublished)
In fact FDI was mainly concentrated in some rather highly developed areas such as urban areas or industrial zones, and the FDI has generated opportunities for local producers or laborers to improve their living standards through supplying the input or providing services. In addition there are others channels that local people can benefit from existence of FDI. The services such as housing, transports communication and the like emerge in the areas that FDI comes in, and therefore many job opportunities are generated for local enterprises and local people. The FDI in fact has created a more dynamic business environment from which many local people can benefit. The people in other areas also can benefit from the FDI. Many people from rural areas have moved to urban areas or industrial zones to provide their services, and the income of these migrants partly has been remitted and improved the livelihood of their families in rural areas.
Figure 4: Per capita FDI and poverty rate by province/city in 2004
0% 10% 20% 30% 40% 50% 60% 0 0.5 1 1.5 2 2.5
Per Capita FDI (000 USD)
Pove rt y r a te
Note: FDI per capita is estimated from data of GSO website, and poverty rates are estimated from 2004 Vietnam Household Living Standards Survey, GSO (unpublished)
Source: GSO website, GSO (unpublished).
By combining the figure of per capita FDI and poverty rate by province/city in 2004, we have found that the relationship between rate of per capita FDI and the rate of poverty is strong. It is noteworthy that poverty reduction depends on a number of issues such as public expenditure, credit availability, education level, and so on, however Figure 4 shows a trend that the province that has higher per capita FDI tends to have a lower
poverty rate, and based on this it is possible to conclude that the FDI is an important source of poverty reduction in Vietnam.
4. CONCLUSION REMARKS
Annually, about one million of job seekers enter the labor market - a quite challenging problem for the national economy in terms of job generation in general and for poverty reduction in particular. The economic reforms which were initiated by Doi moi have brought about opportunities for the national economy to integrate into the world’s economy.
Huge amounts of foreign investment and a remarkable foreign trade performance have proved the success of economic integration of the national economy. Foreign invested firms as well as export performance have generated a huge number of jobs and workers working for these two sectors are better off not only with job opportunities, but also by a higher wage rate brought back by these activities. The good performance of exports of agricultural products and labor-intensive industries in fact has contributed strongly to the improvement of the livelihoods of people, especially for people in rural areas. Although not very equally distributed among province/city, FDI has also contributed strongly to the poverty reduction in the areas where it comes in. The improvement of local business environment and infrastructure is an important source to absorb the FDI, and hence to stimulate the economic development of local area, and to reduce the poverty of local areas.
REFERENCES
Dong Nai Provincial Statistics Office. Dong Nai Statistical Yearbook, Dong Nai, 2000. GSO (General Statistics Office). Analysing the results of the industrial survey of Vietnam - 1999, Hanoi, Statistical Publishing House, 2000.
Le Xuan Ba, et. al. “The Labour Market in Vietnam: Growth, Poverty Reduction and
Adjustment to Crisis”, in Labour Markets in Transitional Economies in Southeast Asia and Thailand, Phnom Penh, Development Analysis Network, 2001.
Labor – Employment 1996 – 2002, (CD database), 2003.
Nguyen Tran. Binh et. al. Vietnam’s Labor Market Studies: A stock taking, Manila, Asian
Development Bank, 2005.
Seshan, Ganesh, The Impact of Trade Liberalization on Household Welfare in Vietnam,
World Bank Policy Research Working Paper 3541, Washington D.C., The World Bank, 2005.
Vietnam Institute of Economics. Database on Textile and Garment Employment Survey,
Hanoi, 2000.
World Bank et. al. Vietnam Development Report 2006: Business, Joint Donor Report to