Multi-scale structural design of MEAs with
enhanced performance and durability for PEFCs
A Doctoral Thesis
Presented to
Special Doctoral Program for Green Energy Conversion Science
and Technology
Interdisciplinary Graduate School of Medicine and Engineering
―――――
Contents
―――――Chapter 1. Introduction ... 1
1-1 Background ... 1
1-2 Fuel cell and history ... 2
1-3 Configuration of PEFCs ... 3
1-4 Theory of fuel cells ... 5
1-5 Current issues and challenges ... 7
1-6 References ... 8
Chapter 2. Objective and storyline of Ph.D. Thesis ... 9
2-1 Objective... 9
2-2 Storyline of Ph.D. Thesis ... 9
Chapter 3. Structure of MEAs... 11
3-1 Background: MEA configuration and durability ... 11
3-2 Purpose of the study ... 12
3-3 Experimental ... 12
3-4 Results and discussion ... 17
3-5 Summary ... 27
3-6 References ... 27
Chapter 4. Structure of membrane ... 28
4-1 Background: membrane modification for higher durability ... 28
4-2 Purpose of the study ... 32
4-3 Experimental ... 34
4-4 Results and discussion ... 37
4-5 Summary ... 47
4-6 References ... 48
Chapter 5. Structure of CLs/part.1 material ... 51
5-1 Background: CL structure and cell performance ... 51
5-2 Purpose of the study ... 53
5-3 Experimental ... 53
5-4 Results and discussion ... 59
5-5 Summary ... 69
5-6 References ... 69
Chapter 6. Structure of CLs/part 2. process ... 72
6-2 Purpose of the study ... 75
6-3 Experimental ... 76
6-4 Results and discussion ... 81
6-5 Summary ... 88
6-6 References ... 88
Chapter 7. Discussion of new concept MEA structure ... 90
Chapter 8. General Conclusions ... 95
Chapter 1. Introduction
1-1 Background
In the 21st century, the earth is facing lots of environmental and energy problems. The environmental issues such as global warming or climate change and the shortages of energy sources due to the depletion of foil fuels could change the world situation and our lives. To tackle these issues, the energy sources are gradually shifting from fossil fuels such as oil, coal, and natural gas to renewable energy sources such as wind, solar, and geothermal energy. Furthermore, over the last 50 years, many technologies, devices, and social systems were developed and constructed to reduce green-house gas emissions (e.g. CO2, CH4) and to improve energy utilization efficiencies. However, the current issues of using renewable energy sources are that they are still expensive, unreliable, and unstable due to the fluctuation according to the weather and climate conditions. To accommodate the fluctuations in electricity that these sources generate, hydrogen is regarded as one of the promising energy carriers for storage and transportation due to the relatively low production cost, stability and higher energy density per volume and per weight of the liquid hydrogen (Fig. 1-1) [1]. Hydrogen can be produced by water electrolysis by use of renewable energy sources, and it is offered to various sectors such as the consumer sector, industrial sector, and transport sector via storage tanks or gas pipelines. Additionally, hydrogen can be converted to electricity with high efficiency and without CO2 gas or other pollutant gas emissions (e.g., NOx, SOx) by use of fuel cells. Thus, to promote
these hydrogen value chains is a key to build a zero-emissions society. To make it a reality, it is required not only to develop hydrogen-related technologies and to spread the products commercially, but also to construct the hydrogen infrastructure, make regulations, and provide subsidies as a national policy.
1-2 Fuel cell and history
Fuel cells are devices that directly generate electric power from the fuel by means of electrochemical reaction of fuels and O2 in air. Hydrogen is commonly used as a fuel due to the high energy conversion efficiency and lack of harmful gas emissions. The fuel cells can generally be classified into polymer electrolyte fuel cells (PEFCs), phosphoric acid fuel cells (PAFCs), molten carbonate fuel cells (MCFCs), and solid oxide fuel cells (SOFCs), based on the electrolyte and cell configuration. Among these types of fuel cells, PEFCs are considered to be the most promising devices for automotive and stationary-power applications because of their high electricity generation efficiency, high power density and low operating temperature. In the 1960s, PEFCs were first developed by General Electric in the USA for use by NASA on their spacecraft [2]. The most well-known electrolyte polymer, Nafion®, was developed in 1960s by Dupont. Nafion is a sulfonated poly-fluoroethylene and is a good proton conductor with high chemical stability under fuel cell operation conditions. By use of the Nafion membrane and platinum (Pt) catalyst, Ballard Power Systems in Canada and Los Alamos National Laboratory in the USA developed membrane electrode assemblies (MEAs) and fuel cell stacks in the late 1980s and early 1990s. After that, the developments have been dedicated to increase the current densities up to more than 1 A/cm2 and reducing the Pt catalyst loading to less than 0.3 mg/cm2 in the electrodes in the late 1990s and 2000s. In the last 10 years, the PEFC system has started to be commercialized. For instance, a stationary fuel cell system called “ENE-FARM” has started to be sold by electric manufacturers Panasonic and Toshiba in 2009 as a household co-generation system that produces both power and heat at very high overall energy conversion efficiencies of more than 90% (Fig.1-2). Toyota Motors started to sell a fuel cell vehicle (FCV) named “MIRAI,” which is a hydrogen-fueled car, commercially in 2015. The MIRAI has a total range of 502 km (312 miles) on a full tank, and the fueling takes less than three minutes, which is close to that for a gasoline-fueled vehicle, although it is still expensive at around ¥7,000,000.
1-3 Configuration of PEFCs
PEFCs consist of MEAs and separators (bipolar plates), current collector, gaskets, and end plates (Fig. 1-3). Through the end plates and separators’ flowfields, H2 and O2 gases are fed continuously to the anode and cathode of the MEAs, respectively. Then, the hydrogen oxidation reaction (HOR) and the oxygen reduction reaction (ORR) take place on the anode and the cathode, respectively, to produce an electric current. The electrochemical reactions of anode and cathode are shown in equations (1-1, 1-2), and the overall reaction is shown in equation (1-3).
Anode
H
2
2H
2e
(1-1)
Cathode
O
2
4H
4e
2H
2O
(1-2)
Overall
2H
2
O
2
2H
2O
(1-3)
A MEA consists of a gas diffusion layer (GDL), microporous layer (MPL), catalyst layer (CL) and membrane, as shown in Fig. 1-3. Gases are fed to the CL by passing through the pores of the GDL and MPL, protons (H+) are supplied to the CL through the membrane, and electrons (e-) are supplied by passing through the carbon of the GDL and MPL. CLs are in the form of nanoscale porous films (~10-20 μm thickness), typically consisting of Pt, carbon, ionomer, and pores (see Fig. 1-4 and Chapter 3-1 and 5-1 in detail). The HOR and the ORR occur on the heterogeneous catalyst surfaces where reactant gases (H2 or O2), H+ and electrons can access a particular region, through pores, ionomer, and carbon, which is called the “three-phase boundary”. For higher voltage and higher current density operation of PEFCs, it is necessary to increase the number or extent of three-phase boundaries that are electrochemically active sites in the CL and to reduce the mass transfer resistance of gases, H+ and electrons to the Pt catalyst surface. For instance, the MEAs of ENE-FARM units are required to generate electricity at more than 750 mV and FCVs are required to operate at more than 1.0 A/cm2. Furthermore, to mitigate the PEFCs cost, the Pt catalyst loadings in the CL need to be reduced due to the high cost of Pt (~¥3,000-5,000/g). For example, the PEFC stack in the FCV consists of about 200-400 MEAs, including ca. 10–50 g of Pt metal per stack as catalyst. According to the U.S. Department of Energy, the fuel cell stack accounts for 50–60% of the overall fuel cell (FC) system cost in the FCV [3].
Figure 1-3. Configuration of a single cell and MEA
Figure 1-4. CL Structures in cathode (left) and the three-phase boundary (right).
H
2Air (O
2)
H
+H
2O
GDL MPL CL Membrane End plates Current collector SeparatorMPL
CL
(~10μm)
Mem.
O
2e
-H
+ Carbon Pt IonomerPt: 2-5 nm Carbon:
20-50 nm
Ionomer thickness:
Ave. 5-15 nm
1-4 Theory of fuel cells
In electrochemical power sources, including fuel cells, a reduction reaction and an oxidation reaction occur on the anode and cathode, respectively, and the electrons pass through an external circuit and ions pass through an internal ion conductor (e.g., Nafion membrane). The theoretical cell voltage, which is related to the theoretical energy conversion efficiency, is determined by the species of oxidant and reductant, in accordance with the Nernst equation [4]. For example, the theoretical electromotive force of an H2/O2 fuel cell is 1.23 V, and the maximum efficiency is 83 % (HHV) at room temperature. However, the actual cell operation voltage is generally less than 0.9 V, which is much lower than the theoretical voltage due to the kinetic voltage loss caused by a reaction overvoltage (active overvoltage) and mass transfer overvoltages. The reaction overvoltage is dominated by catalytic activity in the electrodes, in accordance with the Butler-Volmer equation, and mass transfer overvoltages are determined by the mass transport kinetic resistances of O2, H+ and electrons in the CL, GDL, and membrane, as shown in Fig. 1-5. In particular, the overvoltages of the cathode are much larger than those of the anode, owing to the low ORR activity of Pt, as compared to about 10,000 times faster HOR activity [4]. Thus, it is necessary to employ a large amount of Pt catalyst in the cathode, and that can cause the increase of the total fuel cell cost.
The mass transfer overvoltages and reaction overvoltage can be assessed in the following procedures. First, the cell performance is evaluated by measuring cyclic voltammetry (CV) and the i-V curve in air and O2 from the open circuit voltage (OCV) to more than 1.0 A/cm2 (Fig. 1-5). The cell resistance is also recorded with an AC milliohm-meter at a frequency of 1 kHz during the i-V measurement. The AC impedances are measured with a fuel cell test load in combination with a frequency response analyzer applying an alternating current. Next, each overvoltage is divided in the following data treatment. The O2 mass transfer overvoltage is estimated by the difference between the voltages observed with air and O2 at the same current, which is known as O2 gain. The IR loss, which contains both H+ conduction overvoltage of the membrane and electron conduction overvoltage of the GDL and separators, can be calculated by the ohmic resistance measured by the milliohm-meter. The H+ conductive resistance in the CL can be calculated by use of the Nyquist plots obtained from the AC impedance measurement in accordance with the previous study [5]. Finally, the reaction overvoltage can be evaluated by the difference between the theoretical voltage and the extrapolation line of the Tafel slope with O2 feed (Fig. 1-5). The catalytic activity is generally discussed by comparing the mass activity (MA (A/gPt)) and specific activity (SA (A/m2Pt)). MA is defined as the current density (A/cm2) at 0.9V in O2 divided by the Pt loading (gPt/cm2) in the electrode, and SA is defined as the MA divided by ECSA (m2Pt/gPt), which is measured by CV (Fig. 1-6).
Figure 1-5. Cell i-V curves and overvoltages.
Current density / A cm
-2
Ce
ll
vol
tag
e
/ V
E
ocv
1.23
η
O2
η
reaction
η
H+
IR
Actual voltage
Theoretical voltage
-0.2
-0.1
0.0
0.1
0.2
0.0
0.2
0.4
0.6
0.8
1.0
i
/
m
A
cm
2 0.95ECSA= (Q
a+Q
b)/2
QaZ’, Real /ohm-cm
2-Z
’’,
Im
a
gi
na
ry
/o
hm
-cm
2 QcR/3
45°1-5 Current issues and challenges
To foster more widespread commercialization of PEFCs, several economic and technological barriers need to be overcome. Figs. 1-7 and 1-8 shows the New Energy and Industrial Technology Development Organization (NEDO) future roadmap of PEFCs for stationary and automotive applications in Japan [6,7]. The target cost, efficiency, and durability of the stationary fuel cell in the 2030s are less than ¥40,0000 (system cost), more than 40% LHV, and 90,000 hours, respectively. The target values for FCVs are less than ¥50,0000 (system cost), more than 60% LHV, and more than 15 years lifetime, respectively. To meet these targets, it is necessary to modify the MEA configuration. As described in the previous sections, Pt catalysts significantly influence the total PEFC cost and performance, and thus both Pt activity and Pt utilization should be improved to reduce Pt loadings in the MEAs while maintaining the cell performance. The activity can be enhanced by alloying Pt with other non-precious metals (see Chapter 5), and the utilization of Pt can be improved by modifying the CL structures. However, the CL structure has not been optimized sufficiently due to the nano-scale heterogeneous configuration. In addition to the cell performance, the chemical and mechanical stability of the MEAs are also important for the PEFC durability. The polymer structure of the membrane should be modified to improve the tolerance against radical attack and mechanical stress, which cause serious and rapid MEAs deterioration. Furthermore, not only the membrane properties but the MEA configuration can influence the cell durability, because mechanical stress is added to the MEA when the cell is fastened. In summary, modification of the structures of MEA, CL, and membrane are keys to improve the PEFC performance and durability while reducing its cost. However, although many previous studies have focused on investigating the materials and the composition of the MEAs, there are few studies discussing the MEA design from the structural point of view.
Figure 1-8. Cost, performance, and durability targets for stationary fuel cell systems and
FCVs in Japan.
1-6 References
[1] Arno A. Evers, The Hydrogen Society: More Than Just a Vision? 2010.
[2] J. Larminie and A. Dicks, Fuel Cell Systems Explained Second Edition, Wiley, 2003. [3] https://www.hydrogen.energy.gov/pdfs/15015_fuel_cell_system_cost_2015.pdf. [4] 荒又 明子, 燃料電池の電極触媒, 北海道大学図書刊行会
[5] R. Makharia, M. F. Mathias, and D. R. Baker, J. Electrochem. Soc., 152 (5) (2005) A970-A977. Efficiency Efficiency Durability Durability Temperature System cost System cost Temperature
Roadmap of stationary fuel cell system
Chapter 2. Objective and storyline of Ph.D. Thesis
2-1 Objective
The objective of this study focuses on the structure-based design of MEAs for higher performance and durability in PEFCs. Structures of membrane, GDL, and the overall MEA configuration were modified to enhance the MEA durability. CL structures were designed to decrease mass transfer resistance and to increase the Pt catalyst utilization. These structures were constructed from both experimental and computational approaches at a range of scales from nm to mm. The effects of the structural properties on the cell performance and the durability were analyzed, and their physical kinetics and chemical reactions in the MEA were discussed specifically. Finally, based on the structural modification techniques and the knowledge obtained from the analysis, new concepts of MEA structures achieving both higher performance and higher durability were suggested.
2-2 Storyline of Ph.D. Thesis
The Ph.D. thesis consists of 5 Chapters (Chapters 3-7), as shown in Fig. 2-1. In Chapter 3, the structures of MEAs were designed to enhance the mechanical durability under wet-dry cycling. I found that the membrane deteriorated particularly at the edge region of the MEAs due to the mechanical stress concentration caused by the wet-dry cycling. Then, the MEA edge configuration was modified to alleviate the stress by use of a soft GDL and a subgasket. In Chapter 4, for further durability enhancement of the MEAs, the mechanical properties of the membrane were controlled by modifying the polymer structures. The durability of the membranes with different mechanical properties was evaluated by use of wet-dry cycling testing, and the structural changes of polymers in the membrane were analyzed after the cycling. By discussing the degradation mechanism of the membrane, the mechanical durability of the membrane was enhanced significantly by restricting dimensional changes in wet-dry cycling and enhancing the mechanical strength of the new hydrocarbon membrane. In Chapters 5 and 6, structures of the CLs were designed to enhance mass transfer and Pt utilization in the CL for higher cell performance. In Chapter 5, CL structures using a new unsupported Pt-Ni catalyst were developed. The CLs using different catalyst shapes (nanoblocks and nanochains) were prepared, and the effects of catalyst shape on the CL structure and the cell performance were investigated by use of focused-ion-beam scanning electron microscopy
(FIB-SEM) and computational modeling. Furthermore, the role of filler materials (K2CO3), which was removed later by acid-washing, on the CL structures is discussed in the same way with the use of case studies. In addition to the catalyst shape, the fabrication process can also influence the CL structures. Thus, in Chapter 6, three types of CLs prepared by different fabrication processes (coating and drying in the experiment) were computationally modeled, and the structural features of each CL were investigated. Structural properties such as pore size distribution, porosity, tortuosity, ionomer coating thickness and ionomer coverages on Pt were calculated numerically and separately, and the relationship between fabrication process and cell performance is discussed specifically. In Chapter 7, from the results of the structural modifications in Chapters 3-6, new concepts of MEAs achieving both higher performance and higher durability are suggested.
2. Introduction
Structural designing of MEAs
3. Structure of MEA
5. Structure of CLs/material
4. Structure of membrane 6. Structure of CLs/process
Durability
Performance
3-1. MEA edge configuration
3-2. Mechanical durability & degradation
5-1. CLs using ball-type and bar-type catalyst 5-2. FIB-SEM/modeling analysis
7. New concepts of MEA structures
4-1. Polymer structural modification4-2. Durability & polymer degradation
6-1. Modeling of CL fabrication process 6-2. Structural analysis and optimization
Chapter 3. Structure of MEAs
3-1 Background: MEA configuration and durability
3-1-1 Configuration of MEAs
Single PEFCs generally consist of MEAs, separators (bipolar plates), current collectors, gaskets, and end plates, as shown in Fig. 1-3. MEAs comprise a polymer electrolyte membrane (e.g., Nafion) and electrodes, cathode and anode, each consisting of a gas diffusion layer (GDL), a microporous layer (MPL), and a catalyst layer (CL). The GDL consists of porous material composed of a dense array of carbon fibers, which provides an electrically conductive pathway for current collection and PTFE as a binder of the carbon fibers. The MPL is composed of carbon black (e.g., acetylene black (AB)) and PTFE to drain liquid water by use of the capillary force. The CLs form nano-scale porous structures composed of carbon-supported Pt (Pt/C) and ionomer (e.g., Nafion) for the ORR and HOR.
3-1-2 Structure of MEAs and mass transfer and reaction in the MEAs.
In the fuel cell operation, humidified reaction gases (e.g. H2, Air, O2) were supplied to the anode and cathode of the cell. Through the separator flow-fields, the gases were homogeneously distributed to the whole electrodes. In the electrodes, the gases access the Pt catalyst surface by passing through the pores of the GDL, MPL, and CL, and generated water is drained outside of the cell through the pores after the ORR takes place on the Pt surface, as shown in Fig. 1-4. Hence, the pore structures of the GDL, MPL, and CL significantly influence of the cell performance, and it is necessary to design pore structures to reduce O2 diffusion resistance. The membrane and ionomer structure in the CL influences the H+ conduction, and the carbon structure in the CL, MPL, and GDL influences the electron conduction, which also impacts the cell performance.
3-1-3 Mechanical durability of MEAs
The durability of the PEFCs is also a key issue for enhancing the reliability and increasing the economic and ecological benefits of the fuel cell as a product. The degradation of MEAs during the fuel cell operation was analyzed specifically in the previous studies. The degradation modes of MEAs were suggested by the FCCJ [1] and divided mainly into chemical degradation and mechanical degradation [2]. Although many studies were focused on investigating the chemical degradation of MEAs and enhancing the chemical stability of the membrane against radical attack (see Chapter 4), there have been few studies reporting on the mechanical durability of the MEAs. During fuel cell operation, the MEAs experience compressive force between the bipolar plates, and the membrane swells and shrinks repeatedly in the cell due to temperature and humidity cycles. These physical
stresses cause various types of mechanical degradation of the membrane, including irreversible deformation (e.g., creep), thinning, and rupture. In particular, hydrocarbon membranes are mechanically weaker than fluorocarbon membranes, and that could be a serious issue for the MEA durability [3]. One of the approaches to mitigate the mechanical degradation is to enhance the mechanical properties of the hydrocarbon membrane, as described in Chapter 4. Another approach is to modify the MEA configuration to reduce the physical stress to the membrane generated by wet-dry cycling. In our previous studies, I found that the hydrocarbon membrane consisting of sulfonated polybenzophenone poly (arylene ether ketone) (SPK) polymers (Fig. 3-1) ruptured typically at the edge region of the MEA at the very early stage of the mechanical durability tests [4], and it was assumed that there was specific membrane degradation in that region.
3-2 Purpose of the study
Thus, in the present work, the mechanical degradation mechanism of the MEA using a hydrocarbon membrane and various strategies to enhance the mechanical durability, including reinforcing modifications, are discussed, focusing particularly on the edge configuration of the MEA. Three types of edge configurations of the MEA were prepared, and the effect on the durability during mechanical stress was evaluated for each. During the durability cycling, the mechanical degradation of the SPK membranes was analyzed by monitoring the percentage of H2 gas crossover through the membranes. In the post-test analysis, the membrane mechanical properties were analyzed by means of a tensile test, and the SPK polymer properties were analyzed by size exclusion chromatography (SEC). Based on these results, the degradation mechanism in each configuration of the MEA is discussed.
3-3 Experimental
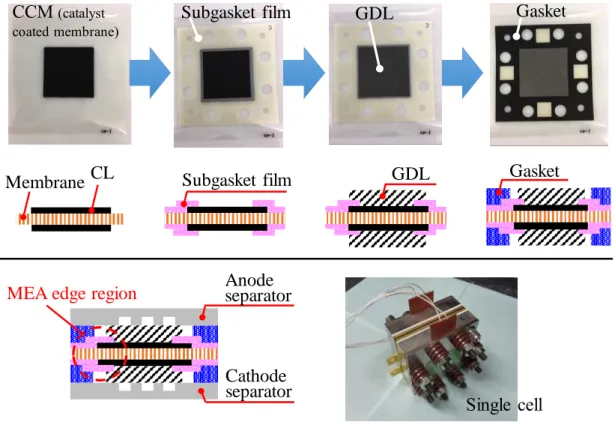
3-3-1 MEA configuration
loadings of the anode and cathode were 0.3 mg cm-2 and 0.6 mg cm-2, respectively. The geometric CL electrode area was 36 cm2 (6 cm × 6 cm). The resulting catalyst coated membrane (CCM) was annealed at 160°C for 5 min. The MEAs were constructed by sandwiching the CCM between two GDLs with MPLs. Two types of GDL were used for the durability cycling. The first type was a conventional paper GDL (240 μm, SGL-25BCH, SGL Carbon Group Co., Ltd.). The second was a soft-type GDL, which was prepared by the procedure described below. According to work of Yamauchi and Tsuji [6,7], the soft GDL was prepared as follows. The GDL slurry was prepared by mixing acetylene black, graphite, polytetrafluoroethylene (PTFE), and surfactant solution. The GDL sheet was constructed by kneading and rolling the slurry. By heating the sheet at 300°C in the furnace, the surfactant and solvent were removed, and the porous structure was formed. The sheet thickness and porosity were adjusted to ca. 400 μm and ca. 50%, respectively, by rolling the sheet again. The shear stiffness and bending stiffness of the soft GDL were more than 10 times lower than those of the paper GDL due to the absence of PTFE-bonded hard carbon fibers.
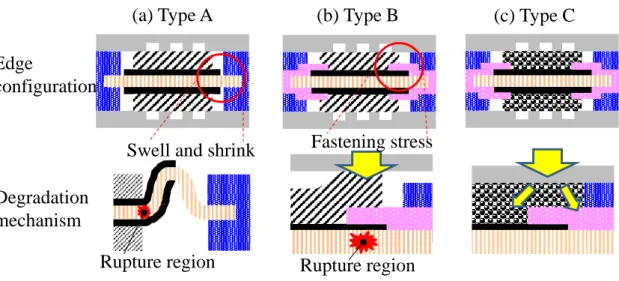
The MEA was mounted in a single-cell holder composed of two carbon separator plates with ribbed single-serpentine flow channels. An image of the cell and the specific information of the separator flow-fields are shown in Fig. 3-2 and Table 3-1 respectively. The cell was fastened to generate a force of 10 kgf cm-2. The compressive force was passively controlled by optimizing the amount of the spring strain in the cell when it was fastened. The compressive force was measured by inserting pressure-sensitive paper in the cell. Three types of MEA edge configuration were prepared. Cross-sectional images of each configuration are shown in Fig. 3-3. Type A is the basic configuration, which includes no edge modifications in the MEA. In type B, a sub-gasket (SG) film, which was a 38 μm thick poly phenylene sulfide (PPS) sheet, was introduced in the edge region of the MEA. In type C, the paper GDL of type B was replaced with a soft GDL.
Figure 3-1. Chemical structure of sulfonated polybenzophenone poly (arylene ether
ketone) (SPK) block copolymer.
Figure 3-2. Cell fabrication process and the schematic cross-sectional image.
Figure 3-3. The schematic cross section image at the edge configuration of MEA for
Subgasket film
GDL
Gasket
CCM
(catalyst coated membrane)Subgasket film
GDL
Gasket
CL
Membrane
Anode
separator
Cathode
separator
MEA edge region
Single cell
Type A
Type B
sub gasket (SG)
soft GDL
Type C
gasket
membrane
paper GDL
Table 3-1. Separator flow-fields of a single cell.
Separator
Anode
Cathode
Channel
Flow-path type
Serpentine
Serpentine
Width
1 mm
1 mm
Depth
1 mm
1 mm
Number of flow-paths
2
6
Number of turns
20
6
Land
Width
1 mm
1 mm
3-3-2 Cell performance testing of each GDL
The cell performance of each GDL was measured according to the following procedure. H2 and air were supplied to the anode and cathode, respectively. First, the cell was mounted on the test bench, and both inlet and outlet gas tubes were connected to the cell. H2 and air were supplied to the anode and cathode with gas stoichiometries of 1.4 and 2.5, respectively. The cell temperature was maintained at 80°C, and the dew points of the gases were set to 65°C. The voltage and IR loss at 0.3 A cm-2 were measured by use of an ohmmeter. Furthermore, the cathode gas was switched to O2, and the O2 gain, which is defined as the difference between the voltages observed with air and O2 at the same current, was measured.
3-3-3 Mechanical durability cycling
The United States Department of Energy (USDOE) protocol was used as the method for the mechanical durability evaluation [8,9]. H2 and N2 gases were supplied to the anode and cathode, respectively. For both gas lines, humidified (“wet”) and dry gas lines were prepared (Fig. 3-4). Humidification of the wet gas was carried out by passing through a gas-sparging humidifier at 90°C. During the durability evaluation, the wet and dry gases were toggled every 2 min, and thus the membrane repeatedly swelled and shrank quickly, so that the mechanical degradation was accelerated. The anode and cathode gas flow rates were both set to 2 standard liters per minute (slm). The cell temperature was maintained at 80 °C, and the dew points of the gases were 90°C (wet) and less than 0°C (dry). During the durability cycling, the membrane degradation was analyzed by measuring the percentage of H2 crossover through the membrane. The percentage of H2 crossover
(%HCO) is defined as follows:
%𝐻𝐶𝑂 =𝑉𝐻2,𝑐𝑎𝑡ℎ𝑜𝑑𝑒,𝑜𝑢𝑡𝑙𝑒𝑡𝑉
𝐻2,𝑎𝑛𝑜𝑑𝑒,𝑖𝑛𝑙𝑒𝑡 × 100
where VH2,anode,inlet is the flow rate of H2 measured for the inlet gas stream before passing through a gas-sparging humidifier at a temperature of 23°C and a pressure of 1 atm. VH2,cathode,outlet is the flow rate of H2 calculated from the percentage of H2 present in the total outlet gas from the cathode. The H2 percentage in the cathode outlet gas was measured according to the following procedure. Both the cell temperature and the dew points of the anode and cathode gases were maintained at 60°C. The anode and cathode gas flow rates were both set to 0.3 slm. The cathode outlet gas, which included N2, H2O, and H2, was dehumidified by passage through an ice bath. Then, a 2-mL gas aliquot was sampled at a temperature of approximately 23°C and a pressure of 1 atm, and was injected into a gas chromatograph (GC-8A, Shimadzu Co.). The accumulated area of H2 peak in the chromatograph was calculated, and the H2 percentage was determined by comparing with the area of a 1% H2 gas standard. The H2 percentage determined by GC was equal to the H2 percentage in the cathode outlet gas after the dehumidification. VH2,cathode,outlet was calculated by multiplying the H2 percentage and the cathode inlet flow rate.
H
2gas
N
2gas
Dry gas line
Wet gas line
Valve
Cathode line
Anode line
3-3-4 Post-test analyses
After the durability cycling, the cells of each MEA configuration were disassembled. The SG and GDL were removed from the MEA, and the membrane degradation for types A, B, and C was analyzed. The rupture region of the membrane was identified by means of a helium gas leak test. In this test, the MEA was attached to the helium leak inspection apparatus. Helium gas was supplied to one side of the MEA, and the amount of helium leakage through the membrane was detected on the other side of the MEA by the helium leak detector (UL200 Ver. 4, INFICON Co., Ltd.). In the plane of the MEA, electrode area of 36 cm2 was divided 36 (6 × 6) regions at 1 cm2 each and the helium leak rate was detected in each region.
The tensile strength of the membrane was measured by use of a universal tensile-compression testing machine (SVZ-50Nb-5R2, IMADA-SS Co.). Stress versus strain curves were obtained for samples cut into a dumbbell shape (10 mm × 35 mm (total) and 10 mm × 20 mm (test area)) and fixed to a flat metal block. The measurement was conducted at 23°C and 50% RH at a stretching speed of 10 mm min-1.
The molecular weight of the SPK polymer was measured by a size exclusion chromatograph (SEC) equipped with two TOSOH TSKgel a-M and a-3000 columns and a Showa Denko RI-71 refractive index detector. N,N-dimethylformamide (DMF) containing 0.05 M LiCl and 0.01% HCl was used as the eluent at a flow rate of 0.8 mL min-1. The average molecular weight was calibrated with standard polystyrene samples.
Hydrophilic and hydrophobic phase separation structure in the membrane was observed by use of the TEM. The sulfonic acid groups were stained with lead ions by immersing the samples overnight in 0.5 M lead acetate aqueous solution. Then the membranes were rinsed with deionized water and dried in a vacuum oven for 12 h. The stained membranes were embedded in epoxy resin, sectioned to 90-nm thickness, and images were taken on a TEM (H7100FA, Hitachi High-Technologies Corp.) with an accelerating voltage of 200 kV.
3-4 Results and discussion
3-4-1 Cell performance of each GDL
Fig. 3-5 shows the results of the performances of the cells that included the paper GDL and soft GDL. The soft GDL exhibited almost the same voltage as that for the paper GDL at 0.3 A cm-2. There were also small differences in IR loss and O2 gain between the two GDLs. Although the gas permeability of the soft GDL is lower than the paper GDL, it was assumed that the humidity retention and gas diffusive resistance values for both GDLs were nearly the same for current densities below 0.3 A cm-2. Therefore, the type of GDL did not exert a significant influence on the cell performance.
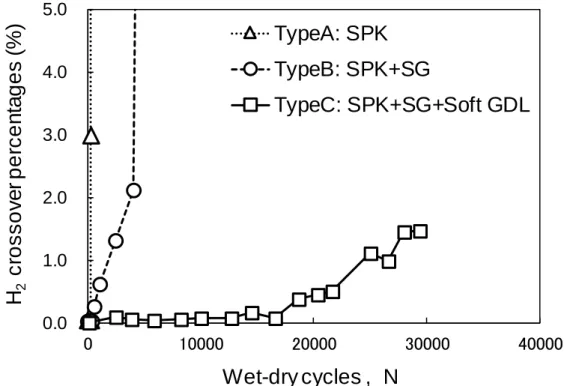
3-4-2 Durability evaluation by DOE stress protocol
The results of the DOE durability cycling in each configuration of the MEA are shown in Fig. 3-6. In type A, the H2 crossover percentage in the cathode outlet gas increased sharply after just 300 cycles due to a membrane rupture. The membrane ruptured in the edge region of the MEA, which indicated that the membrane mechanical stress at the edge was higher than that in the main part of the electrode. The detailed degradation mechanism of the membrane will be discussed in Section 3-4-5.
In type B, the membrane durability was enhanced, and the H2 crossover percentage did not increase sharply until 4,000 cycles. It was concluded that the membrane stress was reduced as a result of the modification using the SG film at the edge of the MEA. However, the membrane ruptured at 4,000 cycles due to the insufficiency of the modification.
In type C, both the modification by the SG and the use of the soft GDL were effective in increasing the durability of the SPK membrane to 30,000 cycles. The durability met the USDOE target of 20,000 cycles for fuel cell vehicle usage. Even though the H2 crossover percentage increased gradually after 15,000 cycles, no sharp increase was observed. When the cell was disassembled after the durability cycling, the soft GDL was strongly bonded to the membrane, whereas the SG was very easily detached from the membrane. These results indicate that the soft GDL was a key factor in reducing the membrane mechanical stress and led to an enhanced mechanical durability of the membrane.
Figure 3-5. Cell performances for each GDL type: cell voltage (black bars), IR loss
(silver bars), and O
2gain (white bars).
Figure 3-6. Hydrogen crossover percentages through the membranes in the various
MEA edge configurations: type A (open triangles); type B (open circles); type C (open
squares); during the durability cycling.
0.0
1.0
2.0
3.0
4.0
5.0
0
10000
20000
30000
40000
H
2c
ro
s
s
o
v
e
r
p
e
rc
e
n
ta
g
e
s
(
%
)
Wet-dry cycles , N
TypeA: SPK
TypeB: SPK+SG
TypeC: SPK+SG+Soft GDL
0 20 40 60 80 100 120 140 160 180 200 600 620 640 660 680 700 720 740 760 780 800 SGL Paper Soft GDL V o lt a g e / m V V o lt a g e / m V3-4-3 Analysis of mechanical properties
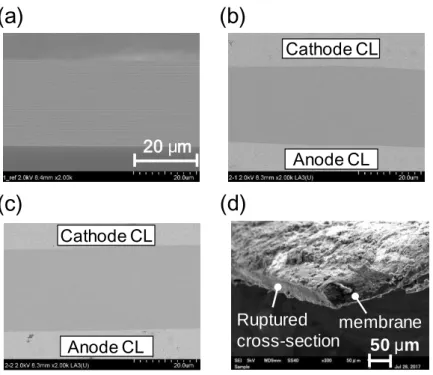
After the durability evaluation, the cells using each MEA configuration were disassembled, and the membrane degradation and mechanical properties were analyzed. Fig. 3-7(a) shows photographic images of the type B MEA configuration. A crack in the membrane was observed in the top left region. The membrane ruptured along the edge of the SG film. Fig. 3-7(b1) shows an image of the type C MEA configuration, in which the membrane was modified by both the SG and the soft GDL. No apparent cracks were observed in the membrane. To investigate the possible presence of pinholes in the membrane, the helium leakage was checked in 36 regions in the plane of the MEA (Fig. 3-7(b2)). In the pristine membrane, the leakage rates were less than 1.0 × 10⁻⁵ Pa m3 s-1 in all regions, while the rate increased to more than 1.0 × 10⁻³ Pa m3 s-1 in the deteriorated membranes in which there was complete rupture, i.e., types A and B. The leakage rates for the type C membrane were less than 1.0 × 10⁻⁴ Pa m3 s-1 in all regions, and it was concluded that the membrane, even though deteriorated to some extent, did not contain large pinholes. These results indicate that the edge of the membrane was modified by the soft GDL, and the mechanical durability was enhanced.
The mechanical properties of the SPK membrane used in the type C configuration were analyzed by use of the tensile tester. The stress-strain curves of the pristine membrane and three regions of the membrane in type C were compared (Fig. 3-8). After the durability evaluation of 30,000 cycles, the strain percentages at the rupture point of all regions in type C were significantly decreased, but to varying degrees in each region. The rupture strain percentage of the membrane in the electrode region, which was contacted with the soft GDL, retained about 50% of that for the pristine membrane. On the other hand, the rupture strain values in both the SG edge region and the peripheral region outside the electrode, which were still in contact with the SG, decreased significantly, to less than 20% of the pristine value. The reduction of the membrane rupture strain represents the degree of irreversible deformation. These results indicate that the membrane in the type C configuration deteriorated mechanically, and the materials that were in contact with the membrane were key factors in enhancing the membrane mechanical durability.
Figure 3-7. (a) Photographic and schematic images of the type B MEA after durability
cycling; (b1) photographic image of the type C MEA after cycling; and (b2) graph of
the helium leakage rates in the planar direction of the type C MEA after cycling.
Figure 3-8. Tensile strengths of the SPK membranes: pristine membrane, and membrane
in the type C MEA in the electrode region, peripheral region, and SG edge region after
the durability cycling.
0 10 20 30 40 50 0.0E+00 1.0E-04 2.0E-04 3.0E-04 4.0E-04 5.0E-04 0 10 20 30 40 50
(b1)
(a)
Membrane Catalyst layer Rupture region He li um lea ka g e ra te / P a m 3se c -1 (SG edge)(b2)
/ mm / mm 1-1 1-2 1-3 2-1 2-2 3-1 3-2 3-3 Tensile tester: SHIMADZU EZ graphArea 1. Electrode region
Area 2. Peripheral region Area 3. SG edge region 0 10 20 30 40 50 60 70 80 0 20 40 60 80 100 120 140 160 180 200
pristine electrode region (n=3)
SG edge region (n=3) peripheral region (n=2)
Rupture point
Strain (%) Str es s / MP a3-4-4 Analysis of chemical properties
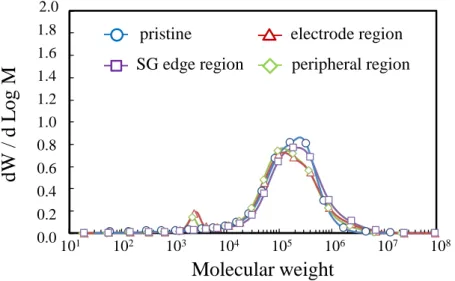
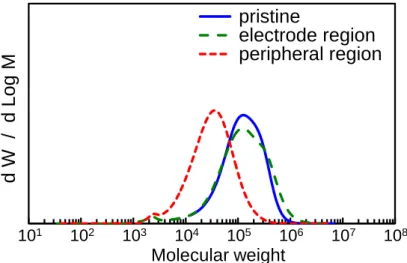
The chemical state of the SPK polymer before and after the stress evaluation was examined by use of SEC analysis (Fig. 3-9). In Table 3-2, the average values of Mw for the SPK polymers were higher after the stress evaluation than that of the pristine polymer, although there were small peaks in the low Mw (ca. 2-3 kDa) region, indicating chain breakage. As compared to the pristine polymer, the main Mw peak for the three membrane regions decreased in intensity after the durability cycling, while the intensity for Mw > 106 increased (see Fig. 3-9). The increase of the Mw could be due to ionic cross-linkage between the SPK polymer chains. The IEC of the SPK polymer was evaluated by 1H NMR after the durability cycling (Table 3-2). The IEC values in each region decreased about 10% from the pristine value, which was 2.7 mmol g-1. After the durability cycling, it decreased to 2.4 mmol g-1 in the electrode region, 2.4 mmol g-1 in the peripheral region, and 2.5 mmol g-1 in the SG edge region. It was considered that the SPK polymer degraded chemically to a certain extent as a result of the durability cycling. That could be due to the same type of ionic crosslinkage of the acid sites in the SPK polymer mentioned above, but not due to a significant breakage of the polymer chain.
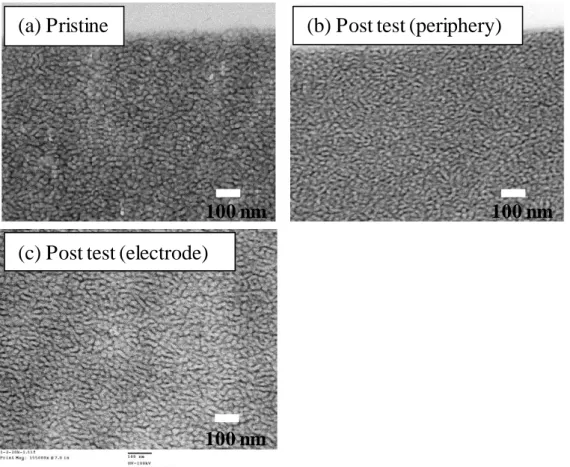
Fig. 3-10 shows TEM images of the pristine membrane and the membrane in the peripheral region of the type C configuration. These membrane samples were ion exchanged with lead (Pb2+) ions prior to observation so as to stain the hydrophilic domains in black. The white spots represent hydrophobic clusters of the SPK. The pristine membrane had a clear hydrophilic network, which indicates the well-developed phase separation between hydrophilic and hydrophobic blocks, as previously reported. After the stress evaluation, the hydrophilic network was degraded, and the black spots were less connected with each other. These results suggest that the phase separation structure deteriorated as a result of the mechanical stress encountered during the wet-dry cycling, in which the SPK polymer swelled and shrank repeatedly.
Figure 3-9. SEC curves for the SPK polymer: pristine (blue circle), and type C in the
electrode region (red triangle), SG edge region (purple square), and peripheral region
(green diamond) after the durability cycling.
Table 3-2. Weight-averaged molecular weights (Mw) and IEC values of pristine and
type C polymer after the durability cycling.
Mw (10
3)
IEC (mmol g
-1)
pristine
258
2.66
electrode region
369
2.41
SG edge region
465
2.40
peripheral region
306
2.52
0.0 0.2 0.4 0.6 0.8 1.0 1.2 1.4 1.6 1.8 2.0 1.00E+011.00E+021.00E+031.00E+041.00E+051.00E+061.00E+071.00E+08101 102 103 104 105 106 107 108 2.0 1.8 1.6 1.4 1.2 1.0 0.8 0.6 0.4 0.2 0.0pristine
electrode region
SG edge region
peripheral region
dW
/ d
L
og
M
Molecular weight
Figure 3-10. TEM images of lead ion-stained (a) pristine SPK polymer, (b) periphery
region, and (c) electrode region in type C after durability cycles.
(a) Pristine
(b) Post test (periphery)
100 nm
100 nm
100 nm
3-4-5 Discussion of degradation mechanism
Based on these results, the degradation mechanism of the SPK membrane is discussed. Fig. 3-11 shows schematic cross-sectional images of each configuration. In the type A configuration, the membrane in the electrode region was held in place by the GDL, and the peripheral region of the membrane was held in place by the gasket. In these regions, the membrane was not able to swell and shrink significantly during the wet-dry cycles (Fig. 3-11(a)). In contrast, the membrane in the edge region of the electrode was able to swell and shrink easily during the cycling due to the lack of restriction of dimensional change. Therefore, the membrane deformed and ruptured in the edge region. In the type B configuration, the SG films were placed in the edge region of the electrode and on the peripheral region of the membrane surface (Fig. 3-11(b)). The membrane in the edge region was fixed by the SG, and the membrane swelling and shrinking were restricted. However, the effect of the SG was small, and the membrane ruptured in the edge region after 4,000 cycles. This result can be attributed to the fact that the fastening stress was concentrated in the edge region due to the uneven thickness of the MEA. The thickness in this region was relatively higher than that of other regions, because the GDL, using a hard paper, was located on the SG film at the edge. Higher compression in the SG area causes higher shear stress in the region of the subgasket edge compared with that in the electrode region. Therefore, the membrane ruptured at that point due to the concentration of the fastening stress. In the type C configuration, both the SG and the soft GDL were introduced to prevent the fastening stress concentration (Fig. 3-11(c)). Even though the thickness of the MEA in the edge region was uneven, the soft GDL deformed easily and relieved the fastening stress in this region due to a cushioning effect. Furthermore, the deformed soft GDL adhered and held the membrane more strongly than the paper GDL. I propose that the strong adhesion might have lessened the membrane shrinking and swelling. Consequently, the stress at the edge of the membrane decreased. Therefore, the membrane durability was significantly improved, so that a durability of 30,000 cycles was achieved. However, the results of the stress-strain curve indicated that the membrane had still been mechanically degraded. Specifically, the membrane at the SG edge and in the peripheral region was significantly degraded. It was considered that the membrane swelled and shrank not only in the electrode region but in the SG edge region and the peripheral region during the wet-dry cycles in the small cell. In the small cell, water can diffuse easily in the planar direction inside the membrane and reach the peripheral region. Furthermore, the membrane in the electrode region was bonded strongly by the soft GDL, while the membrane at the SG edge and in the peripheral region was not bonded by the SG. Both the cushioning effect and strong adhesion of the soft GDL in the electrode region may have resulted in a lessening of both strain and irreversible deformation. For the further improvement of mechanical durability, it is important to reduce the mechanical stresses on the membrane and also to restrict the dimensional changes. For instance, introducing a thinner SG film could be effective in reducing the mechanical stresses in the SG edge
region. Introducing a cushioning bonding layer between the SG and the membrane might be effective in reducing the stress concentration in the edge region of the MEA. It also might be effective to introduce a core substrate material into the membrane to restrict the dimensional changes of the membrane.
Figure 3-11. Schematic diagrams of the various edge configuration of the MEA and
their membrane degradation mechanisms: (a) type A; (b) type B; and (c) type C.
(a) Type A
(b) Type B
(c) Type C
Rupture region
Degradation
mechanism
Rupture region
Fastening stress
Edge
configuration
3-5 Summary
The mechanical durability of the hydrocarbon membrane in various MEA configurations was examined, and its degradation mechanism was discussed. The membrane in the edge region of the MEA was ruptured due to membrane swelling-shrinking and mechanical stress concentration. The modifications of both the SG and the soft GDL were effective in both preventing the swelling-shrinking of the membrane and reducing the stress concentration due to the fastening. The mechanical durability was improved by a factor of more than 100, so that the SPK membrane achieved 30,000 cycles during the evaluation of the DOE dry-wet protocol with the new modified configuration. The post-test analyses indicated that the mechanical strain of the membrane was reduced by about 50% in the electrode region and more than 80% in the edge region.
3-6 References
[1] http://fccj.jp/pdf/23_01_kt.pdf[2] R. Borup, J. Meyers, B. Pivovar, Y.-S. Kim, R. Mukundan, N. Garland, D. Myers, M. Wilson, F. Garzon, D. Wood, P. Zelenay, K. More, K. Stroh, T. Zawodzinski, J. Boncella, J.E. McGrath, M. Inaba, K. Miyatake, M. Hori, K. Ota, Z. Ogumi, S. Miyata, A. Nishikata, Z. Siroma, Y. Uchimoto, K. Yasuda, K. Kimijima, N. Iwashita, Chem. Rev. 107 (2007) 3904-3951.
[3] M.F. Mathias, R. Makharia, H.A. Gasteiger, J.J. Conley, T.J. Fuller, C.J. Gittleman, S.S. Kocha, D.P. Miller, C.K. Mittelsteadt, T. Xie, S.G. Van, P.T. Yu, Electrochem. Soc. Interface 14 (2005) 24-35.
[4] H. Ishikawa, T. Teramoto, Y. Ueyama, Y. Sugawara, Y. Sakiyama, M. Kusakabe, K. Miyatake, M. Uchida, J. Power Sources 325 (2016) 35-41.
[5] T. Miyahara, T. Hayano, S. Matsuno, M. Watanabe, K. Miyatake, ACS Appl. Mater. Interfaces 4 (2012) 2881-2884.
[6] M. Yamauchi, Y. Tsuji, JP Patent 2011-4773582.
[7] M. Yamauchi, Y. Tsuji, Membrane-electrode-assembly and fuel cell, US Patent 0,076,592 A1 (2011).
[8] DOE Cell Component Accelerated Stress Test Protocols for PEM Fuel Cells, 2007
https://www1.eere.energy.gov/hydrogenandfuelcells/fuelcells/pdfs/component_durability_profile.pdf [9] K. Miyatake, H. Furuya, Y. M. Tanaka, M. Watanabe, J. Power Sources 204 (2012) 74-78.
Chapter 4. Structure of membrane
4-1 Background: membrane modification for higher durability
In Chapter 3, the configuration of the MEA was modified, and the mechanical durability of the hydrocarbon (HC) membrane in wet-dry cycling was enhanced significantly (> 30,000 durability cycling) by utilizing a subgasket and a soft GDL at the edge region of the MEA. On the other hand, it was found that the SPK membrane was weak against mechanical stress without MEA edge modifications (maintaining only 300 durability cycles). In addition, there are some issues for these modifications, specifically, that the soft GDL was originally developed for this study and is not commercially available, and the subgasket PPS film is expensive. Hence, in this Chapter, I focused on developing a higher durability membrane against mechanical stress by modifying the HC polymer structure and the mechanical properties.4-1-1 Background of HC membranes
HC membranes are expected to be next-generation PEFC membrane alternatives to conventional perfluorosulfonic acid (PFSA) membranes (e.g., Nafion), due to their low manufacturing cost, low through-membrane gas permeability, flexibility in molecular design and environmental compatibility [1,2]. However, it is necessary to improve the proton conductivity, chemical durability, and mechanical durability to the same levels as those for the PFSA membranes under practical fuel cell operating conditions. To meet these targets, HC membranes have been developed intensively during the past decade (Fig. 4-1). For example, polymer composition and morphology have been modified to maintain high proton conductivity, even under low humidity conditions. Acid-functionalized aromatic polymers such as poly(arylene ether)s [3,4], polyimides [5,6], polybenzimidazoles [7,8], polyphenylenes, [9,10] and others [11,12] have been investigated and have been modified by attaching side-chains [13], introducing heteroatoms such as F, N, S, and P [14], impregnating acid molecules such as H3PO4 [7], and blending with inorganic powders such as SiO2 or ZrP [15,16]. Furthermore, multiblock copolymers composed of sulfonated hydrophilic segments and hydrophobic
degradation products of the membrane specifically adsorb on the Pt surface and block the oxygen reduction reaction, resulting in voltage losses [20]. In particular, HC membranes have been known to exhibit much faster degradation than PFSA membranes in the Fenton test [21]. The oxidative stability of the HC membrane is enhanced by increasing the numbers of hydrophobic groups and decreasing both the IEC value and water absorbing capacity [22]. Furthermore, the introduction of electron-withdrawing sulfone or ketone groups, as well as sulfonic acid groups, into the hydrophilic regions improved the oxidative stability of the membrane [ 23 ]. Based on this background, co-researchers and I proposed an HC membrane that was composed of a sulfonated benzophenone poly(arylene ether ketone) (SPK) semiblock copolymer (Fig. 3-1) [24,25]. This membrane exhibited higher oxidative stability than those of conventional HC membranes, due to the introduction of chemically stable components into the polymer chain. Even after a chemical durability evaluation for 980 h in membrane electrode assemblies (MEAs), the weight-averaged molecular weight (Mw) of the SPK polymer retained 94% of the original value, and the MEA maintained high performance. Furthermore, co-researchers and I have recently developed a new polymer structure composed of sulfonated phenylene poly(arylene ether ketone) (SPP) semiblock copolymer (Fig. 4-2) [26,27]. By removing ketone groups from the SPK hydrophilic segments, the proton conductivity was improved under low humidity conditions, and the oxidative stability was enhanced, even compared with that for the SPK membrane. Consequently, the SPP membrane demonstrated higher proton conductivity and chemical durability than those for Nafion-NRE212.
Figure 4-1. Variety of hydrocarbon membrane and their modification
Polymer composition
SPE (sulfonated polyether)
3,4SPP (sulfonated phenylene)
9,10SPI (sulfonated polyimide)
5,6PBI (polybenzimidazole)
7,8Additional modification
Heteroatoms (e.g. F, N, S, P)
14Acid doping (e.g. H
3PO
4)
7Polymer structure
Side chains
13Cross-linkage
38Multiblock structure
17,18Reinforcement of others
37Inorganic powder (e.g. SiO
2)
15,16Polymer orientation
364-1-2 Mechanical durability of HC membrane
It is also required for the membranes to have enhanced mechanical durability. During fuel cell operation, the MEA experiences compressive force between the bipolar plates, and the membrane swells and shrinks repeatedly in the cell due to temperature and humidity cycles. These physical and thermal stresses cause various types of mechanical degradation of the membrane, including irreversible deformation (e.g., creep), thinning, and rupture [28]. The mechanical behavior of the HC membrane has been analyzed, and the polymer structures have been modified to enhance the mechanical properties. For example, Liu et al. investigated the correlations between the morphology and the mechanical properties of Nafion and sulfonated poly(arylene ether sulfone) (SPES) membranes by means of tensile stress-strain curves [29]. In addition to the molecular weight, the hydrophobic/hydrophilic phase-separated structure influenced the yield and elongation at break. Creep resistance and membrane thinning were examined under actual PEFC conditions, and the sulfonated polyimide (SPI) had comparable durability to that of Nafion [30]. The thermal stability of the HC membrane was also examined by high-temperature (>100◦C) testing, and the sulfonated poly(ether ether ketone) (SPEEK) demonstrated longer lifetimes than that of Nafion, due to the higher glass transition temperatures (>200◦C) of SPEEK in comparison with that for Nafion (<150◦C) [31].
However, regarding the wet-dry cycle durability, HC membranes exhibited lower robustness than those for PFSA membranes [ 32 ,33 ]. In wet-dry cycling, a membrane constrained in a cell experiences in-plane compression during swelling under wet conditions and in-plane tension during shrinking under dry conditions, resulting in membrane fatigue and fracture, as also described in Chapter 3. To improve the wet-dry cycle durability of HC membranes, Miyake et al. modified the polymer structures to increase the rigidity and thus to restrict the molecular motion [34]. By involving a ladder-type structure in the hydrophilic blocks, poly(arylene ether)s exhibited little humidity dependence of the storage modulus and loss modulus in the dynamic mechanical analysis (DMA). Similar membrane physical properties were also obtained for SPP membranes and SPI membranes [26,35]. In a morphological approach, Gross et al. prepared membranes consisting of different polymer morphologies: a block copolymer exhibited higher durability than that of a random copolymer, and a membrane with a low degree of lamellar orientation exhibited higher durability than that with highly oriented lamellae [36]. Other studies focused on the modification of the membrane by cross-linking between polymers or reinforcing with materials that had high mechanical strength [37,38].
To evaluate membrane wet-dry durability while simulating actual PEFC operating conditions, Miyatake et al. measured the mechanical durability of HC membranes by means of an evaluation method involving wet-dry cycles, similar to the USDOE protocol [28,39]. The SPI membrane exhibited relatively higher durability, 10,000 cycles, without mechanical failure, most likely due to
the low in-plane swelling (ca. 3%) of the SPI membrane. However, as indicated in Chapter 3, when the similar cycle evaluation was conducted with an SPK membrane [40], the membrane ruptured mechanically in the edge region of the MEA after 4,000 cycles (in the normally used configuration of type B), which was much poorer durability than those for SPI and Nafion. To investigate the mechanical degradation of the HC membranes, Reyna-Valencia et al. analyzed the mechanical properties of sulfonated poly(ether ether ketone) (SPEEK). In liquid water at high temperatures, the modulus of the SPEEK membrane decreased, and the dimensional changes of the membrane were significant, due to water uptake and polymer swelling. These drastic changes of physical properties were repeated under USDOE wet-dry cycling test conditions, and thus, the SPK membrane was concluded to have relatively poor durability [41].
4-2 Purpose of the study
In the present work, the wet-dry cycle durability of the newly developed SPP membrane, which displayed both high chemical durability and distinctive mechanical properties, as described above, was evaluated by means of the USDOE protocol and the degradation was analyzed in comparison with the SPK membrane. The initial mechanical properties of the membrane, including stress-strain curves and dimensional changes, were analyzed by tensile testing and wet-dry cycling testing. The performance and proton conductivity of the membranes were evaluated by measuring i-V curves and ohmic resistances in the MEA. During the durability cycling with the USDOE protocol, the mechanical degradation of the HC membranes was assessed by monitoring the percentage of H2 gas crossover through the membranes. In post-test analyses, both chemical and mechanical degradations of the SPP membrane were evaluated by use of the helium cross-leakage test, cross-sectional scanning electron microscopy (SEM), stress-strain curves, size exclusion chromatography (SEC), nuclear magnetic resonance (NMR), and DMA. From the results, the degradation mechanism of the SPP membrane and the physical properties influencing the mechanical degradation are discussed in detail.
Figure 4-2. Chemical structure of sulfonated benzophenone poly(arylene ether
ketone) (SPK) semiblock copolymer and sulfonated phenylene poly(arylene ether
ketone) (SPP) semiblock copolymer.
SPK membrane
(sulfonated phenylene poly(arylene ether ketone))
SPP membrane*
4-3 Experimental
4-3-1 Analysis of mechanical properties in initial membrane
The tensile strength of the membrane was measured by use of an Imada Seisakusho SVZ-50NB-5R2 universal test machine. The measurement was conducted according to the procedure described in Chapter 3. The dimensional change of the membrane was measured by a wet-dry test. The membrane was cut into a rectangular shape (20 mm × 30 mm). The sample was dried at 105◦C under vacuum for 6 hours, and the lengths of the four sides and the thickness (three sites) of the sample were measured. After immersing in ultrapure water at 25◦C for 15 hours, the sample was sandwiched between two glass plates and the lengths of all four sides were measured. Water on the sample was wiped off quickly, and the thickness of the sample was measured at three sites. The dimensional change ratios of the membrane are defined as follows:
𝐷xy= ( 𝐿i,wet− 𝐿i,dry 𝐿i,dry ) × 100 (1) 𝐷z = ( 𝐿t,wet− 𝐿t,dry 𝐿t,dry ) × 100 (2)
where Dxy and Dz are the dimensional change ratios of the in-plane direction and through-plane (thickness) direction, respectively, Li,wet and Li,dry are the sums of the lengths of the four sides of the sample under wet and dry conditions, respectively, and Lt,wet and Lt,dry are the mean values of thickness of the sample under wet and dry conditions, respectively.
4-3-2 MEA Preparation for cell performance and durability test
The SPP membrane (ca. 30 μm thick) was prepared according to the method described previously. [22] The IEC of the SPP membrane was 2.31 mmol/g, as determined by 1H NMR spectra. 1H NMR spectra were obtained on a JEOL RESONANCE JNM-ECA400 instrument using
order to accelerate the mechanical degradation of the membrane, even though the durability using the paper GDL was lower than that using a soft GDL.
Furthermore, to compare the hydrocarbon membrane durability with a fluorinated membrane, an MEA that consisted of Nafion NRE 211 in the type B configuration was prepared. Then, the durability of three membranes (SPP, SPK, and NRE211) were evaluated by use of the USDOE wet-dry cycling test.
The initial cell performances of the SPP and SPK membranes were evaluated in the following procedure. First, the cell was mounted on the test bench (Fig. 4-3), and both inlet and outlet gas tubes were connected to the cell. H2 and air were supplied to the anode and cathode with gas stoichiometries of 1.4 and 2.5, respectively. The cell temperature was maintained at 80◦C, and the dew points of the gases were set to 65◦C. The i-V curves were measured from OCV to 1.5 A /cm2 by use of a galvanostat, and the ohmic resistances were measured at each current density by use of an ohmmeter.
The USDOE protocol was used as the method for the mechanical durability evaluation. The evaluation conditions, including gas flow rate, temperature, humidity, and wet-dry cycling times, were in accordance with the procedure described in Chapter 3. During the durability cycling, the membrane degradation was analyzed by measuring the percentage of H2 crossover through the membrane.
4-3-3 Post-test analyses
After the durability cycling, the cells were disassembled, and both the SG and GDL were removed from the MEA. The ruptured regions of the membrane were identified by means of a helium gas leak test (Fig. 4-4). The thickness changes of the membrane after durability cycling were analyzed by cross-sectional SEM. A field emission scanning electron microscope (FE-SEM) (SU-8020, Hitachi High-Technologies) was used to take SEM images with an accelerating voltage of 2 kV. The molecular weight of the SPP polymer was measured by use of an SEC system in accordance with the process described in Chapter 3. DMA measurements of the SPP membrane (5 × 30 mm) were conducted with an ITK DVA-225 dynamic viscoelastic analyzer. The measurements were conducted at the gauge length of 20 mm, strain amplitude of ~0.01 mm, which is 0.05% of the gauge length, and a frequency of 10 Hz. The humidity dependence of the storage modulus (E' (Pa)), loss modulus (E'' (Pa)), and tan δ at 80◦C was tested at a humidification rate of 1% RH /min.
Figure 4-3. The test bench for i-V measurement and wet-dry cycling.
Galvanostat
Milliohmmeter
Inlet gas tube
Outlet gas tube
Humidifier
He flow
He detector
CCM
Sample holder
He outlet
4-4 Results and discussion
4-4-1 Initial mechanical properties of each membrane
The dimensional change ratios for the SPP, SPK, and Nafion membranes are listed in Table 4-1. The in-plane dimensional change of the SPP membrane was approximately half that for the SPK membrane, and the through-plane dimensional change of the SPP membrane was relatively close to that of the SPK membrane. Unlike SPK, SPP does not include ketone groups in the hydrophilic segments and thus forms a more rigid, linear structure than that of SPK. Consequently, the molecular motion of SPP is restricted, and the free volume between SPP polymer strands is likely to be smaller than that for SPK, resulting in lower water uptake.[1] Thus, it was assumed that the membrane swelling and shrinking were restricted, and the SPP membrane exhibited lower in-plane dimensional change than the SPK membrane. The mechanical stress and irreversible deformation occurring during wet-dry cycles can be accelerated by the in-plane dimensional changes, especially under the compressed conditions in the cell. Hence, the SPP membrane can experience reduced degradation during wet-dry cycling due to the low in-plane dimensional change ratio.
4-4-2 Cell performances of SPK, SPP, and NRE211 membrane
Figs. 4-5 and 4-6 show the i-V curves of H2/Air and H2/O2 and the ohmic resistances of the cells utilizing SPK, SPP, and Nafion membrane under the 80◦C and 50% RH condition. Although the performances of the cells utilizing the HC membranes were lower than that for NRE211, the SPP membrane cell exhibited slightly higher performance than that for the SPK membrane in all current density regions. The ohmic resistance of the SPP membrane was slightly lower than that of the SPK membrane, due to the slightly higher proton conductivity of the SPP membrane under low humidity conditions.