Determinants of exchange rate arrangements in East
Asia and lessons for Vietnam
Nguyen Thu Kim
*・Junichi Hirata
**Abstract:
This paper attempts to analyze the effect of foreign direct investment (FDI) on the economic development of East Asian countries during the 1986-2006 period, and to determine the links between the FDI-led economic development with changes in exchange rate arrangements. It is found that as successful FDI-based industrialization brought about enormous changes in industrial structure and economic development, most East Asian countries tended to change to more flexible exchange rate arrangements. The changes in exchange rate arrangements may be a meaningful indicator for the exchange rate policy in Vietnam if it continues to follow the East Asian economic development model.
Key words:
East Asian countries, foreign direct investment, export-oriented industrialization, fi nancial development, exchange rate arrangement.
1. Introduction
It is undeniable that foreign direct investment (FDI) has played an important role in the economic development of East Asian countries. FDI contributed significantly to the rapid economic growth of East Asia from the mid-1980s until the Asian fi nancial crisis in mid-1997; and kept those countries from further collapse during the fi nancial crisis and in
* Correspondence to : Nguyen Thu Kim
Graduate Student of Economics, Ritsumeikan University E-mail : [email protected]
** Correspondence to : Junichi Hirata
Faculty of Economics, Ritsumeikan University / Professor 1-1-1 Noji-Higashi, Kusatsu, Shiga 525-8577 Japan E-mail : [email protected]
fostering post-crisis recovery.
Together with a high economic growth rate brought about by successful FDI-based industrialization, the exchange rate systems in most East Asian countries also became more fl exible. According to the de facto classifi cation of exchange rate regimes by Reinhart and Rogoff [2002] and the IMF’s de facto classifi cation of exchange rate regimes [2003 - 2006], most East Asian countries changed to more fl exible exchange rate regimes after the Asian financial crisis. More specifically, almost all countries had their local currencies appreciate against the US dollar during the post-crisis period.
The shift to more fl exible exchange rate systems seems appropriate, since the benefi ts of more fl exible exchange rate regimes increase as economies develop and become more integrated in global fi nancial markets (see, for example, Rogoff et al [2003], Husain et al [2004]). For East Asian economies, moving towards more flexible regimes can help to mitigate the risk from currency crises that have characterized pegged exchange rate regimes. Moreover, given the huge foreign capital inflows into East Asia, more flexible exchange rate regimes allow those countries to conduct more independent monetary policy.
Given the diverse nature of the East Asian group, it is likely that the changes in the exchange rate arrangement derive from the common characteristics of this region - the FDI-led economic development. In this paper, we attempt to analyze the economic development model in East Asian countries and the links between economic fundamentals, i.e, the FDI-led, export-oriented industrialization, and exchange rate systems in those countries.
To our knowledge, no studies have examined export-oriented industrialization as one possible factor determining East Asia’s exchange rate arrangements. Examination of this literature gap is meaningful for forecasting future exchange rate arrangements in those countries following the same East Asian model of economic development, such as Vietnam. As Vietnam is proved to have been following the development path of East Asian countries (see, for example, Nguyen and Hirata [2009]), it is expected that Vietnam will experience the same changes in its exchange rate arrangement.
The rest of the paper is organized as follows. In section 2, we analyze the effect of FDI on East Asian economic development, including export-oriented industrialization and fi nancial development, as well as the links between economic fundamentals and changes in exchange rate arrangements in those countries. In section 3 and section 4, we examine the exchange rate theories and conduct an empirical analysis on the determinants of exchange rate movements in East Asian countries. Section 5 concludes the paper with
suggestions for exchange rate arrangements in Vietnam.
2. East Asian economic development and exchange rate arrangements during
the 1986-2006 period
Over the last two decades, East Asia has achieved remarkable economic development. Besides Japan, the term “economic miracle” also applied to the four East Asian Newly-Industrialized Economies (NIEs-Hong Kong, Korea, Singapore and Taiwan), and in the 1990s, Thailand, Malaysia, Indonesia and China as growth in these countries accelerated to rates approaching those of the NIEs (Ito [2001]). Though Philippines has lagged behind its neighbors in the Association of South East Asian Nations (ASEAN), its economic growth rate was relatively comparable to other ASEAN countries in the recent period.
This section examines the FDI-led economic development and the corresponding changes in exchange rate arrangements in East Asia; and attempts to explain the links from changes in economic fundamentals to exchange rate policy.
2.1 Foreign direct investment and export-oriented industrial development
It seems hard to generalize about the reasons for East Asian economic success given the diversity of the group. As pointed out by Ravenhill [1995], the East Asian group in our study includes the world’s most populous country, China, and tiny city-states like Singapore and Hong Kong; resource-poor Taiwan and resource-rich Indonesia; ethically homogenous Korea and multicultural Malaysia. Despite these differences, all these countries have more or less relied on FDI to develop their economies. In particular, we believe that the key to the East Asian economies’ success lay in their switch to FDI-based, export-oriented industrialization.
As indicated in Figure 1 and Figure 2, FDI flows to countries in East Asia have gradually trended upward since the mid-1980s, except for Korea and Taiwan in which FDI fl ows seemed to rise later and at a much smaller scale. The increasing trend of FDI in East Asia from the mid-1980s was a result of a more open attitude of the host countries to foreign investment and the internal problems of more advanced countries, including Japan. Faced with rising costs, appreciating currencies, and widespread labor shortages, investing in regional developing countries seemed to be the appropriate strategy to sustain economic growth of advanced economies.
countries. With the help of FDI, East Asia has been able to move up the value chain ladder in industrial production, from labor-intensive industry like textiles, to higher value-added, components-intensive, assembly-based industries, such as automobiles and electronics, and fi nally to high-technology, innovation-driven industries, such as advanced microchips.
While enhancing East Asia’s industrial competitiveness, foreign investors have also played a key role in the export performance of those countries. With the massive participation of foreign companies and their local partners in exports production, share of exports in GDP increased over time in East Asia. As indicated in Table 1, the share of exports in GDP rose from 86.1 percent during the 1971-1975 period to 141.3 percent during the 2001- 2006 period in Hong Kong; from 136.6 percent during the 1976-1980 period to 179.2 percent during the 2001-2006 period in Singapore; from 47.7 percent
-6000 -4000 -2000 0 2000 4000 6000 8000 10000 1970 1972 1974 197 6 1978 198 0 1982 1984 1986 1988 199 0 1992 1994 1996 199 8 2000 2002 2004 2006 Mi ll io n U S $
Indonesia Thailand Malaysia Philippines
Figure 1: Foreign direct investment fl ows in ASEAN-4
Source: UNCTAD [2007] -10000 0 10000 20000 30000 40000 50000 60000 70000 80000 1970 1972 1974 1976 1978 1980 1982 198 4 198 6 1988 1990 199 2 1994 199 6 1998 2000 2002 2004 200 6 Million US$
Hong Kong Singapore Taiwan Korea China
Figure 2: Foreign direct investment fl ows in NIEs and China
during the 1981-1985 period to 51.7 percent during the 2001-2006 period in Taiwan; and from 23.3 percent during the 1971-1975 period to 32.9 percent during the 2001-2006 period in Korea. In addition, the increased local contents in export values contributed to trade surplus being achieved in NIEs. It can be observed from Table 1 that the share of exports in GDP surpassed the share of imports in GDP in Hong Kong (from 1971 to 2006), Singapore (from 1991 to 2006), Taiwan (from 1981 to 2006), and Korea (from 1986 to 1990).
Among ASEAN-4 countries, Malaysia and Thailand recorded the most considerable increase in the share of exports in GDP. Export share in GDP increased from 40 percent during the 1971-1975 period to 98.2 percent during the 2001-2006 period in Malaysia; and from 18.5 percent to 56.6 percent in Thailand. On the other hand, Philippines nearly doubled its exports share in GDP, from 22.2 percent during the 1971-1975 period to 41.2 percent during the 2001-2006 period; while Indonesia showed a small increase from 21.5 percent to 27.6 percent. Although the export share in GDP in China from 2001 to 2006 was only 24.8 percent, it was an impressive increase from the share of only 4 percent during the 1971-1975 period. While trade surplus was recorded in all time periods in Indonesia and Malaysia (except for 1981-1985 and 1991-1995 periods), a trade surplus has occurred in Thailand since the 1996-2000 period, and in China since the 1991-1995 period. Philippines, on the other hand, incurred a trade defi cit in all time periods (see Table 2).
Table 1: Annual average share of exports and imports in GDP in NIEs
Hong Kong Singapore Taiwan Korea
IM/GDP EX/GDP IM/GDP EX/GDP IM/GDP EX/GDP IM/GDP EX/GDP
1971-75 80.3 86.1 n.a n.a n.a n.a 31.0 23.3
1976-80 83.6 87.4 161.9 136.6 n.a n.a 33.8 29.5 1981-85 93.7 97.6 157.7 134.7 37.8 47.7 34.9 33.2 1986-90 114.3 124.1 148.8 145.6 33.2 45.3 29.8 33.8 1991-95 133.8 137.0 140.4 141.0 34.4 38.6 28.0 27.0 1996-00 131.1 132.2 139.2 153.0 39.6 43.2 33.5 37.3 2001-06 134 141.3 151.8 179.2 45.7 51.7 30.8 32.9
Source: World Development Indicators [2007], International Financial Statistics [2007], Taiwan Statistical Data Book [2008]
Note: IM-Imports EX-Exports
Table 2: Annual average share of exports and imports in GDP in ASEAN-4 and China
Indonesia Thailand Malaysia Philippines China IM/GDP EX/GDP IM/GDP EX/GDP IM/GDP EX/GDP IM/GDP EX/GDP IM/GDP EX/GDP 1971-75 18.5 21.5 21.0 18.5 38.8 40.0 22.8 22.2 4.0 4.0 1976-80 20.6 27.4 26.4 21.4 44.6 51.3 25.9 21.2 7.3 7.1 1981-85 23.7 25.7 26.8 22.4 54.7 51.9 25.7 22.7 11.6 11.4 1986-90 21.8 23.4 33.1 31.3 58.5 66.1 27.8 27.4 16.6 16.2 1991-95 25.2 26.7 43.6 38.3 84.8 83.2 38.1 32.1 21.4 22.9 1996-00 31.1 36.6 47.8 54.2 95.4 109.3 54.4 49.7 18.0 21.2 2001-06 22.5 27.6 52.8 56.6 81.1 98.2 44.2 41.2 22.3 24.8
The trade surplus combined with a massive increase in FDI led to an increasing overall balance especially after the 1997 fi nancial crisis. Except for Indonesia, which had fl uctuating overall balance of payments, the upward trend of the overall balance in other countries has appeared more obvious since 2002 (see Figure 3 and Figure 4).
2.2 Financial development
This successful FDI-based industrial development and export performance resulted in remarkable economic growth rate in East Asia. From 1981 to 1995, the real GDP annual growth rate averaged at 7.6 percent for NIEs and 6 percent for ASEAN-4 (WDI [2008] and Taiwan Statistical Data Book [2008]). Meanwhile, China recorded a 10.3 percent annual GDP growth rate during the same period (WDI [2008]). On the other hand, ASEAN-4’s real GDP per capital growth rates nearly approached those of the NIEs during 1991-1995. On average, ASEAN-4’s real GDP per capita growth rate in 1991-1995 was 4.9 percent, while
-30000 -20000 -10000 0 10000 20000 30000 40000 50000 1986 1987 1988 1989 1990 1991 1992 199 3 1994 1995 1996 1997 1998 1999 2000 2001 200 2 2003 2004 2005 200 6 Year Million US$
Singapore Korea Taiwan
Figure 3: The overall balance of payments of NIEs during 1986-2006
Source: The IMF’s International Financial Statistics [2007], Taiwan Statistical Data Book [2008]
-25000 -20000 -15000 -10000 -5000 0 5000 10000 15000 20000 25000 1986 1987 1988 1989 1990 1991 1992 1993 1994 1995 1996 1997 1998 1999 2000 2001 2002 2003 2004 2005 2006 Year
Indonesia Philippines Malaysia Thailand
Million US$
Figure 4: The overall balance of payments of ASEAN during 1986-2006
NIEs recorded 5.4 percent (WDI [2008] and Taiwan Statistical Data Book [2008]). China, on the other hand, recorded an 11 percent real GDP per capita growth rate in the same period (WDI [2008]).
It seems reasonable to expect that the FDI-driven economic growth set up the foundation for the development of fi nancial markets in East Asian countries, despite the outbreak of the Asian financial crisis which was partly caused by weak financial management in some countries. Yet, with the strong economic foundation established in the pre-crisis period, East Asian financial markets could recover and return to the development track quickly.
According to Ghosh [2006], the banking effi ciency in East Asian countries improved considerably in the period after the 1997 fi nancial crisis. Though data on nonperforming loan ratio are only available for the 2000-2006 period, those data showed the improved effi ciency in banking operations.
Table 3: Bank nonperforming loans to total gross loans (Unit: Percentage)
Korea Singapore Indonesia Malaysia Philippines Thailand China
2000 8.9 3.4 34.4 15.4 24 17.7 22.4 2001 3.4 8 31.9 17.8 27.7 11.5 29.8 2002 2.4 7.7 24 15.8 26.5 16.5 25.6 2003 2.6 6.7 19.4 13.9 26.1 13.5 20.1 2004 1.9 5 14.2 11.8 24.7 11.8 15.6 2005 1.2 3.8 15.6 9.9 20 11.1 10.5 2006 1 3 13 8 8 8 9.8
Source: World Development Indicators [2007]
As shown in Table 3, the nonperforming loans to total gross loans ratio decreased in all East Asian countries during the 2000-2006 period. Among those countries, Korea had the lowest nonperforming loans ratio of 1 percent in 2006; while Indonesia recorded the highest nonperforming loans ratio of 13 percent, down from 34.4 percent in 2000. On the other hand, operations of central banks in East Asian countries could be comparable to those in industrialized countries. Central bank operations in those countries reflect a common long-term trend toward greater transparency and a stronger market orientation in policy implementation (Borio and McCauley[2002]).
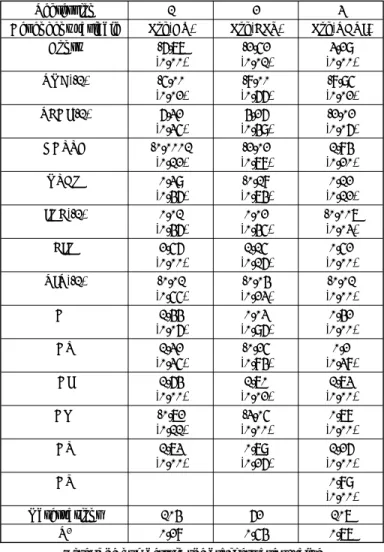
As another indicator of fi nancial development, equity markets in Asian countries, as measured by stock market capitalization, grew signifi cantly during the 1997-2006 period. In the region as a whole, the market almost tripled from 1997 to 2006 (Ghosh [2006]). As indicated in Table 4, the ratio of market capitalization of listed companies over GDP
surged in all six countries between 1997 and 2006. While stock markets in the region were still considerably smaller than in the United States, United Kingdom, or Germany, in relation to the size of domestic economies, they compared favorably to the markets of advanced industrial countries. Indeed, stock market capitalization as a percentage of GDP in 2006 was actually larger in Singapore than Japan, Germany, the United Kingdom and the United States (see Table 4).
Table 4: Market capitalization of listed companies/GDP
Country 1997 2006 Korea 9 94 Singapore 111 202 Indonesia 13 38 Malaysia 93 150 Philippines 38 58 Thailand 16 68 Japan 52 108 Germany 38 56 United Kingdom 149 158 United States 137 148
Source: World Development Indicators [2007]
Starting from a much smaller base, bond markets grew even more rapidly over the 1997-2006 period. As can be seen from Table 5, the ratio of domestic bonds outstanding over GDP increased remarkably from 1997 to 2004. The size of bond markets over GDP in some Asian countries was comparable to (or even higher than) more advanced countries. For example, in 2004, the ratio of domestic bonds outstanding over GDP in Germany and the United Kingdom was lower than that in Malaysia and Korea (see Table 5).
Table 5: Size of bond markets (Domestic bonds outstanding)
1997 2004
Economy/Region US$ billions %GDP US$ billions %GDP
Indonesia 4.5 1.9 57.7 22.7 Korea 130.3 25.1 568.3 83.2 Malaysia 57 57 106.6 90 Philippines 18.5 22.3 25 28.8 Thailand 10.7 7.1 66.5 41.1 Singapore 23.7 24.7 78.6 73.1 Japan 4,433.60 97.6 8,866.70 197.7 Germany 1,739.70 44.5 2225.7 81.2 United Kingdom 777.7 23.5 1,040.80 48.8 United States 12,656.90 62.9 19,186.60 161.6 Source: Ghosh [2006]
2.3 Exchange rate policy
Along with the increase in FDI flows and the resulting economic development, exchange rates in East Asian countries showed some notable movements.
First, except for China, Hong Kong and Malaysia, East Asian countries seemed to adopt more fl exible exchange rate regimes after the 1997 Asian fi nancial crisis. According to the de facto classification of exchange rate regimes by Reinhart and Rogoff [2002], Thailand adopted a managed fl oating exchange rate regime in January 1998, in which the value of the baht was determined by market forces and the Bank of Thailand would intervene in the market only when necessary to avoid excessive volatilities. The Philippines and Singapore adopted a managed floating system in December 1997 and December 1998, respectively; while South Korea and Indonesia moved to freely fl oating exchange rate systems in July 1998 and April 1999, respectively. Malaysia was an exception as it turned to the fi xed exchange rate system in September 1998.
As another proof of the move to more flexible exchange rate systems in East Asian countries, the IMF’s de facto classifi cation of exchange rate regimes from 2003 to 2006 put Thailand and Singapore in the category of a managed floating system with no pre-determined path for the exchange rate; and Philippines and South Korea in the category of an independently fl oating system. Moreover, Indonesia was put into a managed fl oating system during the 2003-2005 period, but was classified as an independently floating system in 2006. In addition, Malaysia was put into fi xed pegged arrangements during the 2003-2005 period but was classifi ed as a managed fl oating system in 2006 (see Table 6).
Table 6: De facto classifi cation of exchange rate regimes
Country R&R [2002] IMF [2003] IMF [2004] IMF [2005] IMF [2006]
South Korea IF IF IF IF IF Singapore MF MF MF MF MF Hong Kong CB CB CB CB CB Thailand MF MF MF MF MF Philippines MF IF IF IF IF Indonesia IF MF MF MF IF Malaysia FP FP FP FP MF China FP FP FP FP FP
Notes:-R&R [2002]: the de facto classification of exchange rate regimes by Reinhart and Rogoff [2002]
-CB: currency board arrangement
-MF: Managed fl oating with no pre-determined path for the exchange rate -IF: Independently fl oating
-FP: Fixed peg arrangement
-Information on the classifi cation of exchange rate system in Taiwan is not available. Source: Reinhart and Rogoff [2002] and IMF’s Classification of Exchange Rate Arrangements and Monetary Policy Frameworks
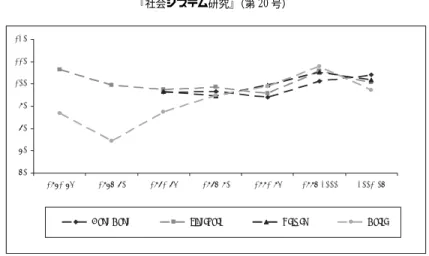
On the other hand, more information can be revealed by observing the real exchange rate index of East Asian countries. While the trend in exchange rate movements may differ between NIEs and ASEAN-4 countries during the pre-crisis period, it seems that local currencies of both NIEs and ASEAN-4 countries appreciated against the US dollar in the post-crisis period, except for the case of Hong Kong and China (see Figure 5 and Figure 6).
From the analysis in the above sections, it is likely that exchange rate movements in East Asia derived from the underlying economic development, which was led by FDI inflows in those countries. First, the surplus overall balance resulted from tremendous export performances and FDI inflows in East Asian countries created a pressure for appreciating local currencies. As indicated in Figure 1, Figure 2, Figure 3 and Figure 4,
60 70 80 90 100 110 120 1971-75 1976-80 1981-85 1986-90 1991-95 1996-2000 2001-06
Hong Kong Singap ore Taiwan Korea
Figure 5: Real exchange rate index (1985 = 100)
Source: World Development Indicators [2007] and calculation by author
80 90 100 110 120 130 1971-75 1976-80 1981-85 1986-90 1991-95 1996-2000 2001-06
Indonesia Thailand M alay sia Philippines China
Figure 6: Real exchange rate index (1985 = 100)
the FDI inflows and the overall balance surplus increased tremendously in East Asian countries since 2001-2002. Hence, we can observe the local currency appreciation against the US dollar in most countries in the post-crisis period.
Second, as discussed in section 2.1, FDI inflows played a key role in upgrading the industrial production in East Asian countries to higher value chains. As industrial exports become more sophisticated and contain more added value, a more fl exible exchange rate is unlikely to harm export competitiveness. In other words, the dependence of export competitiveness on exchange rate is likely to be lower when exports are highly value-added, such as microchips, than when they are simple, labor-intensive products, such as apparel.
Third, it seems that as long as the domestic production is less reliant on imported intermediate and capital inputs, maintenance of a fl exible exchange rate system is more feasible. Indeed, the fixed exchange rate system seems necessary when domestic production depends heavily on imported inputs, since the depreciation of local currency increases import cost and may harm the export sector.
Fourth, FDI-led economic development also facilitated the maintenance of more flexible exchange rate regimes. As discussed in section 2.2, East Asian economic development was associated with the development of the financial system. As the soundness of the banking system is improved, commercial banks are better prepared to cope with the shocks created by exchange rate fl uctuations (e.g, by hedging activities). On the other hand, the increased capacity of central banks and the development of capital markets which approached the standard of more advanced countries show that East Asia have established the financial infrastructure necessary for maintaining more flexible exchange rate systems.
Finally, since East Asian economies have been driven by, and to some extent, depend heavily on foreign investment, those economies are more likely to experience fl uctuations when foreign investment fl ows are unstable; or when there are changes in the economic structure caused by foreign investors. As the economy may be faced with more instability associated with FDI inflows, it seems more difficult to maintain a fixed exchange rate system.
3. Theoretical considerations
fl oating exchange rates. The debate has focused on the advantages and disadvantages of both the fixed and floating exchange rate system, indicating the possibility of adopting intermediate regimes. Recently, the debates on exchange rate regimes have become focused on whether or not exchange rate regimes are moving to a corner solution with the “hard peg” or the “free fl oat”. The corner solution has often been explained by the principle of the Impossible Trinity, that is, a country has to give up one of three goals: exchange rate stability, monetary independence, and fi nancial market integration (Taguchi [2007]). As capital market integration increases, countries would be forced increasingly to more pure fl oating or more purely fi xed regimes. On the other hand, the “Fear of fl oating” hypothesis is a counter-argument against the “corner solution” hypothesis. According to recent studies, few developing countries that claim to be implementing a fl oating exchange rate policy, do in fact allow their exchange rate to fl oat (Calvo and Reinhart [2000a and 2000b]). “Fear of floating” is explained largely by the fact that exchange rate volatility is more damaging to trade, and the pass-through from exchange rate swings to inflation is far higher in developing countries (Calvo and Reinhart [2000b]). Fear of appreciating because of short-term capital infl ows and losing competitiveness is also a factor for not letting the exchange rate fl oat freely (Yagci [2001]).
A large number of studies have researched on the determinants of the choice of exchange rate regime. The standard classical theory of choosing an exchange rate regime is the theory of optimum currency area (OCA theory) pioneered by Mundell [1961]. Notable followers, who further developed Mundell’s ideas, are Fleming [1962] and McKinnon [1963]. An optimum currency area is defined as a geographical area in which member countries should use absolutely fi xed exchange rates among themselves or, equivalently, have a common currency. Mundell and his followers have stipulated several criteria to assess whether a country should belong to an optimal currency area, such as the degree of labor mobility, the degree of openness and the size of the economy.
More recently, a large theoretical literature has examined the optimal choice of exchange rate regime so as to stabilize macroeconomic performance in a world with different types of shocks. The basic conclusion of these studies is that the optimal choice of regime depends on the nature and size of these shocks, as well as on the structure of the economy (e.g., see Flood [1979], Frenkel and Aizenman [1981]). These analyses tend to imply that countries which experience large foreign price shocks should choose flexible exchange rates, while domestic monetary and demand shocks should be financed out of reserves, with no need for exchange rate adjustment.
In addition to the above-mentioned theories, political economy theory emphasizes political factors such as political stability and the government’s temptation to infl ate as important criteria influencing the choice of exchange rate regime (e.g. Collins [1996], Edwards [1996]). The theories show that a country lacking political stability has an incentive ceteris paribus to let its exchange rate fl oat as it lacks the political ability and political support for the unpopular measures that may be required to defend a peg. Also, under a fl oating regime, exchange rate adjustments are less highly visible to the public and consequently less politically costly than devaluation under a peg (Collins [1996]). Finally, a government with an “ambitious” unemployment objective has a high temptation to infl ate, and thus ceteris paribus a high incentive to “tie its own hands” by pegging the exchange rate (Edwards [1996]).
Taking into account various theories on exchange rate regime, we now determine the position of this paper in the literature. First, we follow the “Fear of fl oating” hypothesis, because of the fact that most East Asian countries moved to managed floating system, instead of pure fl oating one. The shifts to intermediate regimes seem reasonable, given the disadvantages of both corner solutions. Though the main advantages of the floating regimes are their invulnerability to currency crisis, and their ability to absorb adverse shocks and pursue an independent monetary policy, these advantages come with the cost of high short-term exchange rate volatility and large medium-term swings characterized by misalignment. At the other end of the spectrum, the hard peg regimes provide maximum stability and credibility for monetary policy, and low transaction costs and interest rates, but suffer from the loss of lender of last resort of the central bank and seigniorage revenue.
Two big advantages of the intermediate regimes are that they maintain stability and reduce transaction costs and the exchange rate risk while providing a nominal anchor for monetary policy. As argued by Yagci [2001]), by giving up some nominal stability for greater fl exibility, the intermediate regimes aim to get the best of both worlds: to provide limited nominal anchor for inflationary expectations, but also avoid volatility and overvaluation, and reduce the risk of currency crisis by restoring two-way bet for speculators with broad soft bands.
Second, we then focus on examining the determinants of exchange rate fl exibility in East Asian countries. Our specifi c concern is whether FDI and the FDI-led, export-oriented industrialization had any effects on the local currency appreciation against the US dollar; as well as on the exchange rate fl exibility in the East Asia region.
4. The regression model
This section attempts to check the determinants of exchange rate arrangements in some East Asian countries. We use data from 1986 to 2006, and run the regression for seven countries in the region, including South Korea, Singapore, Indonesia, Malaysia, the Philippines, Thailand and Taiwan 1).
Most empirical studies used economic fundamentals as determinants of exchange rate regimes. Table 7 summarizes the determinant variables of exchange rate regimes used in previous studies. As can be observed from Table 7, besides the traditional economic determinants, other types of explanatory variables, which are political variables and financial development, were examined in some empirical studies (see, for example, Edwards [1996], Frieden, Ghezzi and Stein [2000], Poirson [2001], and Hossain [2009] with the inclusion of political variables, and Hagen and Zhou [2002] with the examination of fi nancial development as an explanatory variable). However, no studies have included FDI as an explanatory variable.
Table 7: Explanatory variables used in previous studies
No Variables Proxies Regression studies
1 Scale of the economy
GNP, GDP, GDP per capita, GDP growth rate Heller [1978], Holden, Holden and Suss [1979], Melvin [1985], Collins[1996], Edwards [1996], Rizzo [1998], Poirson [2001], Hagen and Zhou [2002], Hossain [2009]
2 Openness Imports/GNP, Exports plus Imports / GDP Heller [1978], Holden, Holden and Suss [1979], Melvin [1985], Collins[1996], Rizzo [1998], Frieden, Ghezzi and Stein [2000],
Poirson [2001], Hagen and Zhou [2002], Duttagupta and Otker-Robe [2003], Hossain [2009] 3 Liberalized trade Assign a value of 1 to cases where the average tariff
was lower than 20%
Frieden, Ghezzi and Stein [2000]
4 Terms of trade Collins[1996], Rizzo [1998]
5 Export performance
Annual growth in export revenue Duttagupta and Otker-Robe [2003]
6 Geographical concentration of foreign trade
The fraction of total trade accounted for by the dominant trading partners
Heller [1978], Holden, Holden and Suss [1979], Melvin [1985], Rizzo [1998], Poirson [2001], Hagen and Zhou [2002] 7 Commodity
concentration of foreign trade
Share of main exports in total exports Holden, Holden and Suss [1979], Poirson [2001], Hagen and Zhou [2002]
8 Infl ation, Infl ation differential
Infl ation rate; The difference between a country’s infl ation and the weighted average infl ation of its trading partners (or the average infl ation rate for the world as a whole)
Heller [1978], Holden, Holden and Suss [1979], Melvin [1985], Collins [1996], Rizzo [1998], Frieden, Ghezzi and Stein [2000], Poirson [2001],Hagen and Zhou [2002]
9 Capital mobility Annual gross private capital fl ows to GDP; dummies that indicates the existence (or levels) of restrictions on capital account transactions
Holden, Holden and Suss [1979], Frieden, Ghezzi and Stein [2000], Poirson [2001], Hossain [2009]
10 Foreign price shocks
The standard errors of residuals from regressions of the exchange rate-adjusted infl ation rates of the country’s major trading partner
Melvin [1985]
11 Domestic shocks The standard errors of second-order autoregressive equations on the percentage change in money; dummies for balance of payments crises, banking crises, recessions, high infl ation periods and hyperinfl ation
Melvin [1985], Hossain [2009]
12 External shocks The lagged value of the coeffi cient of variation of real export growth; the coeffi cient of variation of real bilateral exchange rate changes; the interactive term between external variability and the degree of openness, where the degree of openness was defi ned as the ratio of imports plus exports to GNP; the coeffi cient of variation of the terms of trade.
Edwards [1996], Frieden, Ghezzi and Stein [2000]
13 Vulnerability to external shocks
Ratio of international debt securities issued in own currency to total issued in all currencies; ratio of bank debt in own currency to total bank debt in all currencies; ratio of total foreign securities issued in the country’s currency to total foreign securities issued by the country
Poirson [2001]
14 Risk of currency crisis
Non-gold international reserves/broad money; government fi scal budget balance/GDP
Hagen and Zhou [2002] 15 Volatility of
exchange rate
Volatility of real exchange rate changes; the deviation of the real effective exchange rate (REER) from its trend
Hagen and Zhou [2002], Duttagupta and Otker-Robe [2003]
16 Probability of abandoning the peg
Historical rate of infl ation; the yearly lagged ratio of international reserves to high powered money; rate of growth of domestic credit; index of capital control
Edwards [1996]
17 Exchange rate misalignment
Current account balance/GDP Collins[1996], Rizzo [1998] 18 Reserves Foreign currency reserves/GDP, Central bank reserves/
M2, Reserves/ Imports
Rizzo [1998], Frieden, Ghezzi and Stein [2000], Poirson [2001], Duttagupta and Otker-Robe [2003]
19 Dollarization Foreign currency deposits/broad money Poirson [2001] 20 Expansionary
monetary policy
Credit to the private sector or total domestic credit in percentage of GDP, growth of base money in percentage of GDP
Duttagupta and Otker-Robe [2003]
21 Fiscal vulnerability
Government revenue/GDP, government expenditure/ GDP, government defi cit/GDP, annual growth of government borrowings from the banking system
Rizzo [1998], Duttagupta and Otker-Robe [2003]
22 Financial sector development
Broad money/GDP, Foreign assets of the banking system/Money supply
Heller [1978], Hagen and Zhou [2002], Hossain [2009] 23 Dummy variable
for an IMF program
to see whether the shift to an alternative type of exchange rate regime is related to “IMF advice” under an economic program
Duttagupta and Otker-Robe [2003], Hossain [2009]
24 Interest group variable
Share of each sector in the country’s GDP Frieden, Ghezzi and Stein [2000]
25 Institutional variable
Degree of central bank independence Frieden, Ghezzi and Stein [2000]
26 Political variables
Frequency of government change; changes in the political leadership from the governing party to an opposition party; the share of government seats in the legislature; the effective number of parties in the legislature; number of revolutions
Edwards [1996], Frieden, Ghezzi and Stein [2000], Poirson [2001], Hossain [2009]
27 Spell duration Spell is defi ned as a time when there is a particular fi xed value of a country’s currency with respect to the US dollar. The authors set the condition that the fi xed exchange rate must last for at least three months to constitute a spell. Exits to less fl exible regimes are associated with relatively long spell duration (compared with other exits)
Duttagupta and Otker-Robe [2003]
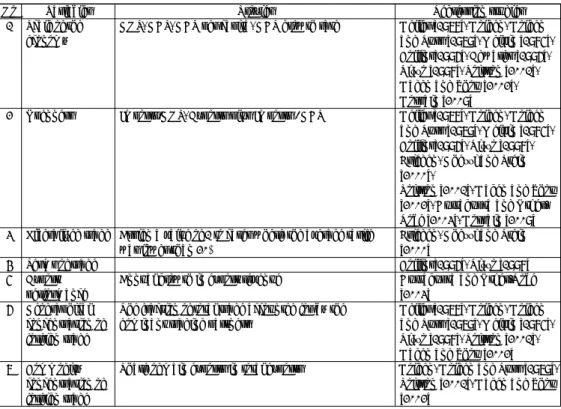
In this paper, we examine the determinants of exchange rate arrangements in East Asia during the 1986-2006 period. Since FDI-led economic development seems to be the common feature of East Asian economies, we examine the effect of this common feature on exchange rate regimes of those countries. As analyzed in section 2, the FDI infl ow and the FDI-led, export-oriented industrialization can have effects on exchange rate regimes. Although we cannot quantify and include all FDI-related factors in the regression (such as the higher value-added industrial production in East Asian countries), we try to examine the effects of the FDI inflow itself, the overall balance, and financial development on exchange rates. In addition, other common explanatory variables of exchange rate movements are also included. As a result, the independent variables include the real overall balance (in 1985 US$) (ROB), real FDI infl ow (in 1985 US$) (FDI), real GDP per capita (in 2000 US$) (GDPPC), openness of the economy ((Export+Import)/GDP as the proxy) (OPEN), inflation rate (INF), financial development (proxied by the ratio of M2/ GDP) (FIN), and real interest rate (RIR). Besides, dummy variables for each country are also added.
As for the dependent variable, most studies of the determinants of exchange rate regimes use the de jure classifi cation of exchange rate regimes in the IMF Annual Report on Exchange Arrangements and Exchange Restrictions to create their dependent variable. However, the de jure classification of a regime by the IMF is problematic as many countries offi cially declare one regime (de jure) but in practice maintain another regime (de facto). In addition, the de facto classification made by the IMF has only been available since 2003. Therefore, instead of using the classifi cation by the IMF, we try to quantify the dependent variable.
The exchange rate fl exibility was quantifi ed in two recent papers by Taguchi [2007] and Poirson [2001]. Taguchi [2007] calculates the coefficient of variation (CV) in the monthly nominal exchange rates of the sample countries year by year 2). CV is useful for
comparing data sets with widely different means since it is a dimensionless number. However, CV is merely a mathematical measure of exchange rate fl exibility which does not reflect the level of intervention by the central banks. A small value of CV does not tell whether the exchange rate stability is the result of interventions by the central bank, or just the result of macroeconomic stability without any exchange rate intervention. Therefore, besides CV, we also use another way to quantify the dependent variable. Following the approach of Poirson [2001], we measure the degree of de facto exchange rate fl exibility (FLT) by the ratio of the average absolute value of monthly nominal exchange rate depreciation (ME) to the average absolute value of the monthly change in reserves normalized by the monetary base in the previous month (MR), in order to proxy for the monetary impact of these changes. The rationale for using FLT as an indicator of de facto exchange rate flexibility is that if MR is high relative to ME (and therefore FLT is comparatively small) the monetary authorities are intervening relatively heavily on the foreign exchange market to offset market forces. FLT assumes values ranging from zero to infi nity, with the limits being defi ned by a perfectly pegged policy at the one end (ME = 0) and a completely intervention-free policy at the other (MR = 0).
Finally, we also check the factors that determine the real exchange rate index (RERI). We calculate the real exchange rate index (with the value of the real exchange rate in 1985 equals 100) and use it as the dependent variable.
In the fi rst two regressions, only six countries are included since we lack the monthly data of exchange rate (which are necessary to calculate CV and FLT) for Taiwan. In the third regression, Taiwan is included. Therefore, in the first two regressions, dummy variables for countries include DK, DS, DI, DM, DP, which represent Korea, Singapore, Indonesia, Malaysia, and Philippines, respectively. In the final regression, the dummy variable for Thailand (DT) is added.
Data used in the regression are collected and calculated from the International Financial Statistics [2008], Taiwan Statistical Data Book [2008] and the World Development Indicators 2007 CD-ROM.
From the discussion in section 2, the expected signs of the coeffi cients of the three key explanatory variables are as follows: ROB and RFDI are expected to have negative relation with log(RERI), which means the overall balance and FDI would lead to the
appreciation of the local currency against the US dollar; while RFDI and FIN are expected to be positively related to both log(CV) and log(FLT), which implies the positive effects of FDI and fi nancial development on exchange rate fl exibility.
The results of the three regressions are presented in Table 8.
Table 8: Regression results
Regression 1 2 3
Dependent variable Log(CV) Log(FLT) Log(RERI)
Const -6.77 (0.00) -2.52 (0.01) 3.29 (0.00) ROB(-1) -5.00 (0.02) -8.00 (0.66) -8.95 (0.02) RFDI(-1) 6.32 (0.35) 4.26 (0.49) -2.02 (0.06) GDPPC -0.0001 (0.12) -2.02 (0.78) 1.84 (0.20) OPEN 0.39 (0.46) -0.18 (0.74) 0.12 (0.12) INF(-1) 0.01 (0.46) 0.02 (0.45) -0.007 (0.03) FIN 2.56 (0.00) 1.15 (0.16) 0.52 (0.00) RIR(-1) -0.01 (0.55) -0.04 (0.23) -0.01 (0.00) DK 1.44 (0.06) 0.03 (0.96) 0.42 (0.00) DS 1.32 (0.35) -0.25 (0.84) 0.2 (0.38) DI 1.64 (0.00) 1.70 (0.02) 1.73 (0.00) DM -0.72 (0.11) -3.05 (0.00) 0.78 (0.00) DP 1.73 (0.00) 0.79 (0.26) 1.26 (0.00) DT 0.89 (0.00) Observations 104 62 107 R2 0.28 0.54 0.77
Note: The numbers in the brackets are p-value
As can be observed from Table 8, the R-squared in the fi rst and second regressions are relatively small. In the first regression, we use CV as the dependent variable. The disadvantage of using CV as mentioned above is probably the reason why R-squared in the fi rst regression is rather low.
better indicator of exchange rate intervention than CV. However, the number of observations in the second regression (only 62 observations) is low since we do not have full data of the monthly monetary base necessary to calculate FLT in some countries like Indonesia, Malaysia and Thailand. Our R-squared is therefore only 0.54, though higher than the R-squared of the fi rst regression.
On the other hand, all the key variables have the expected signs. The effect of the real overall balance on real exchange rate index is statistically significant and negative, suggesting that the higher overall balance, the higher the value of local currency. The FDI inflow has the same effect on the real exchange rate index, and the coefficient is also statistically signifi cant. On the other hand, both FDI and fi nancial development matter for the choice of exchange rate regime: countries that receive more FDI infl ows and countries that have more developed financial system tend to adopt more flexible exchange rate systems. The coefficients are positive for both indexes of exchange rate flexibility, and statistically signifi cant for the fi nancial development variable. However, the coeffi cients are not statistically signifi cant for the FDI variable, probably because the lag of one year is not enough to show clearly the effects of FDI on exchange rate fl exibility. It may take more time before the infl uence of FDI to changes in industrial production, the trade structure, and fi nally to exchange rate fl exibility, become obvious.
As for the dummy variables, the coeffi cients are statistically signifi cant in at least two regressions in all countries, except for Singapore. The regression result for Singapore is not unexpected, however, since Singapore’s economy is not dominated by export-oriented manufacturing. In fact, FDI is larger in services in Singapore than in manufacturing. The manufacturing sector’s share declined during the 1990s from 41.4 percent in 1990 to 36.5 percent in 2001 (Yue [2006]). Meanwhile, the service sector, including financial and business services, commerce, transport and storage services increasingly lured foreign investment, even from regional investors. According to Yue [2006], 68 percent of Japanese FDI and more than 90 percent of FDI from ASEAN countries were in Singapore’s nonmanufacturing sector. With its small scale and service-oriented economic development, Singapore (and perhaps Hong Kong) may not entirely fit into our FDI-based, export-oriented manufacturing model of development, and therefore, Singapore’s exchange rate arrangement may have to be explained by other factors not included in our regression analysis.
On the other hand, the coefficients for Malaysia are negative in the first two regressions, which mean that other things equal, FDI and fi nancial development have less
effect on exchange rate flexibility. As for Malaysia, the heavy dependence on imported inputs due to fragile links between local producers and foreign partners may be one reason underlying the infl exibility of the exchange rate system. In addition, during the post-crisis period, many large, state-nurtured and state-supported Malaysian entrepreneurs failed due to lack of accountability, transparency and appropriate corporate governance (Ling [2006]). Given the fact that those state corporations were the major local partners of foreign investors, local links did not seem to improve even in the post-crisis period.
For other countries, at least one coeffi cient in the fi rst two regressions is statistically signifi cant, and both coeffi cients in the fi rst two regressions are positive. Therefore, to our knowledge and currently available information, we may argue that most East Asian countries fi t into our model of industrialization-based exchange rate arrangements. While we acknowledge that there can be other models explaining exchange rate arrangements in East Asian countries; and other variables should be included in later studies to examine more sophisticated effects of FDI-led economic development on exchange rates, our analysis and empirical studies have at least pointed out a reasonable explanation for exchange rate arrangements in East Asia.
5. Concluding remarks
The discussions in previous sections show that as FDI infl ows increased and export-oriented industrialization process was realized, most East Asian countries shifted to more fl exible exchange rate regimes. Our regression results confi rm the positive effect of FDI on exchange rate fl exibility and currency appreciation.
As Vietnam has been following the development path of East Asian countries, especially in terms of regional FDI attraction and the FDI-based, export-oriented industrialization, our analysis and regression results can be used to predict the future exchange rate arrangement in Vietnam. There maybe two scenarios for Vietnam’s exchange rate policy. In the fi rst scenario, if Vietnam accelerates its FDI-based, export-oriented industrialization, then the Vietnamese Dong (VND) is likely to appreciate and the exchange rate management system is likely to become more flexible. In the second scenario, if Vietnam fails to realize the export-oriented industrialization and returns to the previous phase of development (in which the huge trade deficit remains and must be financed by foreign capital inflows), then it is expected that the VND will gradually depreciate, and the current exchange rate management will have to be maintained.
From the lessons of East Asian countries, the future exchange rate arrangement in Vietnam will depend a great deal on the result of the FDI attraction policy and the industrialization process, among other possible factors. In other words, the level of future exchange rate fl exibility depends on the economic development prospects of Vietnam.
Notes
1 )Full data on Hong Kong are not available so we exclude Hong Kong in our regression analysis. Also, we do not include China in our regression due to its large-scale and recent development compared to NIEs and ASEAN-4 countries.
2 )The coefficient of variation (CV) is a normalized measure of dispersion of a probability distribution and is defi ned as the ratio of the standard deviation σ to the mean μ .
References
IFS online database [2007, 2008] Taiwan Statistical Data Book [2008]
United Nations Conference on Trade and Development (UNCTAD) database [2007] World Development Indicators [2007, 2008]
Borio, C.E.V. and Robert N. McCauley [2002], Comparing monetary policy operating procedures in Indonesia, Korea, Malaysia and Thailand, in Gordon de Brouwer (ed.) Financial markets and policies in East Asia, Routledge Studies in the Growth Economies of Asia.
Calvo, G.A. and C.M. Reinhart [2000a], Fear of fl oating, The quarterly Journal of Economics, 117, pp. 379-408.
Calvo, G.A. and C.M. Reinhart [2000b], Fixing for your life, NBER Working paper 8006. Collins, Susan M. [1996], “On Becoming More Flexible: Exchange Rate Regimes in Latin
America and the Caribbean,” Journal of Development Economics, Vol. 51, pp. 117-38.
Duttagupta, Rupa, and I.nci Ötker-Robe [2003], Exits from Pegged Regimes: An Empirical
Analysis, IMF Working Paper 03/147 (Washington: International Monetary Fund).
Edwards, Sebastian [1996], The determinants of the choice between fi xed and fl exible exchange-rate regimes, NBER Working Paper Series.
Fleming, J.M. [1962], Domestic fi nancial policies under fi xed and under fl exible exchange rates, International Monetary Fund Staff Papers, 9: 369-380.
Flood, Robert P. [1979], Capital mobility and the choice of exchange rate system, International Economic Review, Vol. 20, No. 2.
exchange rates, National Bureau of Economic Research.
Frieden, Jeffry, Piero Ghezzi, and Ernesto Stein [2000], Politics and Exchange Rates in Latin America, Research Network Working Paper R-421 (Washington: Inter-American Development Bank).
Ghosh, Swati R., [2006], East Asian fi nance: The road to robust markets, The World Bank. Hagen, Jurgen von, and Jizhong Zhou [2002], The choice of exchange rate regimes: An empirical
analysis for transition economies, Center for European Integration Studies.
Heller, H. Robert [1978], Determinants of exchange rate practices, Journal of Money, Credit and Banking, Vol. 10, pp. 308-21
Holden, Paul, Merle Holden, and Esther C. Suss [1979], The determinants of exchange rate fl exibility: an empirical investigation, The Review of Economics and Statistics, Vol. 61, No. 3, pp. 327-33.
Hossain, Monzur [2009], Institutional development and the choice of exchange rate regime: A cross-country analysis, Journal of the Japanese and International Economies.
Husain, Aasim, Ashoka Mody, and Kenneth Rogoff [2004], Exchange rate regime durability and performance in developing versus advanced economies (IMF and Havard University). Ito, Takatoshi [2001], Growth, crisis, and the future of economic recovery in East Asia, in Joseph
E. Stiglitz and Shahid Yusuf (eds.) Rethinking the East Asian Miracle, World Bank, pp. 55-91.
Ling, Sieh Lee Mei [2006], FDI infl ows and economic development: The postcrisis experience of Malaysia, in Urata, Shujiro, Chia Siow Yue and Fukunari Kimura (eds.), Multinationals and economic growth in East Asia: Foreign direct investment, corporate strategies and national economic development, Routledge International Business in Asia series.
McKinnon, Ronald I. [1963], Optimum Currency Areas, American Economic Review, Vol. 53, pp. 717-25.
Melvin, Michael [1985], The choice of an exchange rate system and macroeconomic stability, Journal of Money, Credit and Banking, Vol. 17, No. 4, pp. 467-78.
Mundell, Robert A. [1961], A theory of optimum currency areas, American Economic Review, Vol. 51, pp. 657-65.
Nguyen, Kim Thu, and Junichi Hirata [2009], Foreign Direct Investment and the Export-Oriented Industrialization in Vietnam, The Ritsumeikan Economic Review, Vol.57, No 5.6, pp.1-18
Poirson, Helene [2001], How do countries choose their exchange rate regime?, International Monetary Fund.
Ravenhill, John [1995] (ed.), The political economy of East Asian: Singapore, Indonesia, Malaysia, The Philippines and Thailand, Edward Elgar Publishing Limited, UK.
Reinhart, C.M. and K.S. Rogoff [2002], The modern history of exchange rate arrangements: a reinterpretation, NBER Working Paper 8963.
Rizzo, Jean-Marc [1998], “The Economic Determinants of the Choice of an Exchange Rate Regime: A Probit Analysis,” Economics Letters, Vol. 59, No. 3, pp. 283-87.
Rogoff, Kenneth, Aasim Husain, Ashoka Mody, Robin Brooks, and Nienke Oomes [2003], Evolution and performance of exchange rate regimes, IMF working paper 03/243 (Washington: International Monetary Fund).
Taguchi, Hiroyuki [2007], The post-crisis exchange rate management in selected East Asian countries, The Journal of Developing Areas, Vol. 40, Iss.2.
Yue, Chia Siow [2006], Inward FDI in Singapore: Policy framework and economic impact, in Urata, Shujiro, Chia Siow Yue and Fukunari Kimura (eds.), Multinationals and economic growth in East Asia: Foreign direct investment, corporate strategies and national economic development, Routledge International Business in Asia series.
Yagci, Fahrettin [2001], Choice of exchange rate regimes for developing countries, Paper prepared for a workshop sponsored by the National Economic Consultative Forum to discuss the exchange rate issues in Zimbabwe in April 2001 in Harare.
![Figure 2: Foreign direct investment fl ows in NIEs and China Source: UNCTAD [2007]](https://thumb-ap.123doks.com/thumbv2/123deta/6653568.1143028/4.774.156.610.117.581/figure-foreign-direct-investment-nies-china-source-unctad.webp)

![Figure 4: The overall balance of payments of ASEAN during 1986-2006 Source: The IMF’s International Financial Statistics [2007]](https://thumb-ap.123doks.com/thumbv2/123deta/6653568.1143028/6.774.177.599.488.714/figure-overall-balance-payments-source-international-financial-statistics.webp)