Title
Structure-function Relationship of the β-hairpin Loop in the
N-terminal Domain and the Zinc-binding Motif of
Thermolysin( Dissertation_全文 )
Author(s)
Menach Evans Pkemoi
Citation
Kyoto University (京都大学)
Issue Date
2014-03-24
URL
http://dx.doi.org/10.14989/doctor.k18316
Right
Type
Thesis or Dissertation
Textversion
ETD
Structure-function Relationship of the β-hairpin Loop
in the N-terminal Domain and the Zinc-binding Motif
of Thermolysin
MENACH EVANS PKEMOI
Contents
Introduction 1
Chapter 1 5
Effects of Site-directed Mutagenesis of the Loop Residue of the N-terminal Domain Gly117 of Thermolysin on Its Catalytic Activity Chapter 2 23
Effects of Site-directed Mutagenesis of Asn116 in the β-Hairpin of the N-terminal Domain of Thermolysin on Its Activity and Stability Chapter 3 41
Effects of Mutations of Thermolysin, Asn116 to Asp and Asp150 to Glu, on Salt-induced Activation and Stabilization Chapter 4 57
Effects of Conversion of the Zinc-binding Motif Sequence of Thermolysin, HEXXH, to That of Dipeptidyl Peptidase III, HEXXXH, on the Activity and Stability of Thermolysin Summary 73
References 77
Acknowledgments 87
Abbreviations
CD circular dichroism
DPP III dipeptidyl peptidase III
FAGLA N-[3-(2-furyl)acryloyl]-glycyl-L-leucine amide Gly-D-Phe glycyl-D-phenylalanine
HEPES 2-[4-(2-hydroxyethyl)-1-piperazinyl]ethanesulfonic acid
kcat molecular activity
kcat/Km specificity constant
Ke proton dissociation constant
Km Michaelis constant
kobs first-order rate constant for thermal inactivation
MES 2-(N-morpholino)ethanesulfonic acid
npr neutral protease
OD optical density
SDS-PAGE sodium dodecyl sulfate polyacrylamide gel electrophoresis
TLN thermolysin
Tris tris(hydroxymethyl)aminomethane
TAPS N-tris(hydroxymethyl)methyl-3-aminopropanesulfonic acid
UV ultra violet
WT wild-type thermolysin
1
Introduction
Thermolysin (TLN) [EC 3.4.24.27] is a thermostable neutral metalloproteinase that belongs to the gluzincins family of clan MA, subclan MA(E). It was originally identified in the culture broth of Bacillus thermoproteolyticus (1–3). It contains one zinc ion that is essential for catalysis and four calcium ions for structural stability (4–6). It has a molecular mass of 34.6 kDa and comprises 316 amino acid residues whose sequence is known (7–8). The overall structure of TLN consists of two domains, a β-rich N-terminal domain (Ile1-Asp138) and an α-helical C-terminal domain (Asp150-Lys316) (9–11). The domains are connected by an α-helix (Val139-Thr149) located at the bottom of the active site cleft (10). The active site is composed of one zinc ion and five polypeptide regions: N-terminal sheet (Asn112-Trp115), α-helix 1 (Val139-Thr149), C-terminal loop 1 (Asp150-Gly162), α-helix 2 (Ala163-Val176), and C-terminal loop 2 (Gln225-Ser234) (12).
The α-helix 1 located at the bottom of the active site contains the zinc-binding motif sequence His-Glu-x-x-His (HEXXH). This motif sequence is highly conserved in zinc-dependent metalloproteases (zincins), a broad group of proteins involved in many metabolic and regulatory functions, and found in virtually all forms of life (13). Some other mono-zinc proteases have different zinc-binding motifs, for example HEXXXH in dipeptidyl peptidase III (DPP III) (14). Almost all Co(II)- or Mn(II)-substituted enzymes maintain the catalytic activity of their zinc counterparts. Based on structural studies of various metal-substituted enzymes, the metal coordination geometries of both active and inactive Cu(II)-substituted enzymes have been shown to be the same as those of the wild-type Zn(II) enzymes (15). This implies that the enzymatic activity of a metal-ion-substituted zinc metalloprotease may depend on the flexibility of the catalytic domain.
TLN catalyzes primarily the hydrolysis of peptide bonds containing hydrophobic amino acid residues (16, 17). In addition, it catalyzes peptide bond formation through reverse reaction of hydrolysis, a property which has been exploited industrially. The
2
most extensive use is in the synthesis of N-carbobenzoxy-L-aspartyl-L-phenylalanine methyl ester (ZDFM) from N-carbobenzoxy-L-aspartic acid (ZD) and L-phenylalanine methyl ester (FM) (18, 19). ZDFM is a precursor of an artificial sweetener, aspartame, which is 200 times sweeter than sucrose. Because of its economic importance the improvement of its activity and stability are important subjects.
TLN activity increases in an exponential fashion with increasing concentrations of neutral salts (1–5 M) (17, 18, 20–23). The ratios of the specificity constant, kcat/Km, at
4.0 M NaCl to that at 0 M NaCl of WT is 13–15 in the hydrolysis of the neutral substrate N-[3-(2-furyl)acryloyl]-glycyl-L-leucine amide (FAGLA) and 6–7 in the
hydrolysis of the negatively charged substrate ZDFM at pH 7.0 at 25°C (19–22). The degree of activation at x molar NaCl in the hydrolysis of FAGLA at pH 7.5 takes the form 1.9x. Activation is solely due to an increase in kcat; the Km is unaffected during
activation. Activation is highest in the presence of NaCl or NaBr. This has been related to specific interactions between cations and TLN, and the magnitude of activation is in the order Na+ > K+ > Li+. Though the exact mechanism of activation has not been clearly elucidated, the activation order suggests the degrees of hydration coupled with specific electrostatic interactions with TLN residues are involved in the activation mechanism. Interestingly, virtually all highly active TLN variants produced by site-directed mutagenesis generally exhibited drastically diminished degree of NaCl-induced activation.
TLN’s stability increases in the range 0–2 M NaCl (17). The ratio of the first-order rate constant for thermal inactivation (kobs) at 70ºC at 0 M NaCl to that at 1 M
NaCl of TLN is about 3 (17) This stabilizing effect decreases above 2 M NaCl (17). The activation energy, Ea, for thermal inactivation is 15 kcal/mol at 0 M NaCl, and increases
up to 30–33 kcal/mol on the addition of 0.5–1.5 M NaCl. Further increases in sodium chloride concentration decrease the Ea value, and at 4.0 M NaCl Ea is almost the same
as that at 0 M NaCl. The stability dependence on NaCl concentration is different from that of activity, suggesting that the effects of NaCl on activity and stability are independent. TLN has been demonstrated to be not only a thermophilic enzyme but also a highly halophilic one.
3
The general objective of this study was to examine the structure-function relationship of the β-hairpin loop in the N-terminal domain and the zinc-binding motif of TLN. Specifically, the desire was to generate TLN variants with (i) altered substrate specificity, (ii) enhanced activity and/or stability, (iii) altered catalytic metal-ion preference, and (iv) to explore the relation between activity enhancements induced by NaCl versus that caused by mutation, especially where the activity-enhancing mutation simultaneously affects NaCl-induced activation. In Chapters 1 and 2, the roles of Asn116 and Gly117 in the β-hairpin loop of the Asn112-Trp115 and Ser118-Tyr115 strands of the active site of TLN are examined. Chapter 3 explores the mechanism of salt-induced activation and stabilization of TLN by comparing the effects of Asn116→Asp and Asp150→Glu mutations on NaCl-induced activation and stabilization. Chapter 4 examines the effects of conversion of the zinc-binding motif sequence of TLN from HEXXH to HEXXXH on catalytic activity and stability. Throughout this study, the mutation of a residue e.g. Asn116 to Asp was designated as Asn116→Asp, and the TLN variant bearing the mutation was designated as N116D.
5
Chapter 1
Effects of Site-directed Mutagenesis of the Loop Residue of the N-terminal Domain Gly117 of Thermolysin on Its Catalytic Activity
Introduction
The active site of TLN is composed of one zinc ion and five polypeptide regions (12). Site-directed mutagenesis studies of TLN have been done extensively in the five regions, especially on its active-site residues (24–32). Of the active-site residue variants, L144S, D150E, and I168A exhibited higher activities than WT in the hydrolysis of FAGLA, a widely used substrate for TLN (18, 33). L155A had higher stability than WT (27, 28). N112D (28), F114H (10), and Q225A (29) had modified pH-activity profiles.
In the N-terminal domain of TLN, two parallel polypeptide strands, Asn112-Ala113-Phe114-Trp115 and Ser118-Gln119-Met120-Val121-Tyr122, are connected by a short loop, Asn116-Gly117, to form an anti-parallel β-sheet at the active site (Fig. 1). The Asn112-Trp115 strand is located in the active site, while the Ser118-Tyr122 strand and the Asn116-Gly117 loop are located outside the active site. The objective of this study was to explore the catalytic role of Gly117 by site-directed mutagenesis. TLN variants were expressed in Escherichia coli, purified, and characterized for their activities and thermal stabilities in the hydrolysis of FAGLA and ZDFM.
Materials and Methods
Materials – Bovine milk casein of Hammerstein grade (lot WKL1761) was
6
purchased from Sigma (St. Louis, MO). The concentrations of FAGLA and ZDFM were determined spectrophotometrically using the molar absorption coefficients, ε345 = 766
M-1 cm-1 and ε257 = 387 M-1 cm-1, respectively (18, 22).
Bacterial strains, plasmids, and transformation – E. coli K12 JM109, recA1, endA1, gyrA96, thi, hsdR17, supE44, relA1, ∆(lac-proAB), F′(traD36, proAB+ lacIq, lacZ∆M15), was used. pTMP1 is an expression plasmid that co-expresses the mature
sequence of TLN that contains the pelB leader sequence at its N-terminus and the pre-prosequence (34). Site-directed mutagenesis was carried out using a QuikchangeTM
site-directed mutagenesis kit (Stratagene, La Jolla, CA). The nucleotide sequences of the mutated TLN genes were verified with a Shimadzu DNA sequencer DSQ-2000 (Shimadzu, Kyoto, Japan). JM109 cells were transformed with the resulting plasmids and cultured in L broth. Ampicillin was used at a concentration of 50 µg/ml.
Purification of TLN variants – TLN variants were expressed into the supernatant
of E. coli cultures and purified to homogeneity by sequential column chromatography of the supernatant (34–36). Briefly, for seed culture, 5 ml of L broth in a 20-ml test tube was inoculated with glycerol stock of transformed JM109 cells and grown with shaking at 37ºC for 12 h. The culture (5 ml) was supplemented with 500 ml of L broth in a 1-liter flask and incubated at 37ºC for 48 h, with 0.1% (w/v) anti-foam A (Sigma) and vigorous aeration with an air pump. The supernatant was applied to a column packed with Toyopearl Phenyl-650M gel (Tosoh, Tokyo). Active fractions were pooled and then applied to a column of Gly-D-Phe coupled to CNB-activated Sepharose 4B resin
(Amersham-Pharmacia Biotech, Uppsala, Sweden). Prior to kinetic measurement, the preparations were desalted using pre-packed PD-10 gel filtration columns (Amersham Biosciences, Uppsala, Sweden).
SDS-PAGE – SDS-PAGE was performed in a 12.5% polyacrylamide gel under
reducing conditions by the method of Laemmli (37). A constant current of 40 mA was applied for 40 min. Supernatants were reduced by treatment with 2.5%
7
2-mercaptoethanol at 100ºC for 10 min. Proteins were stained with Coomassie Brilliant Blue R-250. A molecular-mass marker kit consisting of rabbit muscle phosphorylase b (97.4 kDa), bovine serum albumin (66.3 kDa), rabbit muscle aldolase (42.4 kDa), bovine erythrocyte carbonic anhydrase (30.0 kDa), soybean trypsin inhibitor (20.1 kDa), and hen egg white lysozyme (14.4 kDa) was from Daiichi Pure Chemicals (Tokyo).
Two-dimensional gel electrophoresis – Isoelectric focusing (IEF) was done with
agarGel (Atto, Tokyo), containing carrier ampholytes (pH 3–10) and discRun (Atto). A constant voltage of 300 V was applied for 210 min. Purified WT or G117E (50 µl of 2 µg/ml in 60 mM Tris-HCl pH 8.9, 5 M urea, 1 M thiourea, 1% (v/v) 3-[(3-cholamidopropyl)dimethylammonio]-1-propane sulfonate (CHAPS), 1% (v/v) Triton X-100, and 1% (w/v) DTT) were applied to agarGel. After IEF, the gels were expelled from the tubes and equilibrated in 2.5% (w/v) trichloroacetic acid for 3 min, followed by immersion in water. They were then placed on top of a 12.5% polyacrylamide gel, and SDS-PAGE was done as described above.
Hydrolysis of casein – Casein-hydrolyzing activity was measured by methods
described previously (3, 31). The TLN solution (0.5 ml) was added to 1.5 ml of a solution containing 1.33% (w/v) casein and 40 mM Tris-HCl pH 7.5, and incubated at 25ºC for 30 min. The reaction was stopped by the addition of 2 ml of a solution containing 0.11 M trichloroacetic acid, 0.22 M sodium acetate, and 0.33 M acetic acid. After 1 h of incubation at 25ºC, the reaction mixture was filtered through Whatman no. 2 filter paper (diameter 70 mm), and the absorbance (A275) at 275 nm was measured.
One proteolytic unit (PU) is defined as the amount of enzyme activity that liberates a quantity of acid soluble peptides that corresponds to an increase in A275 of 0.0074 (A275
of 1 µg of tyrosine)/min.
Spectrophotometric analysis of the TLN-catalyzed hydrolysis of FAGLA –
TLN-catalyzed hydrolysis of FAGLA was measured by the decrease in absorbance (A345) at 345 nm (17, 18). The amount of FAGLA hydrolyzed was evaluated using the
8
molar absorption difference due to hydrolysis, Δε345 = -310 M-1 cm-1, at 25ºC (17, 18, 32). The reaction was carried out in 40 mM acetate-NaOH buffer at pH 4.0–5.5, 40 mM
MES-NaOH buffer at pH 5.5–7.0, 40 mM HEPES-NaOH buffer at pH 7.0–8.5, and TAPS-NaOH buffer at pH 8.0–9.0, each of which contained 10 mM CaCl2, at 25ºC.
Hydrolysis was carried out under pseudo first-order conditions, where the substrate concentration is much lower than the Km (> 30 mM) (18) because of the sparing
solubility (< 6 mM) of FAGLA (16, 18, 32). Under the conditions, the kinetic parameters, Km and kcat, cannot be determined separately, and enzyme activity was
evaluated by the kcat/Km. The intrinsic kcat/Km, ((kcat/Km)o), and the proton dissociation
constants (Ke1 and Ke2) for the bell-shaped pH-dependence of activity (kcat/Km) were
calculated from eq. 1 by a non-linear least-squares regression method with Kaleida Graph Version 3.5 (Synergy Software, Essex, VT):
(kcat/Km)obs = (kcat/Km)o / {1 + ([H] / Ke1) + (Ke2 / [H])} (1)
In this equation, (kcat/Km)obs and [H] are the kcat/Km values observed and the proton
concentration, respectively, at a specified pH, and Ke1 and Ke2 correspond to the pKas in
the acidic and alkaline sides of the pH-dependence curve of (kcat/Km)obs.
Spectrophotometric analysis of the TLN-catalyzed hydrolysis of ZDFM –
TLN-catalyzed hydrolysis of ZDFM was measured by following the decrease in absorbance (A224) at 224 nm (18). The amount of ZDFM hydrolyzed was measured
using the molar absorption difference due to hydrolysis, Δε224 = -493 M-1 cm-1, at 25ºC
(17). The reaction was carried out with TLN in 40 mM Tris-HCl buffer (pH 7.5) containing 10 mM CaCl2 at 25ºC. The kinetic parameters, kcat and Km, were determined
with Kaleida Graph Version 3.5, based on the Michaelis-Menten equation using the non-linear least-squares method (38).
Thermal inactivation of TLN – TLN (0.5–8 µM) in 40 mM HEPES-NaOH buffer
9
incubated at 25ºC for 1 min. The remaining activity of TLN toward FAGLA hydrolysis was determined as described above. Under the assumption that thermal inactivation of TLN is irreversible and consists of only one step (31, 32 ,39), the kobs was evaluated by
plotting the logarithm of the residual activity (kcat/Km) against the duration of thermal
treatment.
Results
Production of Gly117 variants to homogeneity – Gly117 was changed into one of
the negatively charged amino acid residues (Asp and Glu), one of the positively charged ones (Lys and Arg), or an uncharged one (Ala). WT and variants were expressed in E.
coli and purified from the supernatants.
Figure 2 shows a time course for the cultures of the transformants. In the transformants with the expression plasmids for WT and G117E, casein hydrolysis activities appeared in the supernatants and increased progressively even after OD600
reached maximum. In the transformants with the expression plasmid for G117D, G117K, and G117R, low casein hydrolysis activity appeared in the supernatants and increased slightly with time. In the transformants with the expression plasmid for G117A, casein hydrolysis activities did not appear in the supernatants.
On SDS-PAGE, under reducing conditions, of the culture supernatants of the E.
coli cells transformed with the expression plasmids for WT and the Gly117 variants, the
34.6-kDa protein band was clearly detected for WT, G117E, and G117K, but was hardly detected for G117A, G117D, or G117R. Figure 3 shows SDS-PAGE of the purified WT and the Gly117 variants, except for G117A. The TLN thus obtained yielded a single band with a molecular mass of 34.6 kDa. From 380–850 ml of the culture supernatants, 1.1 mg of WT, 0.04 mg of G117D, 1.8 mg of G117E, 0.10 mg of G117K, and 0.10 mg of G117R were recovered. Purified G117A was not obtained. Isoelectric focusing showed that the pI values of WT and G117E were 5.3 and 4.8, respectively (data not shown), indicating that the pI value of TLN was shifted by 0.5 pH
10 unit by the mutation Gly117→Glu.
Characterization of Gly117 variants – The specific activities of WT, G117D,
G117E, G117K, and G117R in the hydrolysis of casein were 11,000, 2,000, 12,000, 3,200, and 2,900 units/mg, respectively, indicating that the specific activity of G117E was almost the same as that of WT, while those of G117D, G117K, and G117R were 20–30% of that of WT. We did not attempt further characterization of G117D due to paucity of the purified enzyme.
Figure 4A shows the pH-dependence of the kcat/Km of the TLN-catalyzed
hydrolysis of FAGLA at 25ºC. All the plots showed bell-shaped curves, with an optimal pH of about 7. The (kcat/Km)o, pKe1, and pKe2 values are summarized in Table 1. The
(kcat/Km)o values for G117E, G117K, and G117R were 80, 40, and 40%, respectively, of
that of WT. The pKe1 and pKe2 values of the variants were similar to those of WT,
except for the pKe2 value for G117R (8.6 ± 0.1), which was higher by 0.4 ± 0.3 units
than that for WT (8.2 ± 0.2).
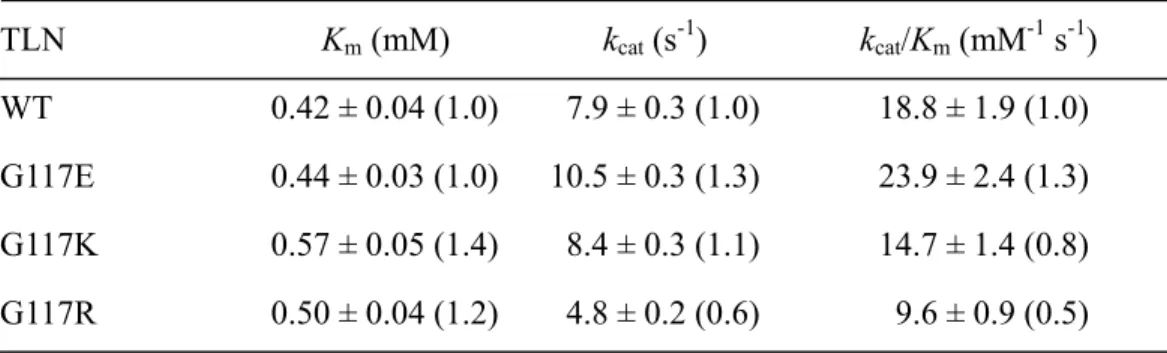
Figure 4B shows the dependence of the initial reaction rate (vo) of the
TLN-catalyzed hydrolysis of ZDFM at pH 7.5 at 25ºC on substrate concentration. All the plots showed saturated profiles. The kcat and Km values are summarized in Table 2.
The kcat/Km values of G117E, G117K, and G117R were 130, 80, and 50%, respectively,
of that of WT. The high kcat/Km value of G117E was ascribed to its high kcat value.
We have reported that TLN activity increases with increasing concentration of neutral salts such as NaCl, and that the degree of NaCl-induced activation, which is defined as the ratio of the kcat/Km value at 4.0 M NaCl to that at 0 M NaCl, is in the
range of 13–15 (22). Table 3 shows the kcat/Km values at 0 and 4.0 M NaCl in the
hydrolysis of FAGLA and the degrees of NaCl-induced activation. The degrees of activation of G117E, G117K, and G117R were 90, 30, and 50%, respectively, of that of WT.
Figure 5 shows the time-dependence of thermal inactivation of the TLN variants at 80ºC. Inactivation followed pseudo first-order kinetics. The kobs values are
11
thermal inactivation of TLN at 80ºC was enhanced in the variants in the order G117K > G117R > G117E.
Discussion
Altered substrate specificity of G117E – In TLN, the S1 subsite is constituted by
Phe114, and the S1′ subsite by Phe130, Leu133, Val139, Ile188, Gly189, Val192, and Leu202 (9, 10, 25, 29). Crystallographic analysis of the complex of TLN and an analog of the tetrahedral intermediate carbobenzoxy-GlyP-L-Leu-L-Leu (“GlyP” indicates the tetrahedral phosphorus of a phosphonamidate moiety corresponding to the trigonal carbon of the peptide linkage) revealed the postulated hydrogen bonds between TLN and the substrate, ND2 of Asn112 and O of the P2´ residue, OD1 of Asn112 and N of the P2´ residue, O of Ala113 and N of P1´ Leu, and N of Trp115 and O of P2 residue (40). Based on these findings, we speculate as follows: (i) TLN variants with altered substrate specificity can be obtained if the geometry of the S1 and S1´ subsites is changed without much affecting the backbone structure of the Asn112-Trp115 strand, and (ii) the geometry of the Asn112-Trp115 strand can be changed by mutation of Gly117, because the Asn116-Gly117 loop connects the Asn112-Trp115 strand and the Ser118-Tyr122 strand, and Gly is the most flexible amino acid residue.
The specific activities of G117E and WT in the hydrolysis of casein were almost the same, described in “Results”. However, the kcat/Km value in the hydrolysis of
FAGLA of G117E was slightly lower than that of WT (Fig. 4A, Table 1), while the
kcat/Km value in the hydrolysis of ZDFM of G117E was slightly higher than that of WT
(Fig. 4B, Table 2). The enhanced kcat/Km value of G117E in the hydrolysis of ZDFM is
ascribed to an increase in kcat. FAGLA and ZDFM are substrates routinely used in the
characterization of TLN (3, 18) and neutral proteases from B. stearothermophilus (41–
43). FAGLA is a poorly soluble neutral dipeptide, while ZDFM is a negatively charged
dipeptide. We have reported several TLN variants, L144S, D150E, and I168A, with higher FAGLA- and ZDFM-hydrolyzing activities than WT (12, 31, 32). In contrast,
12
G117E is the first TLN variant with lower FAGLA-hydrolyzing and higher ZDFM-hydrolyzing activities. Our strategy appears to have been effective in altering the substrate specificity of TLN.
Decreased production levels of G117A and G117D – G117A was not produced at
detectable levels in the supernatant of the E. coli transformants (Figs. 2 and 3). For their expression, we used an E. coli expression system that does not require autocatalytic cleavage. In this system, the mature domain of TLN, containing an NH2-terminal
pectate lyase B leader sequence and the pre-prodomain of TLN, were co-expressed constitutively in E. coli as independent polypeptides under the original promoter sequences in the npr gene, which encodes TLN (34). Indeed, all 72 active-site TLN variants were produced at similar levels by this system whether or not they retained activity (34). Considering that Ala is more hydrophobic than Gly, the introduced Ala117 might be oriented into a polar environment or outside the protein core, rendering the protein unstable.
G117D was produced at detectable levels in the supernatant of the E. coli transformants, but was scarcely purified (Figs. 2 and 3). Asp and Glu have similar characteristics: the pKe1 of their side chains in proteins are 4.4–4.6, their hydrophobicity
scores are -3.5; and their volumes are 125 and 155 Å3, respectively (44). Currently there
is no explanation as to why the mutation Gly117→Glu is favourable, while Gly117→Asp is not favourable.
Decreased activities and stabilities of G117K and G117R – In the hydrolysis of
FAGLA and ZDFM, the kcat/Km values of G117K and G117R were 40–60% of those of
WT (Tables 1 and 2), while the degrees of salt-induced activation were 30–50% of that of WT (Table 3), and the kobs values for thermal inactivation at 80ºC were 220–400% of
that of WT (Table 4). We speculate that the positive charge introduced at position 117 affects the geometry of the Asn112-Trp115 strand and decreases the activity and stability of TLN. In regard to this, according to the crystal structure of TLN (Protein Data Bank no. 8TLN), the distance OD2 of Asp150 and Cα of Gly117 is only 4.2 Å.
13
Asp150 is located at C-terminal loop 1 (Asp150-Gly162) in the active site. We have found that D150E showed higher activity, while D150H and D150W showed higher stability (12). We presume that introduced Lys or Arg at position 117 interacts with Asp150, rendering the protein less active and stable.
TLN is a representative zinc metalloproteinase with high activity and stability. However, if its substrate specificity can be altered as we hope, it might provide many benefits to industry. Recent crystallographic analyses of aminopeptidase N have revealed that aminopeptidase N and TLN are strikingly similar in the structure of the C-terminal, but not so in the N-terminal domain (46, 47). There is a possibility that aminopeptidase activity can be generated in TLN by introducing negative charges that can recognize the positive charges of the N-terminal amino nitrogen of the substrate. In conclusion, Gly117 plays an important role in the activity and stability of TLN, presumably by affecting the geometry of the Asn112-Trp115 and Ser118-Tyr122 strands.
14
Table 1. pKe and intrinsic kcat/Km ((kcat/Km)o) values of WT and its variants in the
hydrolysis of FAGLA at 25ºC. TLN pKe1 pKe2 (kcat/Km)o (mM-1 s-1) WT 5.1 ± 0.2 (0.0) 8.2 ± 0.2 (0.0) 40 ± 3 (1.0) G117E 5.1 ± 0.2 (0.0) 8.3 ± 0.1 (+0.1) 33 ± 2 (0.8) G117K 5.1 ± 0.1 (0.0) 8.3 ± 0.1 (+0.1) 16 ± 3 (0.4) G117R 5.2 ± 0.1 (+0.1) 8.6 ± 0.1 (+0.4) 15 ± 2 (0.4)
Average of triplicate determinations with SD values are shown. Numbers in parentheses indicate ∆pKe as compared to those of WT and the (kcat/Km)o relative to that of WT.
15
Table 2. Kinetic parameters of the WT and its variants in the hydrolysis of ZDFM at 25ºC. TLN Km (mM) kcat (s-1) kcat/Km (mM-1 s-1) WT 0.42 ± 0.04 (1.0) 7.9 ± 0.3 (1.0) 18.8 ± 1.9 (1.0) G117E 0.44 ± 0.03 (1.0) 10.5 ± 0.3 (1.3) 23.9 ± 2.4 (1.3) G117K 0.57 ± 0.05 (1.4) 8.4 ± 0.3 (1.1) 14.7 ± 1.4 (0.8) G117R 0.50 ± 0.04 (1.2) 4.8 ± 0.2 (0.6) 9.6 ± 0.9 (0.5)
Average of triplicate determinations with SD values are shown. Numbers in parentheses indicate values relative to those of WT.
16
Table 3. Degree of salt-induced activation of WT and its variants in the hydrolysis of FAGLA at 25ºC.
TLN kcat/Km (mM-1 s-1) B/A
0 M NaCl (A) 4 M NaCl (B)
WT 40 ± 3 (1.0) 600 ± 20 (1.0) 15 (1.0) G117E 33 ± 2 (0.8) 476 ± 16 (0.8) 14 (0.9) G117K 16 ± 3 (0.4) 60 ± 2 (0.1) 4 (0.3) G117R 15 ± 2 (0.4) 105 ± 1 (0.2) 7 (0.5)
The reaction was carried out in 40 mM HEPES-NaOH buffer at pH 7.5, containing 10 mM CaCl2, at 25ºC. Average of triplicate determinations with the SD value is shown.
17
Table 4. Thermal stability of WT and its variants.
TLN kobsa x 104 (s-1)
WT 6.3 ± 0.4 (1.0) G117E 9.6 ± 0.5 (1.5) G117K 25 ± 2 (4.0)
G117R 14 ± 2 (2.2)
akobs determined at 80ºC. The average of triplicate determinations with the SD value is
18
Fig. 1. Close-up view of the active site of TLN. The structure is based on Protein Data
Bank no. 8TLN. The main chain is shown as a ribbon model. Side chains of the residues of the Asn112-Ala113-Phe114-Trp115 strand, the Asn116-Gly117 loop, the Ser118-Gln119-Met120-Val121-Tyr122 strand, and the catalytically important residue Glu143 are shown as ball and stick.
19
Fig. 2. Culturing of E. coli. (A) Cell densities (OD600) of the culture. (B) Casein
hydrolysis activity of the supernatants. JM109 cells transformed with pUC19 (●) and expression plasmids for the WT (○), G117A (□), G117D (■), G117E (△), G117K (◇), and G117R (◆) are cultured. Zero hour means start of test tube-shake culture.
0
50
100
150
200
0
10
20
30
40
50
Time (h)
Time (h)
Casein hydrolysis
activity (units/ml)
0
1
2
3
4
0
10
20
30
40
50
OD
600
20
Fig. 3. Coomassie Brilliant Blue-Stained 12.5% SDS-PAGE gel. Marker proteins
(lanes 1 and 9), native TLN purified from B. thermoproteolyticus (lanes 2 and 8), WT (lane 3), G117D (lane 4), G117E (lane 5), G117K (lane 6), and G117R (lane 7). The arrow indicates the band corresponding to mature TLN.
21
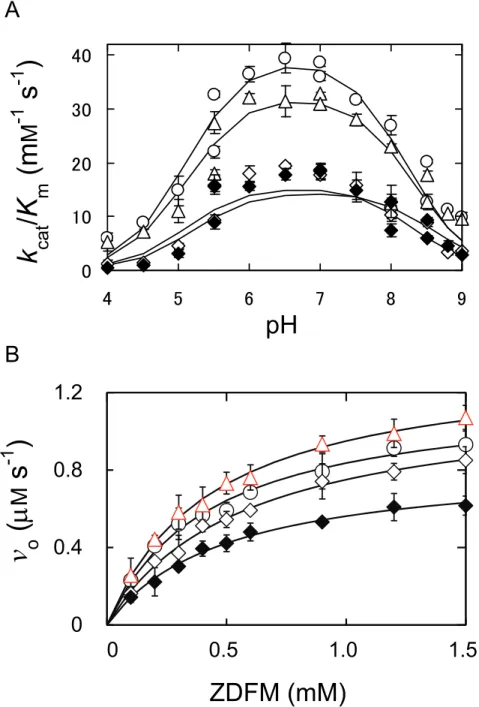
Fig. 4. Characterization of TLN variants. (A) Effect of pH on the initial reaction rate
(vo) in the TLN-catalyzed hydrolysis of FAGLA. The reaction was carried out with
initial concentrations of enzyme and FAGLA of 100 nM and 400 µM respectively at 25ºC. (B) Dependence on the substrate concentration of vo in the TLN-catalyzed
hydrolysis of ZDFM. The reaction was carried out with an initial enzyme concentration [E]o of 100 nM at 25ºC. Symbols: WT (○),G117E (△), G117K (◇), and G117R (◆).
Error bars indicate SD values for triplicate measurements.
B
ZDFM (mM)
k
cat
/K
m
(m
M
-1
s
-1
)
v
o
(
M
s
-1
)
pH
0
10
20
30
40
4
5
6
7
8
9
A
0.0
0.4
0.8
1.2
0.0
0.5
1.0
1.5
22
Fig. 5. Thermal inactivation of TLNs. TLN (1 µM) in 40 mM HEPES-NaOH buffer
(pH 7.5) containing 10 mM CaCl2 was incubated at 80ºC for 0–24 min. The
FAGLA-hydrolytic reaction was carried out with initial concentrations of enzyme and FAGLA of 100 nM and 400 µM respectively at 25ºC. The remaining activity (kcat/Km)
was expressed as the relative value to that of the intact enzyme (WT, 26 mM-1 s-1; G117E, 25 mM-1 s-1; G117K, 16 mM-1 s-1; and G117R, 15 mM-1 s-1) and plotted against the incubation time. Symbols: WT (○), G117E (△), G117K (◇), and G117R (◆). Error bars indicate SD values for triplicate measurements.
Time (min)
log [Relative activity (%
23
Chapter 2
Effects of Site-directed Mutagenesis of Asn116 in the β-Hairpin of the N-terminal Domain of Thermolysin on Its Activity and Stability
Introduction
TLN has a β-rich N-terminal domain (Ile1-Asp138) and an α-helical C-terminal domain (Asp150-Lys316) connected by an α-helix (Val139-Thr149) located at the bottom of the active site cleft (Fig. 1) (10). Extensive site-directed mutagenesis studies previously conducted in each of the active site polypeptide regions of TLN revealed that the N-terminal sheet and the -helix 2 are critical to catalysis and the C-terminal loops 1 and 2 are important in substrate recognition (12).
Two anti-parallel β-strands, (Asn112-Ala113-Phe114-Trp115 and Ser118-Gln119-Met120-Val121-Tyr122), located in the N-terminal, are connected by an Asn116-Gly117 turn to form a β-hairpin structure (Fig. 2A and B). The Asn112-Trp115 strand is located in the active site and forms the S2′, S1′, and S2 subsites, while the Ser118-Tyr122 strand and the Asn116-Gly117 turn are located outside the active site (17). (The subsites and the corresponding residues in the substrates are designated based upon the nomenclature of Schechter, I. and Berger, A. (48)). In Chapter 1, it was reported that G117E had higher activity in the hydrolysis of ZDFM but lower activity in the hydrolysis of FAGLA than WT, suggesting that Gly117 plays an important role in substrate specificity. In this study, to explore the catalytic role of the β-hairpin structure and possibly produce a variant enzyme with high performance, we made 19 amino-acid residues substitutions of Asn116 by site-directed mutagenesis and examined their effects on activity and stability.
24
Materials and Methods
Materials – All materials were prepared as described in Chapter 1.
Bacterial strains, plasmids, and transformation – Expression materials and
procedures are as described in Chapter 1. Site-directed mutagenesis, DNA sequencing, transformation, and culturing were performed as described in Chapter 1.
Purification of TLN variants – TLN variants were produced and purified as
described in Chapter 1. The concentration of TLN was determined spectrophotometrically using an absorbance value at 277 nm (1 mg/ml) of 1.83 and a molecular mass of 34.6 kDa (10).
SDS-PAGE – SDS-PAGE was carried out as described in Chapter 1.
CD measurement – A Jasco J-820 spectropolarimeter (Jasco, Tokyo) equipped
with a Peltier system to control the cell temperature was used. The spectrometer conditions were as follows: spectral range 200–260 nm; sensitivity 100 mdeg; resolution 0.1 nm; response time 4 s; scan rate 20 nm min−1; at seven scans per
measurement. CD spectra were recorded at 25°C using a 2-mm cell. The concentration of TLN was 1.0 μM in 5 mM Tris-HCl, 10 mM CaCl2, and 0 or 4.0 M NaCl at pH 7.5
(32, 49). Because HEPES has high absorbance at 180–210 nm, Tris was used as buffer system (50). The control baseline was obtained with solvent and all other the components without TLN. CD spectra were processed with Jasco software, and finally expressed in mean-residue molar ellipticity units, [θ] (deg cm2 dmol−1).
Hydrolysis of casein – TLN-catalysed hydrolysis of casein was carried out as
described in Chapter 1.
25
TLN-catalysed hydrolysis of FAGLA was carried out as described in Chapter 1.
Spectrophotometric analysis of the TLN-catalyzed hydrolysis of ZDFM –
TLN-catalysed hydrolysis of ZDFM was carried out as described in Chapter 1.
Thermal inactivation of TLN – Thermal inactivation of TLN was carried out as
described in Chapter 1. However, in this study, TLN was incubated at 80ºC in the presence of 1–100 mM CaCl2 for a specified duration, and the remaining activity that
hydrolyzes FAGLA was determined as described above.
Results
Production of Asn116 variants to homogeneity – Asn116 was replaced with either
one of the other 19 amino acids. The WT and the variants were expressed in E. coli in a system (15) in which the mature and pro domains were expressed as independent polypeptides. Figure 3 shows a time-course for a flask-shake culture of the transformants. In all transformants, the OD600 of the cultures increased with time and
reached a maximum (about 3.0 for the transformant with pUC19 and 1.2–2.3 for the transformants with the expression plasmids for TLN) after 18 or 24 h (Fig. 3A). After the aforementioned duration, in WT, N116A, N116D, N116T, and N116Q, the OD600
decreased over time, while in the other 15 variants, it was nearly stable. In WT, N116A, N116D, N116T, and N116Q, casein hydrolysis activity appeared in the supernatant and increased progressively even after OD600 reached the maximum level, while in the other
15 variants, it did not appear (Fig. 3B).
Figure 4A and B show the SDS-PAGE of the culture supernatants of the E. coli cells transformed with the expression plasmids for WT and the variants. The 34-kDa protein band was clearly detected for WT, N116A, N116D, N116T, and N116Q, but was not for the other 15 variants. Figure 4C shows the SDS-PAGE of the purified preparation of WT, N116A, N116D, N116T, and N116Q. They yielded a single band
26
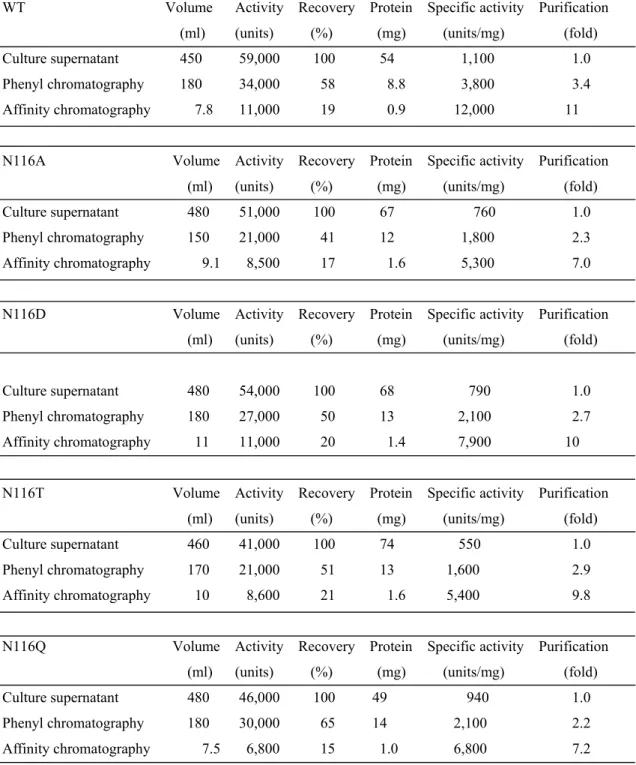
with a molecular mass of 34.6 kDa. Table 1 shows the purification data of WT and the four variants. From 450–480 ml of culture supernatants, 0.9–1.6 mg of purified enzymes were obtained. The specific activities of N116A, N116D, N116T, and N116Q in the hydrolysis of casein at 25ºC were 44, 66, 45, and 57%, respectively, of that of WT. Figure 4D shows the CD spectra of the purified enzymes at 200–260 nm. Each spectrum was characterized by negative ellipticities at 202–240 nm with the peaks at about 208 and 225 nm, suggesting that no significant conformational change was occasioned in TLN by the mutations.
Activity of Asn116 variants – Figure 5A shows the pH-dependence of kcat/Km of
the TLN-catalyzed hydrolysis of FAGLA at 25ºC. All plots showed bell-shaped curves with the optimal pH of 6–7. The results are summarized in Table 2. The pKe1, pKe2, and
(kcat/Km)o values of WT (5.1 ± 0.2, 8.2 ± 0.1, and 37 ± 3 mM-1 s-1, respectively) are
almost the same as the ones we previously reported (5.3 ± 0.0, 8.3 ± 0.0, and 40 ± 1 mM-1 s-1, respectively) (12). The (kcat/Km)o values of N116D was 320% of that of WT,
and those of the other three variants were 70–100% of that of WT. The pKe1 and pKe2
values of the variants were almost the same as those of WT.
TLN activity increases with increase in concentration of neutral salts (18). We defined the degree of the activation as the ratio of the kcat/Km value with 4.0 M NaCl to
that without NaCl, and showed that it is in the range of 13–15 in the hydrolysis of FAGLA (3, 17, 18). The kcat/Km values at pH 7.5 without NaCl and with 4.0 M NaCl
and the degree of the activation were 30 ± 4 mM-1 s-1, 440 ± 29 mM-1 s-1, and 15 for WT, 24 ± 3 mM-1 s-1, 330 ± 30 mM-1 s-1, and 14 for N116A, 95 ± 4 mM-1 s-1, 1000 ± 100
mM-1 s-1, and 11 for N116D, 24 ± 1 mM-1 s-1, 240 ± 10 mM-1 s-1, and 10 for N116T, 31
± 3 mM-1 s-1, 270 ± 40 mM-1 s-1, and 9 for N116Q. Thus, the degrees of the NaCl-induced activation of the variants were 60–90% of that of WT.
Figure 5B shows the dependence of the initial reaction rate (vo) of the
TLN-catalyzed hydrolysis of ZDFM on the substrate concentration at pH 7.5, at 25ºC. All plots showed saturated profiles. The kinetic parameters are summarized in Table 3. The Km values of the variants were 100–130% of that of WT. The kcat value of N116D
27
was 160% of that of WT, and those of the other three variants were 70–92% of that of WT. The kcat/Km value of N116D was 140% of that of WT, and those of other three
variants were 60–100%. These results indicate that N116D has higher activity than WT. They also indicate that N116Q has similar activity as WT, and N116A and N116T have reduced activities.
Stability of Asn116 variants – We examined time-dependences of the thermal
inactivation of WT and the variants at 80°C in the presence of various concentrations of CaCl2 ranging 1–100 mM. All inactivations followed pseudo-first-order kinetics (Fig.
6A for 10 mM CaCl2, data not shown for 1, 30, 50, and 100 mM CaCl2). Figure 6B
shows kobs of WT and the variants at each CaCl2 concentration. They decreased with
increasing CaCl2 concentrations and were in the order N116A, N116D, N116T > N116Q
> WT at all CaCl2 concentrations examined.
Discussion
Catalytic role of Asn116 – Figure 7A shows the typical β-hairpin peptide
backbone with two amino acid residues (t1 and t2) at the turn (51). The most common t1 and t2 residues are Asn and Gly, respectively, followed by Gly and Ser.Thus, we can ascribe not only Asn116 and Gly117 to t1 and t2 residues, but also Gly117 and Ser118 can be ascribed, respectively. Figure 2A is a close-up view of the polypeptide Asn112-Tyr122, in which side chains of all residues are shown. It appears the side chains of Trp115, Asn116, and Val121 are located inside the β-plane formed by the Asn112-Trp115 and Ser118-Tyr122 β-strands, while those of other residues are located outside it. The carbonyl oxygen (OD1) of Asn116 is involved in two hydrogen bonds, one with the main-chain nitrogen (N) of Ser118 and the other with N of Gln119. Such hydrogen bonds are absent in the typical β-hairpin peptide backbone (Fig. 7A). Figure 2B is another close-up view of the polypeptide Asn112-Tyr122, in which side chains of Trp115, Asn116, and Val121 are shown. It appears that there are two β-planes, one
28
formed by the polypeptides Asn112-Trp115 and Met120-Tyr122 and the other formed by Trp115-Met120. The side chain of Asn116 is located in the β-plane formed by Trp115-Met120, while those of Trp115 and Val121 are outside of these two β-planes. This is in contrast to recent reports that the Trp-Trp interaction between the two β strands is important for the stability of β-hairpin structure (52–54). Figure 2C shows an illustration of the two β-plane structure formed by the polypeptide Asn112-Tyr122. Such structure is absent in the typical β-hairpin peptide backbone (Fig. 7A).
In this study, we used an E. coli expression system which does not require autocatalytic cleavage: the mature domain and the pre-prodomain of TLN were co-expressed constitutively as independent polypeptides under the original promoter sequences in the npr gene, which encodes TLN (34). Previously we reported that all 70 variants, in which one of twelve active-site residues (Ala113, Phe114, Trp115, Asp150, Tyr157, Gly162, Ile168, Ser169, Asp170, Asn227, Val230, and Ser234) was replaced with either Asp, Glu, His, Lys, Arg, or Ala, could be produced at similar levels by this expression system whether or not they retained activity (12).In this study, of the 19 Asn116 variants, only four were produced (Figs. 3 and 4). The reason N116A, N116D, N116T, and N116Q are active and the other 15 variants are inactive is unclear. However, there are interesting features: only amino acid residues with side chains of moderate size can be accommodated inside the β-hairpin structure and are favorable at position 116.
In the hydrolysis of FAGLA and ZDFM, the activities were in the order N116D > WT > N116Q > N116A, N116T (Fig. 5). In thermal treatment, the stabilities were in the order WT > N116Q > N116D, N116T, N116A (Fig. 6). These results suggest that Asn116 plays an important role in the activity and stability of TLN presumably by stabilizing the β-hairpin structure. It is not clear why N116D is more active than WT. Relating to this, we previously speculated into the reason the TLN variant L144S was more active than WT: the side chain of Leu144 is buried in the interior of the protein, and thus the activation by these mutations is due to an increase in flexibility of TLN by a decrease in density of the inner part of the molecule (31). If this is true for N116D, the activation by the mutation of Asn116→Asp might be due to an increase in flexibility of TLN by the change in electrostatic environment of the β-hairpin structure.
29
It is interesting to note that N116D is more active but less stable than N116Q. This might be explained by the trade-off between activity and stability in enzymes: mutations which increase activity are accompanied with decrease in stability and vice versa (32,
55, 56).
The degree of the salt-induced activation of N116D was 11, comparable to that of WT (15). This suggests that salt-induced activation in TLN cannot be replaced by introducing activating mutations in place Asn116. This is in contrast to our previous finding that the degree of activation of highly active variants, L144S and D150E, were 4 and 5, respectively, and that salt-induced activation might be replaceable to some extent (32).
Role of the AsnGly sequence in the β-hairpin structure in zinc-proteinases –
Figure 7B shows the amino acid sequences of the β-structured polypeptides of five zinc-proteinases, Bacillus cereus neutral protease (57), Pseudomonas aeruginosa elastase (58), vibryolysin (59), protealysin (60), and human angiotensin I-converting enzyme (61), corresponding to Asn112-Tyr122 of TLN. The amino acid residues corresponding to Asn112, Ala113, Phe114, Trp115, Gly117, Ser118, and Met120 of TLN are highly conserved. In their crystal structures (Protein Data Bank accession number: B. cereus neutral protease, 1ESP; P. aeruginosa elastase, 3DBK; vibryolysin, 3NQY; protealysin, 2VQX; and human angiotensin I-converting enzyme, 1UZE), we noticed two hydrogen bonds in each of the five zinc-proteinases, corresponding to that between OD1 of Asn116 and N of Ser118 and that between OD1 of Asn 116 and N of Gln119 of TLN. They are the hydrogen bond between OD1 of Asn117 and N of Ser 119 and that between OD1 of Asn117 and N of Gln120 for B. cereus neutral protease, that between OD1 of Asp116 and N of Ser118 and that between OD1 of Asp116 and N of Ala119 for P. aeruginosa elastase, that between OD1 of Asp321 and N of Ser323 and that between OD1 of Asp 321 and N of Ala324 for vibryolysin, that between OD1 of Asn136 and N of Gln138 and that between OD1 of Asn136 and N of Gln139 for protealysin, and that between OD1 of Asn361 and N of Lys363 and that between OD1 of Asn361 and N of Asp364 for human angiotensin I-converting enzyme. This revealed
30
that the AsnGly or AspGly sequence and the hydrogen bonds between the OD1 of the Asn or Asp residue at the position of i and the N of the residues at i+1 and i+2 are well conserved in zinc-proteinases.
It is presumed that the carbonyl oxygen of the introduced Asp (OD1 or OD2) and Gln (OD1) forms the same hydrogen bonds as OD1 of Asn116 does. This presumption is supported by the observation that in P. aeruginosa elastase, the carbonyl oxygen of Asp116 forms the hydrogen bonds with the main-chain nitrogen of Thr118 and that of Ala119 (Fig. 7D). However, it should be noted that N116A has activity in spite of the fact that the introduced Ala116 does not form such hydrogen bonds. Therefore, we think that those hydrogen bonds are important for activity, but are not indispensable.
In conclusion, a highly active TLN variant N116D was obtained. It is suggested that Asn116 plays an important role in the activity and stability of TLN presumably by stabilizing the β-hairpin structure. Site-directed mutagenesis of analogous residues in the β-hairpin structure might be similarly effective in improving performances in various zinc-proteinases.
31
Table 1. Purification of Asn116 variants from the supernatant of the E. coli transformants.
WT Volume Activity Recovery Protein Specific activity Purification (ml) (units) (%) (mg) (units/mg) (fold)
Culture supernatant 450 59,000 100 54 1,100 1.0 Phenyl chromatography 180 34,000 58 8.8 3,800 3.4 Affinity chromatography 7.8 11,000 19 0.9 12,000 11
N116A Volume Activity Recovery Protein Specific activity Purification (ml) (units) (%) (mg) (units/mg) (fold)
Culture supernatant 480 51,000 100 67
760 1.0 Phenyl chromatography 150 21,000 41 12 1,800 2.3 Affinity chromatography 9.1 8,500 17 1.6 5,300 7.0
N116D Volume Activity Recovery Protein Specific activity Purification (ml) (units) (%) (mg) (units/mg) (fold)
Culture supernatant 480 54,000 100 68 790 1.0 Phenyl chromatography 180 27,000 50 13 2,100 2.7
Affinity chromatography 11 11,000 20 1.4 7,900 10
N116T Volume Activity Recovery Protein Specific activity Purification (ml) (units) (%) (mg) (units/mg) (fold)
Culture supernatant 460 41,000 100 74
550 1.0 Phenyl chromatography 170 21,000 51 13 1,600 2.9 Affinity chromatography 10 8,600 21 1.6 5,400 9.8
N116Q Volume Activity Recovery Protein Specific activity Purification (ml) (units) (%) (mg) (units/mg) (fold)
Culture supernatant 480 46,000 100 49 940 1.0 Phenyl chromatography 180 30,000 65 14 2,100 2.2 Affinity chromatography 7.5 6,800 15 1.0 6,800 7.2
32
Table 2. pKe and intrinsic kcat/Km ((kcat/Km)o) values of Asn116 variants in the
hydrolysis of FAGLA at 25ºC. TLN pKe1 pKe2 (kcat/Km)o (mM-1 s-1) WT 5.1 ± 0.2 (0.0) 8.2 ± 0.1 (0.0) 37 ± 3 (1.0) N116A 5.1 ± 0.1 (±0.0) 8.3 ± 0.1 (+0.1) 31 ± 1 (0.8) N116D 5.4 ± 0.1 (+0.3) 8.4 ± 0.1 (+0.2) 117 ± 6 (3.2) N116T 5.1 ± 0.1 (±0.0) 8.5 ± 0.1 (+0.3) 26 ± 1 (0.7) N116Q 5.1 ± 0.2 (±0.0) 8.3 ± 0.1 (+0.1) 37 ± 3 (1.0)
Average of triplicate determinations with SD values are shown. Numbers in parentheses indicate ∆pKe compared to those of WT and the (kcat/Km)o relative to that of WT.
33
Table 3. Kinetic parameters of Asn116 variants in the hydrolysis of ZDFM at 25ºC.
TLN Km (mM) kcat (s-1) kcat/Km (mM-1 s-1) WT 0.39 ± 0.04 (1.0) 7.7 ± 0.1 (1.0) 20 ± 1 (1.0) N116A 0.41 ± 0.04 (1.1) 6.7 ± 0.7 (0.8) 16 ± 1 (0.8) N116D 0.43 ± 0.04 (1.1) 12 ± 1 (1.5) 27 ± 2 (1.4) N116T 0.49 ± 0.03 (1.3) 5.4 ± 0.1 (0.7) 11 ± 1 (0.6) N116Q 0.38 ± 0.06 (1.0) 7.1 ± 0.1 (0.9) 19 ± 1 (1.0)
Average of triplicate determinations with SD value is shown. Numbers in parentheses indicate values relative to those of WT.
34
Fig. 1. Overall structure of TLN. The structure is based on Protein Data Bank
accession number 8TLN. The main chain is represented by a ribbon model. Side chains of Asn116 and Gly117 and the catalytically important residues Glu143 and His231 are shown by a ball and stick. Zinc and calcium ions are shown as spheres.
Zn
2+G117
Ca
2+Ca
2+Ca
2+Ca
2+H231
E143
N116
35
Fig. 2. β-Hairpin structure in TLN active site. (A) and (B), Close-up view of the
Asn112-Trp115 strand, the Asn116-Gly117 loop, and the Ser118-Tyr122 strand of TLN. All atoms are shown by a ball and stick (A), and all main-chain atoms and the side-chain atoms of Trp115, Asn116, and Val121 are shown by a ball and stick (B). Oxygen is colored black, and carbon, nitrogen, and sulfur gray. Hydrogen bonds are represented by dotted lines together with the distances (Å). (C) Illustration of the two -planes formed by Asn112-Trp115 and Met120-Tyr122 and by Trp115-Met120.
G117
A
C
B
V121
W115
N116
Q119
S118
Y122
A113
N112
N112
M120
F114
36
Fig. 3. Culturing of E. coli. (A) Cell densities. (B) Casein hydrolysis activities. OD600
of culture (A) and casein hydrolysis activities of the supernatants (B) of E. coli cells transformed with pUC19 (●) or the expression plasmids for WT (○), N116A (Δ), N116D (□), N116T (▲), N116Q, (■), or the other 15 variants (+) are plotted against time. In the figure, the points of the 15 variants are overlapped with those of pUC19. 0 h means start of flask-shake culture. Variant names are abbreviated: for example, “A” stands for N116A.
OD
60
0
Time (h)
A
Casein hydrolysis
activity (units/ml)
Time (h)
37
Fig. 4. Expression and purification of Asn116 variants. (A-C) Coomassie Brilliant
Blue-stained 12.5% SDS-PAGE. (A) The marker proteins (lanes 1 and 13), native TLN purified from B. thermoproteolyticus (lane 2), and the supernatants of E. coli cells transformed with pUC-19 (lane 3) and the expression plasmids for WT (lane WT), N116A (lane A), N116D (lane D), N116T (lane T), N116Q (lane Q), N116C (lane C), N116E (lane E), N116F (lane F), N116G (lane G). (B) The marker proteins (lanes 1 and 14), native TLN purified from B. thermoproteolyticus (lane 2), and the supernatants of
E. coli cells transformed with the expression plasmids for N116H (lane H), N116I (lane
I), and N116K (lane K), N116L (lane L), N116M (lane M), N116P (lane P), N116R (lane R), N116S (lane S), N116V (lane V), N116W (lane W), and N116Y (lane Y). (C) The marker proteins (lanes 1 and 8), native TLN purified from B. thermoproteolyticus (lane 2), and purified preparations of WT (lane WT), N116A (lane A), N116D (lane D), N116T (lane T), and N116Q (lane Q). The arrow indicates the band corresponding to TLN. (D) CD spectra. CD spectra were measured for 2.1 M TLN in 5 mM Tris-HCl, 10 mM CaCl2 at pH 7.5, at 25ºC.
B
D
1 2 [θ ] × 1 0 -3 (deg c m 2 d mo l -1 ) 1 2 338
Fig. 5. Activity of Asn116 variants. (A) Effect of pH on the initial reaction rate (vo) in
the hydrolysis of FAGLA. The reaction was carried out in 40 mM acetate-NaOH at pH 4.0–5.5, 40 mM MES-NaOH at pH 5.5–7.0, 40 mM HEPES-NaOH at pH 7.0–8.5, and 40 mM TAPS-NaOH at pH 8.0–9.0, each of which contained 10 mM CaCl2, at 25ºC.
The initial concentrations of enzyme and FAGLA were 100 nM and 400 µM, respectively. (B) Dependence of vo on substrate concentration in the hydrolysis of
ZDFM. The reaction was carried out in 40 mM Tris-HCl, 10 mM CaCl2 at pH 7.5, at
25ºC. Symbols for enzymes: WT (○), N116A (Δ), N116D (□), N116T (▲), and N116Q (■). Error bars indicate SD values for three-times measurements.
0
20
40
60
80
100
120
4
5
6
7
8
9
k
cat/K
m(mM
-1s
-1)
pH
A
0.0
0.2
0.4
0.6
0.8
1.0
0.0
0.5
1.0
1.5
v
o(
M s
-1)
ZDFM (mM)
B
39
Fig. 6. Thermal stability of Asn116 variants. (A) Thermal inactivation at 10 mM
CaCl2. (B) Effect of CaCl2 concentration on the thermal inactivation. TLN (2 µM) in 40
mM HEPES-NaOH, 1, 10, 30, 50, or 100 mM CaCl2 at pH 7.5 was incubated at 80ºC
for a specified duration. The FAGLA-hydrolytic reaction was carried out at 25ºC with the initial concentrations of enzyme and FAGLA of 100 nM and 400 µM, respectively. The remaining activity (kcat/Km) was expressed as the relative value to that of the intact
enzyme (WT, 29 mM-1 s-1; N116A, 23 mM-1 s-1; N116D, 95 mM-1 s-1; N116T, 23 mM-1 s-1; and N116Q, 29 mM-1 s-1) and plotted against the incubation time (A). The kobs
values of TLN were plotted against the CaCl2 concentration (B). Symbols correspond to
those of Fig. 5. Error bars indicate SD values for three-times measurements.
[CaCl
2] (mM)
A
A
1.0
1.2
1.4
1.6
1.8
2.0
0
4
8
12
16
20
24
log [Relative activity (%)]
Time (min)
B
0
4
8
12
16
20
0
20
40
60
80
100
k
ob s× 10
-4(s
-1)
[CaCl
2] (mM)
40
Fig. 7. β-hairpin structure. (A) Schematic illustration of typical β-hairpin peptide
backbone with two amino acid residues at the turn. Side chains are indicated by “R”. Hydrogen bonds linking the amide hydrogen and carbonyl oxygen are indicated by dotted lines. Residues at the N-terminal β-strand, at the turn, and at the C-terminal β-strand are labelled turn as “n”, “t”, and “c”, respectively. (B) Amino acid sequences of zinc-proteinases corresponding to Asn112-Tyr122 of TLN. (C) Schematic illustration of the β-hairpin structures of Phe114-Gln119 of TLN and Phe115-Gln120 of B. cereus neutral protease. (D) Schematic illustration of the β-hairpin structure of Tyr114-Ala119 of P. aeruginosa elastase.
P. aeruginosa elastase
TLN and B. cereus neutral protease
A
B
C
D
Enzyme Sequences TLN 112 N A F W N G S Q M V Y 122
B. cereus neutral protease 113 N A F W N G S Q M Y Y 123
P. aeruginosa elastase 112 N A Y W D G T A M L F 122
Vibryolysin 317 N A F W D G S A M TF327 Protealysin 132 N A F W N G Q Q M V F 142
41
Chapter 3
Effects of the Mutations, Asn116 to Asp and Asp150 to Glu, of Thermolysin on Its Salt-induced Activation and Stabilization
Introduction
TLN activity increases in an exponential fashion with increasing concentration of neutral salts (17, 18, 20–23). TLN stability also increases at 0–2 M NaCl (9). This stabilizing effect decreases above 2 M NaCl (20). Previously, several mutations which increase the hydrolytic activity for FAGLA and ZDFM were identified (12, 31, Chapter
1, Chapter 2). Of such mutations, Asn116→Asp (Chapter 2) and Asp150→Glu (12)
exhibited the highest effect. In the absence of NaCl, the activities of N116D and D150E are about 3 times higher than that of WT (12, Chapter 2). In the absence of NaCl, Asn116→Asp decreased stability while Asp150→Glu did not change it. Asn116 is located in the β-hairpin structure in the N-terminal domain, while Asp150 is located in the active-site loop in the C-terminal domain (Fig. 1). Out of the 19 variants of Asn116, only N116D exhibited higher activity than WT while maintaining a high level of NaCl-induced activation comparable to that of WT (Chapter 2). This was unique in comparison to our earlier work wherein variants with higher activity than WT, such as D150E, exhibited drastically reduced degrees of NaCl-induced activation (12).
In this study, to explore the mechanism of the salt-induced activation and stabilization of TLN, we compared the effects of Asn116→Asp and Asp150→Glu on NaCl-induced activation and stabilization. The results indicate that Asp150→Glu markedly decreases NaCl-induced activation and stabilization while Asn116→Asp does not exhibit any such marked decrease. Based on the results obtained, we discuss the mechanism of the salt-induced activation and stabilization of TLN.
42
Materials and Methods
Materials – All materials were prepared as described in Chapter 1.
Bacterial strains, plasmids, and transformation – Expression materials and
procedures are as described in Chapter 1. Site-directed mutagenesis, DNA sequencing, transformation, and culturing were performed as described in Chapter 1.
Purification of TLN – TLN variants were produced and purified as described in
Chapter 1.
SDS-PAGE – SDS-PAGE was carried out as described in Chapter 1.
Hydrolysis of casein – TLN-catalysed hydrolysis of casein was carried out as
described in Chapter 1.
Spectrophotometric analysis of the TLN-catalyzed hydrolysis of FAGLA –
TLN-catalysed hydrolysis of FAGLA was carried out as described in Chapter 1.
Spectrophotometric analysis of the TLN-catalyzed hydrolysis of ZDFM –
TLN-catalysed hydrolysis of ZDFM was carried out as described in Chapter 1.
CD measurement – CD measurement was carried out as described in Chapter 2.
Thermal inactivation of TLN – Thermal inactivation of TLN was essentially
carried out as described in Chapter 1. However, in this study, TLN solutions containing 0–4.0 M NaCl was incubated at 70ºC for specified durations, and the remaining activity to hydrolyze FAGLA was determined as described above.
43
Results
Production of TLN variants – Starting with 500 ml of E. coli cultures, 0.7–2.0 mg
of purified preparations of TLN variants were recovered (Table 1). On SDS-PAGE under reducing conditions, each of them yielded a single band with a molecular mass of 34.6 kDa (Fig. 2). All CD spectra of WT and variants measured in the presence of 0 and of 4.0 M NaCl were essentially the same: each spectrum was characterized by negative ellipticities at about 206–230 nm with peaks at about 208 and 225 nm (data not shown). This suggests that no significant conformational change was occasioned in TLN by mutation and/or 4.0 M NaCl. Table 1 shows the hydrolysis activities of the TLN variants for casein at pH 7.5 at 25ºC. The activities of the variants relative to that of WT were 60–70%. This indicates that the mutations of Asn116→Asp and Asp150→Glu decrease casein-hydrolyzing activity, in accord with our previous results (12, 23, 34).
NaCl-induced activation of TLN variants in FAGLA hydrolysis – The
FAGLA-hydrolyzing activities of WT and its variants in the presence of 0–4.0 M NaCl were measured (Fig. 3). The kcat/Km values in the absence of NaCl were (2.8 ± 0.3) ×
104 M-1 s-1 for WT, in good accord with that reported previously [(2.9 ± 0.2) × 104 M-1
s-1] (32), (9.2 ± 1.2) × 104 M-1 s-1 for N116D, (7.5 ± 0.1) × 104 M-1 s-1 for D150E, and
(1.6 ± 0.2) × 105 M-1 s-1 for N116D/D150E. This indicates that the mutations Asn116→Asp and Asp150→Glu increase FAGLA-hydrolyzing activity, and the Asn116→Asp in combination with Asp150→Glu yielded a significant increase in the hydrolytic activity of FAGLA. The kcat/Km values of WT and the variants increased with
increasing NaCl concentrations in an exponential fashion. Relative activity was defined by eq. 1:
Relative activity at x M NaCl = kcat/Km at x M NaCl (1)
kcat/Km at 0 M NaCl
44
relative activity at x M NaCl); the y value is in good agreement with that (1.9) reported previously (18), and those of N116D, D150E, and N116D/D150E were expressed by y = 1.75x, y = 1.49x, and y = 1.46x, respectively. The degrees of activation at 4.0 M NaCl were 15 for WT, 9.3 for N116D, 4.9 for D150E, and 4.5 for N116D/D150E, and the
kcat/Km values were (4.3 ± 0.4) × 105, (8.6 ± 0.7) × 105, (3.7 ± 0.2) × 105, and (7.4 ± 0.7)
× 105 M-1 s-1, respectively. These indicate the relative activities at 0.5–4.0 M NaCl at pH 7.5 were in the order WT > N116D > D150E, N116D/D150E. In other words, Asp150→Glu markedly reduced NaCl-induced activation, while Asn116→Asp reduced it slightly.
Figure 4A and B shows the effects of pH on the FAGLA-hydrolysis activity of WT and the variants at 25ºC at 0 and 4.0 M NaCl, respectively. All the plots showed bell-shaped curves, with an optimal pH of about 7. The acidic and alkaline pKe (pKe1
and pKe2) values and the (kcat/Km)o values are summarized in Table 2. In WT, the pKe1
value shifted from 5.2 to 6.4 while the pKe2 value remained constant at 4.0 M NaCl, in
good accord with those reported previously (21). The pKe1 and pKe2 values of the
variants were almost the same as those of WT. The (kcat/Km)o values of N116D and
N116D/D150E were higher than those of WT both at 0 and at 4.0 M NaCl. The (kcat/Km)o value of D150E was higher than that of WT at 0 M NaCl, but was almost the
same at 4.0 M NaCl. Figure 4C shows the effects of pH on the relative activity at 4.0 M NaCl of WT and the variants in the hydrolysis of FAGLA. All the plots show bell-shaped curves with maximum activation at pH 7.5. The relative activities at 4.0 M NaCl at pH 6.0−9.0 were in the order WT > N116D > D150E, N116D/D150E.
NaCl-induced activation of TLN variants in ZDFM hydrolysis – ZDFM is a
precursor of the artificial sweetener aspartame. TLN catalyzes its formation from
N-carbobenzoxy-L-aspartic acid and L-phenylalanine methyl ester through reverse reaction of hydrolysis. Table 3 shows the kinetic parameters at 0 and 4.0 M NaCl of WT and the variants in the hydrolysis of ZDFM. The kcat value of WT increased from 5.3 to
39 s-1 while the Km value remained constant, in good accord with those reported