Vol 17, No 2 (1966)
A STUDY ON THE SHALLOW-MARINE
CULTURAL FACILITIES
W A T E R CAPACITY OF T H E CHANNEL CONSTRUCTED
A T TANOURA FACILITY, KAGAWA PREFECTURE
Kiyoshi
FUKUDA,
T a d a o MAEKAWA a n d Yoshihiro KONOIntrorduction
According to the results of our psactical research of the pisciculture facilities in Shikoku carried out in 1962 and 1963('), the inflow and outflow of the sea water is presently the most important problem to be solved at ths facilities.
The most important factor in pisciculture is to supply enough oxygen to the cultivating fish. At the shallow -marine pisciculture facilities, the oxygen is generally supply by replenishing fresh sea water and draining used sea water through the gates and t h e net- meshes of the facilities with the tide. Consequently, the degree of oxygen supplied to the facility depends upon the quantity of the sea water which flows in and out.
Because of the shortage of oxygen in the sea water at some of the facilities, there were several cases where all of the cultivating fishes died.
Channels or pipe lines were constructed through the side of the facilities to increase the inflow and outflow of the sea water to incsease the oxygen level in th.: sea water. Since then, there has been no report of the fishes dying in great numbers a t these facilities; although to what d e g ~ e e these structures have helped was unknown.
Consequently, we thought it was important to find out how much these structures actually contributed in increasing the amount of fresh sea water. With this objective, we carried out hydraulic observations on the flow of sea water coming through the channel constructed through the side of Tanoura Facility, Kagawa prefecture, during one spring tide and one nearp tide in August of 1963.
Methods
Tanoura Facility, a typical net and float type facility, was built a t Tanoura Bay facing the Gulf of Uchinomi, Shodo-Shima Island, Kagawa Prefecture in 1960.
The mouth of this bay is enclosed by a double netted wall with a number of floats. The length of this mouth is about 570m. In this enclosed water area, about 28.5X10⁴ "Hamachis" (The young of Serzola quznqueradiata) were cultivated in 1962.
As shown in FIG. 1, from the shape of the contour lines of the water depth, this facility is shallow on the east side and deep on the west side, and the maximum depth of about 20m is near the northwest side of the double netted wall. T o increase the inflow and outflow of the sea water, a concrete channel, 2 m in depth, 2 m in width, and 140m
Fig.. 1 Tanouxa facility..
A Observation Site. B : Channel 1. Conduit 2 Open Channel
(We were permited t o use this map with the courtesy of MI .Yukichi Kume.)
in length, was built on the southeast side of the facility. The first 50 m from t h e bay is an open channel and the rest is a conduit. This channel cmnects Tanoura Bay with the Sea of Har ima as shown in Fig. 1
.
At the mouth of the open channel, point A , the velocity of the sea watex running through this channel was measured by setting the current meter a t the depth of 6/10 or 2/10 and 8/10 depending on the water depth a t the time of measurementc2), and by counting t h e number of revolutions pex minute with a stop watch and a counter. The tidal level was also measured by a water meter set near point A .
This observation was done during one spring tide from 16 : 00 on August
5
to 16 : 00 on August 6, and i t was done during one nearp tide from 16 : 00 on August 12 t o 19 : 00 on August 13.Findings and discussion
The Water Area, the Water Volume and the Water Depth of the Facility
In Fig. 2, H-A curve shows t:he relationship between the water. depth (H) and the
V (103rn3)
Fig.. 2 H - A and H-V curves of Tanoura facility.
water area (A). H - V curve shows the relationship between the water depth and the water volume (V)
.
The water depth was measured from the water level to the bottom of the bay. These curves were taken from the contour lines on Fig. 1.From Fig. 2, A(water area) is about 185x 103rn2 at M. S . L. (Mean Sea Level) and V (water volume) is about 2,165
x
103rn3 a t M . S . L. According to the observation data on TABLE 1,
the tidal range of the facility is within+
I m and H-A and H - V lines are roughly linear as shown in Fig.2.Sea Water Volume of the Facilty
The sea level varies with tide, as shown in Fig. 3, and this is listed in column (2) of Table 1. The sea level is calculated from the M. S . L. (Mean Sea Level). When the sea level is 0.83 m below M. S . L . , the sea level is shown as -0.83 m. The water volume is obtained from Fig. 2 and it is listed in column (3) of the same table.
When the sea level is -0.83 m the water volume is 2 , 0 2 4 ~ 10am3, and when the sea level is 0.83m the water volume i s 2,324x1O3m9. The difference between the two is 300
x
103m3 which is AVlnc, the increased water vloume of the facility during flood tide. The increased water volume is listed in column (4) of Table 1. During spring tide, AVlnc varies from 89x 103m3 to 300X IO3m3; and during nearp tide from 110x 103m3 to 220x
103ms.Table 1 Water volume Date (1) (2) (3) (4) (5) (61 T H V AVinc AViiec (Aug '63)
(4
(1 03m3) (1 03m3) (103m3) Tide -0 83 0 83 -0 10 0 38 -0 80 (Total) 0 60 -0 05 0 59 -0 60 0 51 ('Total) Spring Tide 2024 2324 2149 2238 2029 Nearp Tide 2281 21 58 2268 2064 2264 - flood 175 ebb - flood 209 ebb 384 123 ebb - flood 204 ebb - flood 327 4 3 2 1 0 1 2 4 5 SPRING TIDE NEARP TIDEThe decreased water volume AVdec is listed in column (5) of Table 1. During spring
tide, A V d e c varies from 175x 103m3 to 209x IOSrnS; and during nearp tide from 123x 103m3
t o 204
x
10Sm3.Sea Water ~ u n n i n g ~ ~ ~ ~ ~ g ~ t h e
Chamel
and the Water Capacity of the ChannelThe upper figure on F i g . 3 shows the inflow and outflow of the sea water through the channel during the spring tide. The lower figure shows the inflow and outflow during t h e nearp tide. The abscissa is T , the observation time. The positive direction of the axis of ordinate indicates the quantity of inflow qin (m3/sec.) and the negative direction indicates the quantity of outflow qout (m3/sec.). The tidal level H (m) i s also shown on t h e same figure.
From this figure, sea water starts to flow out through this channel about 3 houls after t h e beginning of flood tide, and i t starts to flow in about 3 hours after the beginning of ebb tide. Coasequently, if the flood tide started at 12 : 00 the sea water would begin to flow out a t about 3 : 00 and it would flow out until1 about 9 : 00 which would be about 3 hours after the beginning of ebb tide which started a t about 6 : 00.
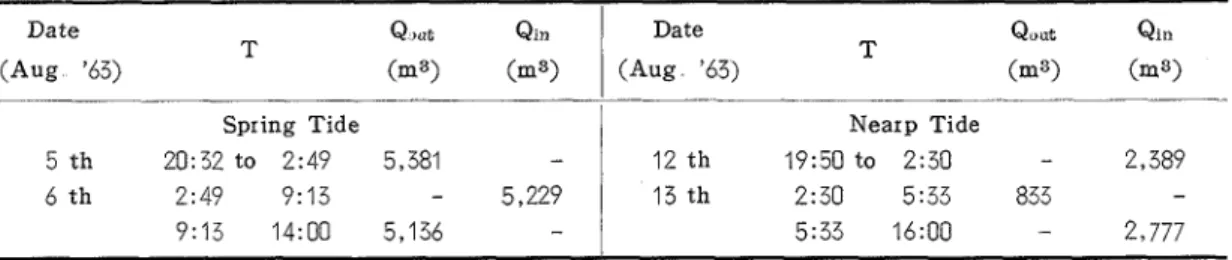
From Fig. 3 , the quantity of sea water through this channel was calculated and i t is listed in Table 2. During spring tide from 20 : 32 on t h e 5th to 2 : 49 on t h e 6 t h of
Table 2 The quantity of sea water running through the channel
Date
T Q ,OL T Qout Qin
(Aug '63) (m3>
i
( A ~ 6 3 ) (m3) (m3)August 1963, Qout 5,381 m3 of sea water. flowed out of t h e facility throngh t h e channel. From 2 : 49 to 9 : 13 on t h e 6 th of August, Qin 5 , 229 of sea water flowed into t h e facility. From 9 : 13 to 14 : 00 on the 6 t h , Qout 5,136m3 of sea water flowed out of t h e facility through the channel.
Thus, about 11 x loam3 of sea water flowed TabIe 3 VaIues A V and Q in and out during one spring tide. As for
Spring Tide
5 t h 20:32 to 2:49 5,381 -
6 t h 2:49 9:13 - 5,229
9:13 14:OO 5,136 -
nearp tide, about 5 x 1o3rn3 of sea water
Tide
n v
Q(1 03m3) (103ms) flowed in and out.
Nearp Tide
12 t h 19:50 to 2:30 - 2,389
13 th 2:30 5:33 833 -
5:33 16:OO - 2,777
Contribution of the Channel
In order to find out the actual contribution
N e a ~ p 318 5 5
of this channel, the quantity of sea water running through the channel: Q , was compared
with A V and the results are listed in Table 3 , where A V i s the mean value of AVi,,
and AVdec 01 A V = (AVinc
+
Avdec) /2, and Q = (Qin+
Qout) /2.From this table Q i s a small per cent of A V ; thus, this channel does not help very much in increasing the inflow andoutflow of the sea water of the facility.
With further investigation, we may be able to recommended a better channel site or other methods to increase the inflow and outflow of sea water.
Summary
In order to find out how much the channel contributed to the inflow and outflow of sea water, we measured the water flowing through the Tanoura Facility Channel and its tidal level during one spring tide and onk nearp tide. The findings of the observation are :
A) Facility
1) The sea water area of this facility i s 185X103m2, 2) the sea water volume i s 2 , 1 6 6 ~ 103m3, 3) the maximum depth is 20 m , 4) the amount and kind of fish cultivated i s
28.5
x
104 "Hamachis".B) Water Capacity of the Channel
I) Sea water starts to flow out through the channel about 3 hours after the beginning of flood tide and i t starts to flow in about 3 hours after the starts of ebb tide.
2) The quantity of the outflow through the channel during one spring tide is estimated as 11
x
103m8; the inflow during one nearp tide is estimated as 5x
103ms. On the other hand, during spring tide the water volume of the facility increased 389x 10SmS in flood tide, and decreased 384X103m3 in the ebb tide. During nearp tide the w a t e ~ volume increased 310x
103mQnd decreased 327 x 1 03m3.Because the quantity of sea water running through the channel is only a small pex cent
of the increased and decreased volume of the sea water in the facility, the channel does not help a great deal in exchanging the sea water of the facility.
Further investigation is needed to improve the sea water condition of the facility. Acknowledgements
The writers wish to thank Mr. Yukichi KUME, the director of Tanoura Facility, and his workers for their help to this work, Mr. Tsunekazu INOUE and Mr. Osamu KUNIKATA both former students of Kagawa University and Mrs. Chieko MATSUBARA a member of our laboratory for their assistances
.
References
(1) MAEKAWA T . , SAIIO M . , FUKUDA K , and Kagawa Univ , 16 147-162 (1965)
K o ~ o Y : A study on the shallow-marine cultu- ( 2 ) Rous H. : Engineering hydraulics, 222, New la1 facilities-On the p ~ e s e n t conditions of the York, John Willy & Sons Inc (1961)
facilities for pisciculture, Tec. Bull. Fac Agr
.
,Vol 17, No.. 2 (1966)
E
%G@%BD%%k$$7k%, X$kTE?$$%K&%-?b
t 1:t$,~ & & & K $ s b '
T a Q I E k C 1: T & 63 ,
t D ClsM, - & D & I a % & S P M ,
~ ~ P ~ $ M M , % ~ , @ H % B ~ I ~ ~ D & A
(%7k)
.
ZttlCBW)
R 2 7B h k L T b 6 L @ L ,
th$?-;KW333-C-f6:b>B&K, 7k%%i&jS
<
L T P ~ & ~ ~ E ~ : & L ~ ~ D & E B B % L ~ z
t 3 '947"
7 4 ~%g-;K-r, %.Bk7k~@Ba%Bl~
Tb\6%L42fi:&&.
C i h b D , Ulltlg .Bk7k&32;5;, E D
<
bb.%S@#O%
Bk7kK@Q
9 T b .675,
k8 % . Bk7kRE2%B#Sd&l
- d - a t & t t , s m ~ ~ + a % ~ ~ z a s ; h a .
CCK$saa>-c, 3 % k B M ,
E B D ? $ ~ % & ~ D % % @ ! K ~ & ~ S < S ~ L T L ~ ~ @ ~ ~ ~ % . B F ~ ~ @( % E 2 x 2 m ,
K E
140m)
.Bt7k8EhB,
1963q8ADkZg /J\%Kub\T, 2 4 R F d B E B 8 N B I L k .
;4.
D%R7
A@
./J\&Yl%S%L T, U@% .Bk7k@D%. BbkCM, %O 8x1041~1s
C & 9 k.t h l % L ,
R dr 3