Studies on Production and Flowering in Gladiolus
Kiyoshi Kosucr Contents Introduction 2 I Light 4 1 Effect of day-length 4 (1) Effect of day-length on flower bud diffe~entiation 4 Experiment 1 4 Experiment 2 5 (2) Effect of day-length on flower bud development 6 Experiment 3 6 Experiment 4 6 Experiment 5 7 (3) Critical day-length and optimum day-length 8Experiment 6 8 Experiment 7 8 (4) Effect of light break 10 Experiment 8 10 Experiment 9 11 (5) Critical intensity of supplementary lighting 12 Experiment 10 12 Experiment 11 13 (6) Effect of day-length and temperature 14 Experiment 12 14 Experiment 13 16 Experiment 14 19
(7) Effect of day-length on the formation of corm and cormel, and its relation to blindness 20
Experiment I5 20 Experiment 16 20 Experiment 17 2 1 (8) Effect of day-length on the content of auxin in flower buds 23 Experiment 18 23 (9) Effect of auxin and glbberellin spray on flowering 24 Experiment 19 24 2 Effect of light intensity 2 5 (1). Effect of defoliation 25 Experiment 20 25 (2) Effect of reduced light intensity 26 Experiment 21 26 Experiment 22 2 7 Experiment 23 29 I1 Nutrition and water 31 1. Effect of nutritional treatments 31 (1) Effect of nutritional treatments 3 1 Experiment 24 31 (2). Effect of nutritional treatments of the previous year 36 Experiment 25 36
Kiyoshi Kosuor
(3) Effect of nutritional treatments to the plants grown from cormel 4 1 Experiment 26 4 1 (4) Effect of nitrogen application on the content of auxin in flower buds 43 Experiment 27 43
2 Effect of soil moisture 46 (1) Effect of continuous dryness 46 Experiment 28 46 (2) Effect of alternation of dry and wet condition 48 Experiment 29 48 (3) Effect of time and duration of dryness 50 Experiment 30 50 I11 Variety and blindness 52 Experiment 31 52 Experiment 32 5 7
IV Anatomical observation 60 1 Observation on the blindness caused by insufficient light condition,
especially by day-length shortage 60
2 Observation on the blind plant caused by nutritional defficiency 60 3 Observation on blindness caused by dryness 6 1
Discussion 6 1
(1) Day-length and flower bud differentiation 6 1 (2). Day-length and flower bud development 61 (3) Light intensity and flower bud development 62 (4) Nutrition and blindness 62 (5) Soil moisture and blindness 63 (6) Variety and blindness 63 (7) High temperature treatment before planting and blindness 63
Conclusion 64
Summary 64
Literature cited 66
Gladiolus is one of the most popular cut flowers in summer. In recent years, year-round production of this plant increased in warmer regions in Japan on ac- count of its various forms, shapes and shades of flower and its strong habit of growth..
Gladiolus flowers well in summer, but not in winter in the northern States of United States, Canada, England, Holland and ,Japan. Blindness is common to gladi- olus plants when grown in winter in these countries. Considerable effort has been made by many workers to establish the best method of winter forcing. But the definitive best method has not been found yet.
LOOMIS and
EVANS'^^),
DENNY and his c o - ~ o r k e r s ( ~ - l ~ ) , TSUKAMOTO and his co- WOrkeTS(46, 4 7 4 9 , 5 0 , 5 1 , 5 2 , 5 3 ) and APIE(''~) studied about dormancy of gladiolus corms,and they reported the methods of hastening the sprouting of corms.. They, however, could not be able to reduce the percentage of blindness in winter.
D E N N Y ' ~ ) found a high percentage of blindness among gladiolus plants which were forced in a greenhouse in winter after breaking their dormancy by treatment with ethylene chlorhydrin vapor.. He concluded that the blindness was not caused
Studies on production and flowering in gladiolus 3
by the chemical treatment but by insufficient light conditions in the greenhouse in winter. Lengthning the day-length with supplementary lighting, WEINARD and DECKER(^^) were able to decrease the percentage of blindness and increase the pro. duction of early planted gladiolus in a greenhouse. GILBERT and P E M B E R ' ~ ~ ) proved the relationship between the blindness and light by means of lighting and shading the gladiolus LAURIE and P O E S $ I ( ~ ~ ) found varietal differences in the response to light. They reported that only three of the eight varieties tested responded well to light.
On the other hand, LOOMIS and
EVANS'^^), FAIR BURN(^^),
and LAURI~ZEN and WRIGHT(33) found that high temperature treatment before planting is effective in hastening
flowering, lengthening the spikes and increasing florets. EMSWELLER and TAVERNETTI
(I4) reported effectiveness of heating the soil with electricity in the early stages of
growth
POST(^') described that the blindness is common to gladiolus plants from August to February, and recommended the following treatments for growing gladiolus in the northern States of America.
(1) Plant not earlier than February 1, to avoid low light intensity and short days.
(2). Treat the corms a t 80°F for one month, or a t 102°F for one week, before planting
( 3 ) . Plant a s far apart a s is economically possible, and preferably not closer
than 4 by 6 inches.
(4) Grow a t a night temperature of 50°F during cloudy weather and 55 to 60°F during bright weather.
Generally the use of artificial light is not profitable: but, if artificial light is used, the most logical time for its application is starting when the top of the plant is about 3 inches high, and continuing to April 1.
R U N G E R ' ~ ~ ) stated that high light intensity is necessary for developing flower buds of gladiolus, and if light intensity is too low to develop flower buds, growing points or young spikes of the plants would die This is the case of blindness When light intensity is low and night temperature is high, blindness occurs a t higher per- centage The effect of short day resembles that of low light intensity Day.length, however, plays only a subordinate role in the formation of flower
PARKER and BORTHWICK(~~) state that the light break a t midnight with 30 f c. for
30 minutes to 1-30 hours is useful1 to decrease the percentage of blindness.
APTE'~) described that there exists a possibility of finding a variety which will flower under remarkable low light condition without the aid of artificial light,
YASUDA(~') found that dryness of soil and nutritional deficiency also cause the blindness.
TSUKAMOTO and YOKOI(~*) proved the importance of nitrogen, l ~ k e that of day- length, for development of flower buds in gladiolus.
In order to clarify these problems and to decrease the percentage of blindness in winter forcing, the author has been working a t Agricultural Institute of Yokohama
4 Kiyoshi KOSUGI
National University and later a t Faculty of Agriculture of Kagawa University since 1950 T h e results obtained in these works were reported on Technical Bulletins of the Kagawa Agricultural College, Technical Bulletins of Agriculture, Kagawa Uni- versity, and Journals of the Japanese Society for Horticultural Science. This report dealt with these published results and unpublished, including problems of corm and cor mels production in relation to flowering
Acknowledgements
T h e author wishes to express his heartfelt thanks to Prof. Dr. Yotaro TSUKAMOTO of Kyoto University for his kind valuable advices through all the course of the study for about 10 years.
Sincere thanks are due to Prof.. Dr. Akira KOBAYASHI of Kyoto University, Dr. Taiji KUROKAMI, former Dean of Faculty of Agriculture, Kagawa University, Prof. Dr. Tsuneo EGUCHI of Nippon University, Prof. Hachiro HOSAKA of Chiba Univer- sity, and Prof. Dr. Tadayoshi SUGIYAMA of Tokyo University, for their kindness and advices for the present study.
Many thanks are also due to Prof. Dr. Tadao MAEKAWA, Dean of Faculty of Ag- riculture, Kagawa University and Dr. Bungo MIYAZAWA, for their encouragements. It is also a pleasure to record here the helpful assistance given by Assistant Prof. Kunio KANO and Mr. Tadashi ASAHIRA, both of Kyoto University, Mr. Masaru KONDO of Kagawa Agricultural Experiment Station, and Mr. Yasushi SANO and Mr. Akitoshi SUMITOMO, both of this laboratory.
I. Light
1. Effect of day-length
(1). Effect of day-length on flower bud differentiation Experiment 1 ( 1 9 )
(Experiment of short day treatment in long day condition before flower bud differentiation..)
Materials and methods
Corms of Hector variety were planted in the flat on April 17, 1951, and the short day treatment was given to one half of them from April 20, shading with straw- mats from 5 p.m. to 9 a m. every day, the other half were grown under natural long day condition.
Sampling was made on May 15 from each plot. The sampled materials a r e stor- ed in 70% alcohol, and observed for the stages of flower bud development with binocular by scale stripping method.
Results T h e results obtained are shown in table 1.
Studies on production and flowering in gladiolus
Table 1 -Effects of short day treatment on the flower bud differentiation in gladiolus (Var Hector, 1951)
INo
of plants/ Average Number of Stages of flower development** Treatment*1
examined height of foliage I1
plant1
leaves1
111 I I ~I
III*
L : long day (natural day length), S : short day (9 hours)**
IIa, IIb: spike formation stage (IIa: the vegetative point broadens and rises in preparation of the flower formation, IIb: in the axil of the lowermost bract the flower-vegetation-point may be clearly distinguished ), 111: first floret differentiation stageFrom the table, it seems that the short day treatment did not affect the flower bud differentiation..
Experiment 2 (Experiment in a dark room.)
Materials and methods
Corms of Spotlight variety, 30g in weight, were treated with 30°C for one week, and then allowed to sprout in an incubator a t 25°C. They were planted in Wagner's pots with sand on January 30, 1961, and grown in a dark room of 18°C.
Sampling was made on March 27, 8 weeks after planting. The materials were stored in 70% alcohol, and observed for the stages of flower bud development with binocular by scale stripping method,.
Results
The results obtained are shown in plate 1 and table 2.
Table 2 -Stages of flower bud development in gladiolus grown under continuous dark condition..
(Var . Spotlight, 1960) ~ -I
iment.+
/
No of plantd Height of Number of/
Length of Stages of flower development**1 examined plant leaves flower stalk I
/
IIa/
IIb/
111*
A: planted on January 30, 1961 and observed on March 27, 56 days after planting B:planted on February 6 and observed on May 17, 100 days after planting On the time of ob- servation, all buds were blind
** I : undifferentiation stage, IIa, IIb: spike differentiation stage, 111: first floret differentiation stage
From these plate and table, it is clear that the flower bud differentiation occurs without light.
Kiyoshi K o s u o ~
(2). Effect of day-length on flower bud development Experiment 3(19)
(Experiment of short day treatment under long day condition.) Materials and methods
Corms of Hector variety were planted in the flat on April 17, 1951. To one half of them, short day treatment was given from April 20. The other half were grown under natural condition.
On May 15, the time of flower bud differentiation, one half of plants in each plot were shifted from long day to short day, while the other half short day to long day. The treatment was continued to July 20.
Results The results obtained are shown in table 3.
By short day treatment after flower bud differentiation, the percentage of blind- ness increased a little, nevertheless it did not increase by the short day treatment before flower bud differentiation
Table 3 -Effects of short day and long day treatments before and after Boner bud initiation on the flowering in gladiolus
(Var Hector, 1951)
Average date Height of Number of Number of Percentage Percentage ment*
1
$ant1
leaves floretslof
floweringObE$d
Experiment 4(19)
(Experiment of supplementary lighting under short day condition.)
July,17 9 3 ? 1 1 6
L S July, 10
1
78 7 11 4 S L July, 17/
94 3 11 4 S S l 92 July, 9 8 2 1 1 1 6-
Materials and methods
% 1 % 10 1
'
89 7I
l o 3 8 9 i 7 4 7 1 2 5 3 1 0 0 I 9 5 9 4 1 8 2 1 I 81 5 18 5 -.Corms of Kundard White variety, which were sprouted in a 18°C cell after a low temperature treatment a t 3°C for one month, were planted on September 29, 1951 in the flat and were grown outdoors.
On October 20, they were carried into a greenhouse, and one half of them were lighted supplementally all night with a 100 W incandescent lamp per 3 . 3 m2 from one meter above. The other half were not treated.,
From December 1, the greenhouse was covered with straw-mats from 5 p.m. to 9 a,m. and heated by electric cable every night.
Studies on production and flowering in gladiolus
Results The results obtained are shown in table 4.
Table 4 -Effects of lighting on the flowering of gladiolus during autumn and winter season (Var. Kundard White)
No of Average date Height of Number of Number of Percentage
Pygg:r
1
e e d1
of o w e r i n g1
plant foliage florets of flowering1
plant 116 gCm 8 2 8 6 100.0% 0 %S Jan. 13 8 4 . 3
1
5 11
1.5 6 7 1 9 3 3*
L : long day, S: short day..From this table, it is clear that the supplementary lighting in winter increases the percentage of flowering in this variety.
Experiment 5(19)
(Experiment of short day treatment under long day condition.)
In this experiment, considerations on the varietal differences in the response to light and shading materials were taken.
Materials and methods
Corms of Kundard White and Hector varieties were planted in the flat on April 17, 1952, and grown in a glass house.
In short day plot, shading with black vinyl film was made from 5 p.m. to 8 a.m. every day for 77 days from April 29 to July 15.
Results The results obtained are shown in table 5.
Table 5 -Effects of short day treatment on the flowering of gladiolus during spring and summer season
(Vars Hector and Kundard White, 1952)
Treat- ment* S D Cont No of plants examined
Height of Number of Number of Percentage
Pygg:r
plantifoliage
leave{ floretsi
of flowering1
plantI
I
11
Kundari White S D 55 1 June, 281
105 5 7 8 I 0 5 5 94 5 Cont 571
J u l y , 6 1 1 0 6 7 91
9 1,
50 9 49 1 --x S D: short day, Cont: control
From this table, it is definite that short day treatment increases the percentage of blindness, and varietal difference in the response to light exist.
8 Kiyoshi Kosuor
Table 6 -Stages of flower bud development in blind plant
--
I
Stages of flower development**
I
1
Ira I I ~1
IIIi
IV1
v
VI-VII Hector22
White
*
S D: short day, L D: long day**
I : undifferentiation stage, IIa, IIb: spike formation stage, 111: first floret differentiation stage, IV: stamen formation stage, V : pistil formationstage, VI: ovule formation stage, VII: pol- len formation stageFrom this table, it is observed that the flower buds of blind plants in the short day plot are aborted a t the stages before pollen and ovule formation, but in the long day plot, the stages aborted are not always the same a s those in the short day plot.
(3) Critical day-length and optimum day-length
Experiment 6(27)
(Experiment of March to September, 1956.) Materials and methods
Corms of Picardy, Purple Supreme, Radiance, Spotlight and Vaieria varieties were planted in an experimental farm of Kagawa University on March 16, 1956, and the following treatments were made from May 8.
Plot 1 2 3 4 5
Day-length 8 h r . 10 12 14 16
Natural day-length 8 h r . 8 8 8 8
Supplementally lighting 0 hr. 2 4 6 8
Shading was made to all plots from 5 p..m. to 9 a.m. every day with black vinyl film, and lighting was made with lOOW incandescent lamp for 0, 2, 4, 6 and 8 hours according to the plot by time switch.
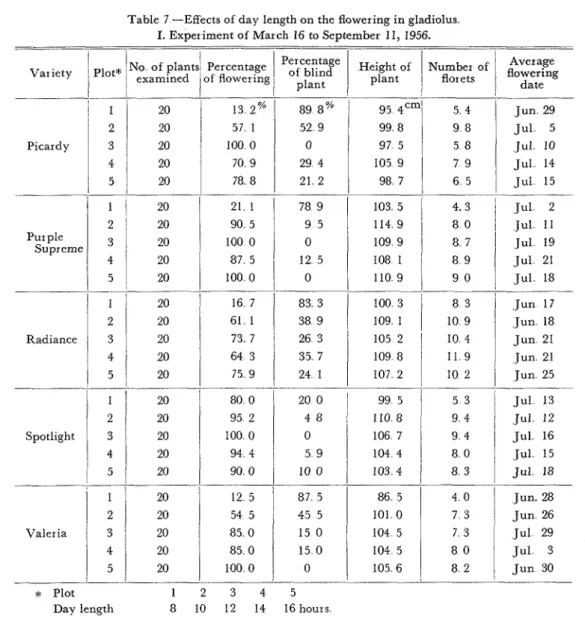
Results The results obtained are shown in table 7.
From this table, it may be said that optimum day-length for flowering of each variety is a s follows: Picardy: 12 hours, Spotlight: 12 hours, Purple Supreme: 12 and 16 hours, Radiance: 16 hours, and Valeria: 16 hours.
Experiment 7(2 7,
(Experiment of August, 1956 to January, 1957.) Materials and methods
Studies on production and flowering in gladiolus 9
x Plot 1 2 3 4 5 Day length 8 10 12 14 16hours
Table 7 --Effects of day length on the flowering in gladiolus I. Experiment of March 16 to September 11, 1956.
- --
I
1
]No of plants PercentageI
Percentage Height of Number of Average Variety I 'lot* examined of flowering plantI
O' "lnd1
plant florets " E n gI
1
Corms of Picardy, Purple Supreme, Spotlight, and Valeria varieties were stored in a refrigerator a t 5°C from April 9 to August 14, 1956. Then they were planted in the experimental farm of Kagawa University on August 20..
Treatments were made with the same methods as that of the experiment 6, from September 21 to the day of the corm lifting.
20
1
13 2% 201
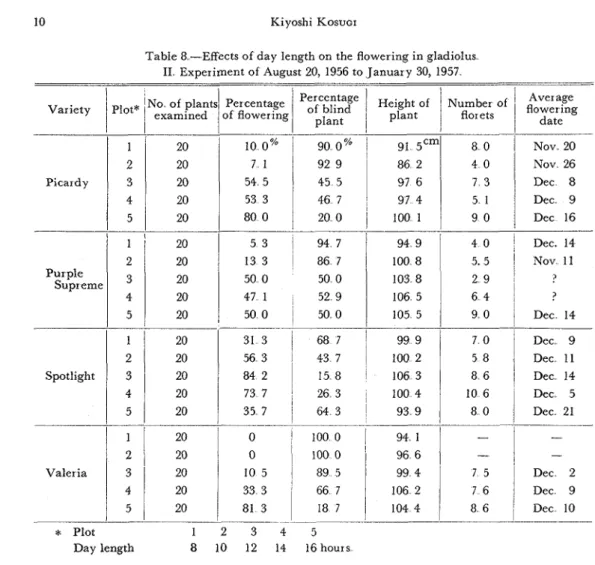
5 7 1 Picardy 100 0Results The results obtained are shown in table 8.
This table shows that the optimum day-length for each variety is a s follows: Picardy: 16 hours, Purple Supreme: 12 and 16 hours, Spotlight: 12 hours, and Valeria: 16 hours. 89 8 % 52 9 0 20 70 9 29 4 7 8 8
1
2 1 2 J u n 29 Jul 5 Jul 10 5 4 99 8 8 954cmi
Jul 14 Jul 15 97 5 105 9 98 7 5 8 7 9 6 5 Purple 1i
20 20 21 1 90 51
4.3 J U ~ 2 78 9I
i;i
9 5 8 0 Jul 11 Supreme2 1
3 20 100 0 0 Jul 19 87 5 12 5 5 1 0 0 01
0 ---- 110 9 9 0 Jul 21 Jul 18 Jun 17 J u n 18 J u n 21 J u n 21 J u n 25: I
20 20 73. 7 20 64 3 75 9 -- -. 83 3 100 3 8 3 38 91
109 1/
10 9 26 3 35 7 24 1 1 I 20 80 0 95 2 100 0 20 94 4 90 0 105 2 10 4 1 0 9 8 1 1 9 107 2 10 2 20 01
99 5 110 8 0 1 0 6 7 4 8 5 9 104 4 -- 5 3 Jul 13 9 4 Jul 12 9 4I
JuI 16 8 0 Jul 15 12 5 54 5 85 0 85 0 100 0 20 20 20 20 20 -- Valeria 1 0 0 1 0 3 4/
8 3/
Jul 18 1 2 3 4 5 87 5 45 5 15 0 15 0 0 86 5 101 0 104 5 104 5 105 6 4 0 Jun. 28 J u n 26 7 3 Jul 29 8 01
Jul 3 8 21
Jun 3010 Kiyoshi KOSUGI
Table 8 -Effects of day length on the flowering in gladiolus
I1 Experiment of August 20, 1956 to January 30, 1957
I
No of plants Percentage P~~~~~~ Height of Number of
'
Averageexamined
1
of flowering/
plantI
plant florets f l O ~ ~ ~ ~ n g2 Picardy 3 4 5 2 20 Purple Supr erne 3 20 4 20 5 20 1 20 20 Spotlight
1
1
20 86 2 4 0 Nov 26 97 6 7 3 Dec 8 97 4 5 1 Dec 9 100 1 9 0 Dec 16 9 4 91
4 0!
Dec.14 Nov. 11 ? ? Dee. 14 Dec 9 Dec 11 Dec 14 Dec. 5 Dec 21 2/
20 0 Valer ia 3 5/
20 81 3 --- - - x Plot 1 2 3 4 Day length 8 10 12 14 89 5 9 9 4I
7 5 Dec 2 66 7 106 2 7 61
Dec 9 18 7 1 0 4 41
8 6 Dec 10 - -. 5 16 hoursSeasonal changes of the flowering percentage and the optimum day-length were observed.
In Valeria variety, no flowering was observed in 10 and 8 hours plots. So, i t may be said that the minimum critical day-length in this variety exists between
12 and 16 hours.
(4). Effect of light break
Experiment 8
(Experiment of March to August, 1960.)
Corms of Spotlight variety were planted in the experimental farm of Kagawa University on March 13, 1960, and the following treatments were made from May 1 3 to June 20, 1960, for 38 days.
Plot : Control (8 hours day-length). Light break for 1 hour.. Light break for 2 hours. Light break for 4 hours..
Studies on production and flowering in gladiolus 1 I
Shading was made to all plots from 4-30 p.m. to 8-30 a.m. every day with black vin j l film. Lighting was made with 100 W incandescent lamp from 11 p.m. for 1 , 2 and 4 hours according to the plots.
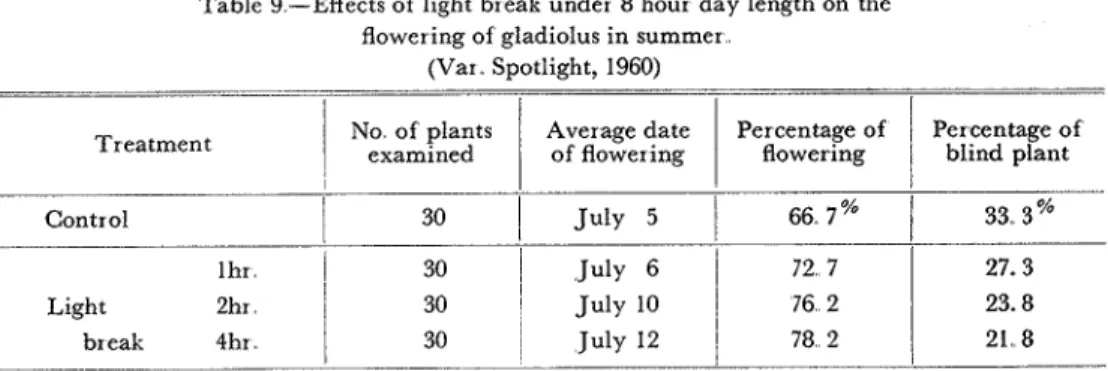
Results The results obtained are shown in table 9..
Table 9.-Effects of light break under 8 hour day length on the flowering of gladiolus in summer
(Var Spotlight, 1960)
-
-I I I I
!
No of plants Average date Percentage of Percentage of Treatment examined of flowering flowering blind plantControl
/
66 7 %i
33 3 %lhr
/
301
July 6 27. 3I
Light 2hr 1 30 I July 10
1
7 2 7 76 21
23.8break 4hr.
1
30 July 12 78. 21
21.8This table shows that the percentage of flowering increased with increasing amount of lighting.
Experiment 9
(Experiment of August, 1960 to January, 1961.) Materials and methods
Corms (5-log) of Spotlight variety were stored in a refrigetator. a t 5°C from March 20 to August 18, 1960, and then planted in the bench with sand in a green- house..
Treatments were made in the following procedure from September 28 to Decem- ber 20, 1960.
Plot : Control (8 hours day-length).. Light break 30 minutes. Light break 1 hour. Light break 2 hours.
Shading was made to all plots from 5 p.m. to 9 a.m. every day with black vinyl film.. Lighting was made with lOOW incandescent lamp from 11 p..m.. for 30 min- utes, 1 and 2 hours according to the plots.
Results The results obtained are shown in table 10.
This table shows that the light break decreased the percentage of blind plant, especially in 2 hours light break plot.
Table 11 shows that the fresh weight of tops in flowered plants is heavier than that of blind plants, although the opposite is observed on the fresh weight of new
Kiyoshi KOSUGI
Table 10 -Effects of light break under 8 hour day length on the flowering of gladiolus during winter season
(Var Spotlight, 1960)
-
Percentage Average Average IAverage date Percentage Percentage
/
of u n d i f i r -1
length of1
length of Treatment of flowering of floweringI
0bPa2d
entiated blind stem blind spike-
I
I
plantControl
/
-
1
0 %1
89 7%1
10 3 %1
3 lCmI
0 SCrnTable 11 -Effects of light break under 8 hour day length on the fresh weight of top and corm. (Var. Spotlight, Dec 20, 1960)
I I I I
Light 30min 1 Dec 10 1 5 8
'
7 8 9 5 3 11 8 break lhr 01
8 3 31
1;;1
4 1 -I
2hr1
Dec 30 64 81
29 7 24 3 Treatment1
1 4 0 5 2 5Total fresh Fresh weight Fresh weight weight of top of new corm
Control
I
Blind plant/
44 ggrn/
17. 5gm/
18 ggmcorms. The total weight of flowered plants is, however, heavier than that of blind plants. 30min 30min Light 1 hour break 2hour 2hour
(5). Effective intensity of supplementary lighting
Flowered plant Blind plant Blind plant Flowered plant Blind plant Experiment 10
(Experiment of March to ,July, 1960.) Materials armd methods
Corms (9-16g) of Spotlight variety were planted in the experimental farm of Kagawa University on March 13, 1960, and treatment was made from May 13 to June 20, 1960. Shading was made to all plants from 4-30 p.m. to 8-.30 a.m. every day with black vinyl film.. Lighting was made all night with a 100 W incandescent lamp, 1.2m above the ground..
Results The results obtained are shown in table 12.
This table shows that no differences due to the distance from light were observ- ed in the percentage of flowering, but some delaying in the average date of flower- ing was observed on the plants near the light. It may be the effect of lighting. From the results, it may be said that the effective distance from light is about two
Studies on production and flowering in gladiolus
Table 12 -Effects of supplementary lighting with incandescent light upon the flowering of gladiolus during summer season
(Var Spotlight, 1960)
Distance from light
meters (19 lux).
Experiment 11
(Experiment of August, 1960 to January, 1961.)
Light intensity July 11 J u l y 9 July 11 J u l y 8 J u l y 4 July 4 July 3 J u l y 4 lux 50 325 100 100 150 4 1 200
~
19 250 16 300 10 3 50 6 4001
4Materials and methods
Percentage of
i
Average date flowering of floweringNatural day length was restricted to 8 hours, and the supplementary lighting was made the remainder of 16 hours % 75 66 54 93 100 79 100 65
Corms (5-log) of Spotlight variety were stored in a refrigerator a t 5°C from March 20 to August 18, 1960, and then planted in the bench with sand in a green- house.
Treatment was made from September 28 to December 21, 1960. Shading was made to all plants from 5 p.m.. to 9 a..m. with black vinyl film every day, and light- ing for all night was made by a 40 W. incandescent lamp 85 cm above the soil.
Table 13 --Effects of supplementary lighting with incandescent light upon the flowering of gladiolus during winter season
(Var Spotlight, 1960-61)
i I I
Distance from
1
Light intensity Percentage of Average date light floweringI
of flowering cm 20 60 100 140 180 220 260 300Natural day length was restricted to 8 hours, and the supplementary lighting was made the remainder of 16 hours % I 700 50 1 January 14 lux 61 168 I January 7 40 23
1
~ a n u a r y 2 18 8 4 2 0 0 0 0 0 - - --
0I
-
14 Kiyoshi Kosuo~
Table 14 -Effects of supplementary lighting with incandescent light upon the length of stem and spike in blind plant of gladiolus during winter season
-
-I I I
Distance from Light intensity Length of stem Length of spike light in blind plant in blind plant
Nutritional solution containing 100 ppm N, 50 ppm P and 50 ppm K was applied once a week after sprouting.
Results The results obtained are shown in table 13.
This table shows that the effect of light is observed clearly a t the spot one meter (40 lux) from light..
Table 14 shows the results almost the same a s the results shown in table 13. (6). Effect of day-length and temperature
Experiment 12(20)
(Experiment of September, 1952 to January, 1953.) Materials and Methods
Corms of Hector variety were stored in a refrigerator a t 3°C from April 10 to September 8, 1952.. Then they were divided into 4 plots: high temperature long day, high temperature short day, low temperature long day and low temperature short day.
On September 10, these corms were planted in the flat and grown outdoor. Then they were carried into two vinyl houses on October 10, and the treatments were begun according to the plots. High temperature plots were heated by electric ca- ble, and low temperature plots were cooled by opening the windows. Long day plots were lighted all night with 100 W incandescent lamps 60 cm above the plants. Short day plots were shaded with black vinyl film from 5 p.m. to 8 a.m.. every day. Samplings were made every 10 days from October 10, and the buds were stored in 70% alcohol. Microscopical examinations were made with binocular by the stripping scale method..
Low temperature plots were transferred to the high temperature vinyl house on December 19, and the same treatment was continued to know the flowering ability.
Studies on production and flowering in gladiolus
Results
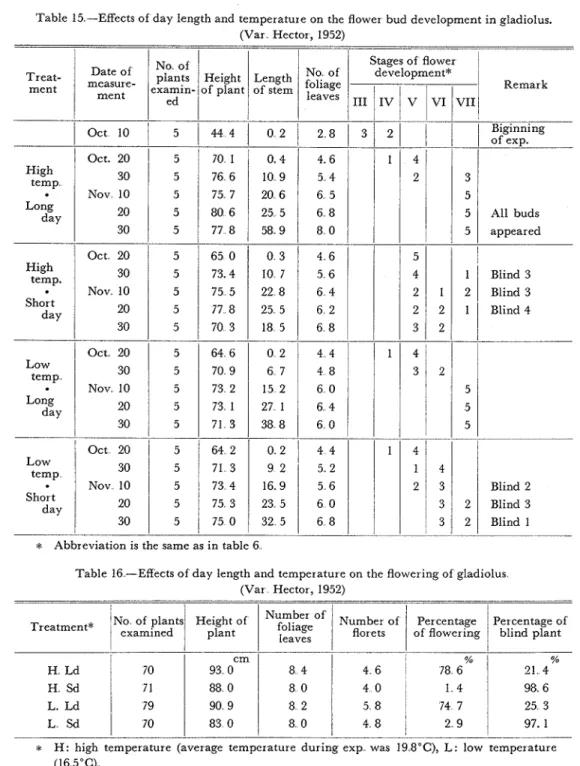
The results obtained are shown in tables 15 and 16.
Table 15 shows that the flower buds under long day condition, both in high tem-
Table 15 -Effects of day length and temperature on the flower bud development in gladiolus. (Var Hector, 1952) Treat- ment Date of measure- ment Oct. 20 High temp Long 20 5 80 6 25 5
dayI
30 5 / 7 7 8 1 5 8 " 9 High temp. Short day Oct. 20 30 Nov. 10 20 30 Low temp. Long day Low temp Short day Oct 20 30 Nov 10 20 30 Oct 20 30 Nov 10 20 30*
Abbreviation is the same as in table 6Biginning 5 4 No of foliage leaves 6 5 5 6 8 8 0 5 appeared Stages of flower
1
development*1
Remark I11I
IV1
V V 1 / VII1
Table 16 -Effects of day length and temperature on the flowering of gladiolus (Var Hector, 1952)
Height of of Number of Percentage Percentage of Treatment*
N~x&!d:d"tsl
plant1
leaves1
florets/
of flowering1
blind plantI I I I I L. Ld 79 cm 93 0 88 0 90 9 8 4 8 0 8 2
% I
9 8 6 I % 4 6 7 8 6 21 4 4 0 I 1 4 5 8 1 7 4 7 1 2 5 3 L Sd 70*
H : high temperature (average temperature during exp was 19 8"C), L : low temperature (16 5°C)Ld: long day (24 hour day length), Sd: short day (9 hour day length)
16 Kiyoshi KOSUGI
perature and in low temperature, were developed normally, but under short day condition, flower buds began to abort from 20 days in high temperature and 30 days in low temperature after the treatments were started.
Table 16 shows that no differences were observed on the height of plant, number of leaves, number of florets, percentage of flowering and percentage of blind plant between high temperature plots and low temperature plots, nevertheress, differences were observed on the percentage of flowering and percentage of blind plant be- tween long day plots and short day plots..
Experiment 13
(Experiment of November, 1959 to April, 1960) Materials and Methods
Corms of Atom, Purple Supreme and Spotlight varieties were stored in a refrig- erator a t 5°C from March 20 to November 25, 1959. Then they were divided into high temperature plot and low temperature plot. Each group was divided into 5 plots; 8, 10, 12, 14 and 24 hours day-length plot.
On November 28, all corms were planted in the bench with sand in two experi- mental greenhouses The temperature was kept high in one by heating with elec- tric cable and low in the other.
Treatment was started on December 22 according to the plots. Shading with black vinyl film was made to all plots from 5 p.m. for 0, 2,4, 6 and 16 hours every day.
Nutritional solution containing 100 ppm N, 50 ppm P and 50 ppm K was applied every week after buds sprouted.
Results
The results obtained are shown in table 17, figs. 1 and 2.
Table 17 -Effects of day length and temperature on the average date of flowering in gladiolus (1960)
-- - -- - -
Treatment
1
Varieties --Temperature
1
Day length1
AtomI
Spotlight/
Purple SupremeI 14 -
/
Apr 25j
Apr 28 High***
Maximum mean temperature: 25 3"C, minimum mean temperature : 7 6 ° C Mar 24 Mar 26 - Mar 11 Mar 10 14 - 12 24hrsI
Mar 5 10 Mar 4 81
Mar 14 Low** 12 1 A p r 1 3 101
A p r 1 2 81
Apr 14 1 - -Apr 4 Apr 8 - .- Apr 16 Apr 23 Apr 16 Apr 13 -1
-Studies on production and flowering in gladiolus ,o ,j+%
"-
A t o m&,I
a0G O -
<, v,/'*
40-
?O-
%Percenta9e
o f
b lloo
-
2 0 Low temp Number o f.florets
Fig. 1. Effects of day length and temperature on the percentage of flowering, blind and undifferentiated plant and number of florets in gladiolus
, ID 1 0 - p - - - 4 , r ~ ' / I I I
4
-
>-
L I I I I I / II
,
8
10 1 2 1424
hr8 10 12 142 4 h r
8
10 12 14 2 4 h rDay
l e n f t hD a y
Lenqth
Day
Len@
h18 Kiyoshi Kosuor
Heiyht of f l o w e r e d p l a n t
-I
,.-.I,.-
L ~ t
Purple Supreme
Height o f
u.nf
,-' L O W
t e m p
Number of leaves, f l o w e r e d .
plant
*--*.---#v
8 10 12 14 24hr.8 10 12 14 24hr 8 10
Day
len$th
Ddy L e n y t h D a y l e n y t hFig 2 Effects of d a y length and temperature on the height of plant, number of leaves and length of stalk with blind flower in gladiolus
Table 17 shows that earlier flowering was observed in high temperature plots than in low temperature plots and in short day plots than in long day plots.
Fig. 1 shows the following results.
Studies on production and flowering in gladiolus 19
in high temperature plots, especially in shorter day-length, although varietal dif- ferences were observed.
(2). Percentage of blind plant was high in less flowering plots.
( 3 ) There was no difference in percentage of undifferentiated plant among the plots.
( 4 ) On the number of florets, similar tendency to the flowering was obtained. Fig.. 2 shows the following results.
(1). The plants in high temperature plots were taller than those in low tempe- rature plots.
(2). No differences were observed in the number of leaves.
(3). No differences were observed in the stem length of blind plants in Purple Supreme and Spotlight varieties, except Atom variety in which longer stems were observed in high temperature of 24 hours day-length plot.
Experiment 14
(Experiment of November, 1959 to May, 1960..)
For the reference to practical cultivation, this experiment was conducted. Materials and methods
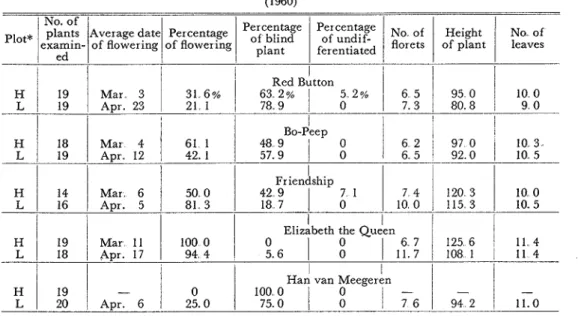
Varieties used were Friendship, Bo-peep, Han van Meegeren, Red Botton, and Elizabeth the Queen. Corms of these varieties were divided into two plots. One was high temperature plot and the other was low temperature plot.
On November 30, 1959, corms were planted in the bench with sand in two ex- perimental greenhouses. The temperature was kept high in one and cool in the other.
Table 18.-Effects of temperature on the flowering of some varieties forced during winter (1960)
No. of
plants Average date Percentage Percentage Percentage No of Height No of 'lot*
1
examin- ed of flowering1
of flowering1
":"::o f d florets of plant1
leavesApr. 23
I
7 1 1 8 7
1
0I I
1
Elizabeth the QueenH 19 Mar 11 1 0 0 0 125 6 I 1 1 4 L
1
18 A p r . 1 71
9 4 41
g . 61
1 7 . :I
I 0 8 1 1 1 4I
1 I Han van ~ e e ~ e r k n 0:t
A1
25.01
I00 75.0 0 0 0 7 6 9;2 1 7 020 Kiyoshi KOSWGI
After the buds sprouted, nutritional solution containing 100 ppm N, 50 ppm P and 50 ppm K was applied every week and weaker buds were removed leaving a strong bud on each corm.
Results The results obtained are shown in table 18. This table shows that:
(1). About one month earlier flowering was obtained in the plants of high tem- perature plot than in the plants of low temperature plot.
(2). No differences were observed in the percentage of flowering and number of leaves.
(3). Varietal differences were observed.
(4). More florets were observed in low temperature plot than in high tempera- ture plot.
(5). The plants in high temperature plot were taller than those in low tempera. ture plot.
(7). Effect of day-length on the formation of corm and cormel,
and the relation to blindness.
Experiment 15. (March to September., 1956)~'~) Experiment 16. (August, 1956 to January, 1957.)~'~)
Materials and methods (see the experiments 6 and 7.)
Results
The results concerning the formation of corm and cormel were shown in figs. 3,
t i i z i ; ; i2i:i i i i i i i i i i i
Studies on production and flowering in gladiolus
-2nd EXP
6%.
"'I
Variety Picardy Purple Radianco Spotlight Valeria
Supreme
Fig 4 Weight of new corms Plot 1 2 3 4 5 Day length 8 10 12 14 16hr..
Variety Picardy Purple Radiance Spotlight Valeria
Supreme
Fig 5 Number of cormels per plant
2 P,
i
z B 2 5 2' 5 1 2 3 ; ; Variety Picardy 1st EXP!I/
n ieSibPurple Radiance Spotltght i 2 3 4 k i 2 i j ? W Valeria
Supreme
Fig. 6. Total weight of'cormels per plant.
-
2 ?. g 1st EXP (Spnngf 2 a n ~& + r n A ~ ~ p'ota 1 2 3 4 5 1 2 3 4 5 1 2 3 4 5 1 2 3 4 5 1 2 3 4 5Varioty Picardy Purple Radiance Spotlight Valeria
Supreme
Fig. 7 . Weight of' cormel
4, 5, 6 and 7.
These figures show differences in the formation of cormels, but not in the corms in the plants grown under different day-length.
Experiment 17.
22 Kiyoshi Kosuor
Materials and methods
Corms of Spic and Span variety were stored in a refrigerator a t 5°C from the end of March to August 20, 1956, and planted in the experimental farm of Kagawa University.
Samplings were made every two weeks from September 17, 1956, and new corms were measured.
On the other hand, corms of the same variety were planted in the farm on March 21, 1957.
Samplings were made every two weeks from May 20, 1957, and new corms were measured.
Results
The results obtained are shown in table 19 and fig. 8.,
May
June
Jllly Au%Sept.
17 1 15 29 12 26 10 24 7
Sept. Oct. Nov Dec Jan.
Fig 8 Effects of planting time on the growth of new corm of gladiolus (var Spic and Span) Flowering percentage was 95% in spring and 30% in autumn
Table 19 -Effects of planting time on the yield of new corm and cormels (Var Spic and Span, 1956-57)
--
Table 19 shows t h a t :
(1). No difference was observed in the height of plant between the plants sown
Time of No of plants Percentage Height of New Corm planting
1
mother cormI
examined of flowering1
1
p a n tNo
1
92,
-.
in spring and in autumn..
(2). T h e flowering percentage of the plants sown in autumn was half of that in spring.
(3). Almost the same number of new corms were obtained in both plots, but the
Cor me1 No. Weight Spring Autumn 17 5gm
/
19 93 4Cm 34 615 4gm 18 1 3 8gm 1 7 7~
15/
501
9 0 3 2 61
if337 8 1 1 2 -Studies on production and flowering in gladiolus 23
total weight of new corms in spring sown plants was heavier than that of autumn sown plants.
Fig.. 8 shows that the growth of new corm in spring sown plants increased rap- idly after fading of flowers, but the rate of growth in corms of autumn sown plants was constant from the time of sprouting to the digging time.
(8). Effect of day-length on the content of auxin in flower buds Experiment 18(25)
(Experiment of August to November, 1958.) Materials and methods
Corms of Spotlight variety were divided into long day plot and short day plot, and then they were planted in the experimental farm of Kyoto University on August 27, 1958. All night lighting with a lOOW incandescent lamp per 16'm2, 1.5 m above the ground and shading with black vinyl film 5 p.m. to 9 a.,m. every day, were made from October 10 to November 6.
Samplings were made every week during the course of the experiments and the avena tests were made on each sample. Auena satiua, variety Victory grown a t Hokkaido University was used for the curvature test. T o determine the auxin con- tent, the diffusion method, diffusing to agar block for 3 hours a t 25°C) was em- ployed..
Results
The results obtained are shown in tables 20, 21 and 22.
Table 20. -Effects of day length on the height of plant, number of leaves, length of stem, and length of spike in gladiolus.
.- .
-I I I I I
Number of leaves
Treatment Length of' stem
1
,
Length of spike Before treatment/
Oct 91
73 4cm-- ...-- --
/
O c t 1 61
7 8 7 Date of measurement Height of plant Long dayTable 20 shows that; two weeks after the start of treatment, it was observed that the length of flower spikes in short day plot was getting shorter than that in long day plot, nevertheless no difference was observed between long day and short day plot in the height of plants, number of leaves, and length of stems. The difference
Oct 21 79. '7 9 2 8 69 1. 17&0. 12 Oct. 30
1
8 3 1 1 0 11
2 0 2 0 2 2 i a 0 3 2I
N o v . 61
95.6/
11.2 Short day - -- Oct 16 Oct 21 Oct 30 Nov 6 - -78 81
8.9 8 4 5 9 3 86 6,
10 3 9 0 0 1 10.524 Kiyoshi Kosucr
in the length of spike increased gradually a s the time progressed. Finally, the blindness occurred in short day plot, four weeks after the start of treatment.
Table 21.-Comparison between the auxin contents in the flower spike in gladiolus grown under long and short photoper iod
Date of Avena curvature (")
- - I A A
measurement Long day Short day (0.2 P P ~ )
1
(bud14 agar) (budfi agar) Oct 91
Before treatment 32 17&2 77*
budlone agar**
0 4 ppm Oct 16Oct 21
Table 21 shows that; the value of avena test with the plants under short day condition was smaller than that under long day condition two weeks after the start of treatment. As the time progressed, the difference in the measurement values between long day and short day plots became greater. Finally, only few avenas were curved with the plants under short day.
Table 22 -Comparison between the auxin contents in the flower spike of same length taken from plants grown under long day and short day
Date of Avena curvature (") - - -. . -
measurement Long day I Short day I
I
(budlone agar)
1
(budlone agar) I RemarkI
- Oct 301
11 7 5 2 2 791
10 14-15 32 I I 8mm cut 29 50-13 61 33 08-14 38 N o v 61
2 5 2 0 - 1 4 0 9 1 5 0 0 - 1 3 9 31
lOmm cut 16 92-12 30 15 50-12 92 (32.50-14 12)* I (31 57&5 2 4 ) ~ 24 75&8 46 I 19 50&7 41 ( 3 2 4 3 & 4 7 2 ) * I ( 2 6 3 0 k 4 6 4 ) K Oct 30 18 33-11 44 (25 5 6 2 3 53)"" Nov 61
32 44-15 10Table 22 shows almost the same results a s obtained in table 21.
30 OOk5 46 I 2 2 2 2 1 4 2 2 27 3 0 k 4 09
1
8 7 8 1 3 5 9(9). EfTect of auxin and gibberellin spray on the flowering of gladiolus
Experiment 19
(Experiment of IAA and GA spray.) Materials and methods
Corms of Purple Supreme were stored in a refrigerator a t 5°C from March 20 to August 26, 1959. Then they were divided into 14 plots a s follows: dipped the corms in the solution of 100 and 50 ppm gibberellic acid for 16 hours before planting, sprayed the plants with solution of 100, 50, 20 and 10 ppm GAY sprayed the plants with solution of 100, 50, 20 and 10 ppm IAA, and sprayed the plants with solution
Studies on production and flowering in gladiolus 25
of IAA 10 ppm prus GA 50, 20 and 10 ppm every week from September 22 to November 17. Planting was made on August 27, 1959.
Results The results obtained are shown in table 23..
*
Spraying was made every week from Sept 22 to Nov 17, 1959*a Dipped in the solution of gibberellin for 16 hours before planting
Table 23 -Effects of gibberellin on the percentage of blind plant in gladiolus
No of plants Percentage P ~ Number of ~ ~Height of { Number of ~ ~
Treatment e x a m i n e
i f
o w e i n plant florets1
plant leavesFrom this table, it seems that the spraying of high concentration of IAA and GA increased the amount of blindness, nevertheless, the spraying of IAA 20 ppm solution was effective more or less to reduce the percentage of blindness.
2. Effect of light intensity (1). Effect of defoliation 6 3 7 1 6 5 66 7 l7 Spray* GA lOOppm 50 20 Experiment 2 0 . ( ~ ~ ) (Experiment of May to August, 1955..)
15 18 14
Materials and methods
Corms of Golden Cup variety were planted on May 18, 1955, and the leaf blades of the plants were cut off from lower leaves to upper leaves continuously accord- ing to the plant growth, leaving 2, 3 and 4 of the leaf blades by the plots..
88
gem
92 7 93.9Results The results obtained are shown in table 24..
8 9 9.2 9 6 87.0
i
21 7 1 4,
7.1 [ 6.4 10 14 9.5 Dip** GA 1001
22 50 0 31.8 6 9 92 8 9 1 501
20/
45.01
50.01
6 . 51
90.01
8 6 Spray*IAA 100 50 20 10 Spray* GA+
IAA 50f 10 20i-10 lo+-10 Control1
171
7 0 6/
2 9 41
6 81
9 2 91
9.0 18 13 15 14 16 19 15 44 4 16 7 46 2,
38 5 93'3 6.7 21.4 71. 4 7. 2 7 3 7.8 7.5 6 5 5 6 5.0 50 0 63 2 46. 7 37 5 31 5 26 7 92 0 89 8 99 3 96.8 84 7 92 9 90.8 9 2 8. 5 9 8 9. 5 8. 1 9 4 9. 326 Kiyoshi Kosuor
This table shows that no difference was observed in the percentage of flowering, between the plants of defoliated plots and check plot, and no blind stalk was ob-
Table 24 -Effects of defoliation on the flowering in gladiolus. (Var Golden Cup, 1955)
Treatment (number No of plants Percentage Average date Height of Number of
) examined of flowering of flowering plant florets
served in these plants,
(2). Effect of reduced light intensity
9 4
10. 7 9 9 7. 4
Experiment 21(22)
(Experiment of reduced light intensity in summer.)
No defoliation 4 leaves 3 leaves 2 leaves
Materials and methods
July 24 July 24 July 26
Corms of Hector, Picardy, Radiance and Yellow Herald varieties were planted in
cm 80 1 83 0 78 9 15 15 15 15 July 24 70 5 % 100 100 100 100
(37.9%), D: shaded by marsh-reed screen (23 3 %)
Table 25 -Effects of light intensity reduction on the flowering in gladiolus during summer season.
--- (1955) -
-I
Average date Percentage Number of Height of Number of 'lot* of flowering of flowering florets plant leavesA B C D Hector 100%
-rI5
5 100 14 7 13 6 loo loo1
12.4 ---- -- June 29 June 30 June 30 July 7 106.8 113 4 117 6 115.1 A B C D A 7 9 7 8 7 7 7.8 120 1 116.2 122 7 120.7 104 3 113 2 110 0 8 6 8 5 8 6 8. 7 - 7 3 7.0 7 5 June 271
100 13 3 1 0 1 1 5 D 11.0 Yellow Herald A B C D 106.51
6.5 Picard y 13 0 11 8 13 0I
July 8 July 11 July 10*
A: natural light intensity (loo%), B: shaded by vinyl film (66 7%), C : shaded by oil paper June 25 June 25 100 100 100 July 12 100 1 11.2 100/
16 1I
112 2/
Radiance June 27 100 10 7 100 15 1 June 24 1001
15 6 June 24I
100 12.8 110 8 7. 2 104.71
7.1Studies on production and flowering in gladiolus 27
the flat on March 29, 1955, and shaded by vinyl film (light intensity was 66.7% to the check), oil paper (37.9%), and marsh-reed screen (23.3%) with the plots, from 8 a.m. to 5 p.m. every day for a period from May 20 to June 29, 1955.
Results The results obtained are shown in table 25.
This table shows that no difference was observed in the percentage of flowering between the treated plants and the check plants, and no blind stalk was observed in these plants.
Experiment 22(22)
(Experiment of reduced light intensity in autumn and winter..) Materials and methods
Corms of Picardy and Yellow Herald varieties were stored in a refrigerator a t 0-,5"C from April 1 to August 24, 1955, and then planted in the flat on August 26. They were shaded by vinyl film (light intensity was 49.4% to the check), oil paper (31.5%), and marsh-reed screen (20.5%) with the plots all day long from Septem- ber 20 to December 20, 1955. And supplementalry lighting was used to eliminate the influence of short day.
Results
The resurlts obtained are shown in tables 26, 27, 28, 29 and fig.. 9.
Table 26 -Effects of light intensity reduction on the flowering in gladiolus during winter season (exp I)
(\Tar Yellow Herald, 1955)
No' of Average datt Plot*
1
examined plants/
of floweringPercentage Percentage of blind flowering*" plant A B C D Number of florets Dec 5 33 Dec. 7 33 Dec. 8 30
I
Dec 17 Height of plant I - -cmi 1 1 6 4/
Number of leaves*
Abbreviation is the same as in table 25a+ Including unflowered plants
Table 26 shows that, in Yellow Herald variety, no difference was observed in the percentage of flowering between the treated plants and the check plants, except a very little amount of blindness in the marsh-reed screen plot.
Fig. 9 and table 27 show that, in Picardy variety, plant was not bloomed because the temperature was too low for this variety. And in this variety the amount of normal flower buds were decreased and undifferentiated plants were increased as the light intensity decreased. No difference was observed between the treatments on the percentage of blind stalk, except marsh-reed screen plot, in which very few
28 Kiyoshi KOSUGI
blind plants were observed.
From these results, it seems that the light intensity is not the main factor to the cause of blindness in gladiolus, as far as these experiments were concerned.
o
Undifferentiated
Blind
E
Normal
f l o w e r
_--_ -._ _-.-/ --,-- -v
Control Vinyl film Oil paper Marsh-reed screen
Fig. 9. Effects of light intensity reduction on the flowering in gladiolus during winter season (var Picardy, Dec 20, 1955)
Table 27 -Effects of light intensity reduction on the flowering in gladiolus during winter season (exp 11)
(Var Picardy, 1955)
Plot*
Percentage of Percentage of plant
I
Percentage ofI
undifferentiated with nor ma1 flower1
blind plant plantB
C
D
*
Abbreviation is the same as in table 25 21. 6 19 0 4 4 36 1 42 3 24 0 57 0 5 3 I 90 3Studies on production and flowering in gladiolus 29
Table 28.--Seasonal changes in light intensity at Kagawa. (Dec.. 1954 to Nov.. 1955) -- - Date of measurement Dec. 17, 1954 ,Jan. 16, 19.55 Feb. 23 Ap r.. 13 May 14 June 22 ,July 18 Aug. 15 Sept.. 12 Oct. 12 Nov. 1.5
Sum value of a day*
*
Sum of hourly values in lux in a day**
Shown as per cent that on July 18Table 29 -Light intensity under different shading materials in the morning and the evening
Experiment 23
(Experiment of July to October, 1960.) Materials and methods
Time observed 4-00a m 15 30 45 5-00 6-00 7-00
Corms (8-.13g) of Spotlight variety were stored in a refrigerator a t 5°C from March 20 to July 11, 1960. They were divided into two groups of natural day length and short day (8 hours) length, and each of the groups was divided into four. plots. The four plots are check plot and plots shaded with one, two and three fold black victoria lawn.
Control 0 2 17 198 480 4,400 73,000
Vinyl film Oil paper Mar sh-r eed screen
T h e corms were planted in the bench with sand in the experimental greenhouse
6-00p m 7-00 15 30 45 8-00 0 0 5 53 110 900 7,300
I
0 0 0I
OSunrise: 4-53a m , and sunset: 7-lop m (June 28, 1955 at Takamatsu, Kagawa) 11 112 27 5 2,750 35,000 310 260 53 13 7 73 170 1,700 9,000 40 5 385 92 26 1,700
/
825 I 1,270 190 77 6 7 50 133 33 0 O I 0I
0I
p0-30 Kiyoshi K o s u ~ r
of Kagawa University on July 14, 1960. Treatments were began on August 15. In the short day plots, shading was made from 4-30 p.m. to 8-30 a.m. by black vinyl film every day. After the buds were sprouted, nutritional solution containing 100 ppm N, 50 ppm P and 50 ppm K was applied every week. The natural day-length
10 \
B
100- 9 0 N u n b e r o f leaves WhoLe plant 6 0 5 0 Height o f plant 40 \ 30- \ \ &.-_ 20- -* 8 0 60 =--- I t G VI V2 V 3 C V1 V 2 V 3Fig 10 Effects of light intensity reduction on Fig 11 Effects of reducing light intensity on the length of stem, number of leaves and height the weight of whole plant of new corms of plant in blind plant in gladiolus C: no shad-
ing (control), V1, V2, V3: shaded by one, two and threefold victoria lawn
-natural day length short (8 hour) day length
Table 30 -Effects of light intensity reduction on the flowering in gladiolus during summer season
(Var Spotlight, 1960)
Average date Number of Percentage Height of Number of of flowering florets Of flowering plant
1
leaves*
N: natural day length, S: short day (8 hours), V1, V2, V3: shaded by one, two and threefold victoria lawn. 85 3% 0 0 0 4 6-
-.-
1 0-
-
- 401
Oct 14:zt
1
40-
401
-
N-V3 401
- S-Cont S-V I S-V2 S-V3 1 1 6 3 C m-
-
-
8 2 - - - 0 - 0 O / -40 40 40 40 9 0 -- ---
Oct. 17-
-
-Studies on production and flowering in gladiolus 3 1
plots were lighted with 100 W incandescent lamps from October 1 to prevent short day effect.
Results
The results obtained are shown in tables 30 and 31, figs. 10 and 11.
Table 30 shows that none of the plants bloomed, except 85.3% flowering in na- tural day-length check plot and 3.1 % in short day check plot.
Fig. 10 shows that the length of stem and the number of leaves were decreased when the light intensity was reduced, but a tendency of etiolation was observed in one and two fold victoria lawn plots, and the weakest growth was observed in the three fold plot.
Fig. 11 shows that the weight of whole plant and that of new corms were de.. creased when the light intensity was reduced, except the new corms in natural day-length check plot.
In general, the-length of stem, number of leaves, height of plant, weight of whole plant and weight of new corms in short day plots were smaller and less than those of natural day-length.
Table 31 shows the mean temperature and mean maximum light intensity in the plot during the course of the experiment.
From these results, it seems that high night temperature after low light inten- sity increases the amount of blindness as Post and Runger pointed out.
Table 31 -Mean temperature and mean maximum light intensity in the plot during the experiment
JI.
Nutrition and water 1. Effect of nutritional treatments .-Temperature Maximum
1
Minimum(I). Effect of nutritional treatments
*
As per cent of N-control plot intensity**
As per cent of out-door intensity (77,600 lux)Light intensity Maximum
I
Percent1
63,800luX/
100*(822**)% 27,006 I 43 (35. 3) 12,310 19 (15 6) 5,840 Experiment 24(26)(Experiment of May to November, 1958.)
215" 18 1 19 6 19 4 21 4 20 8 21 1 20.9 N-Cont. N-V 1 N-V2 N-V3 S-Cont S-Vl S-V2 S-V3 62,600 31,400 14,360 6,960 31.0" 30 8 29.3 29. 4 32 9 32 3 31 2 31.0 98 (80 6 ) 49 (40 3) 23 (18 9) 11 ( 9.0)
Kiyoshi KOSUGI
Materials and methods
/
According to the design shown in table 32, corms of Spotlight variety (average weight 25.78) were planted in sand in Wagner's pots three corms per pot, on May 26, 1958 and nutritional treatments were made from June 17 to September 1 3 a t 3 day intervals during the course of experiments.
Table 32 -Design of fertilizer treatment
-- --
1
Rate of1
Amount ofSamplings for chemical analysis were made a t the time of flowering, August 21, and a t the time of digging, November 5, 1958.. T h e date of flowering, height of plants, number of leaves and number of florets were recorded a t the flowering time. Fresh weight of tops, new corms, and cormels, and number of cormels were meas- ured a t the digging time,
Analytical methods employed were Kjeldahl method for nitrogen, ammonium molybudate and colorirneter for phosphorus, and flame photometer for potassium..
Studies on production and flowering in gladiolus
Results The results obtained are shown in figs. 12,-17.
L S D . N S Average d a t e of flowering 5% 3 0 L S.D. ''11% 4 1
A d ' -
-
K 2 K 1 K 2 K 1 K 2 K 1 P 2 PFig 12 Effects of nutritional treatments on the average date of flowering and percentage of flowering
From fig. 12 no significant difference was observed in the percentage of flower- ing, and earlier flowering was observed in the plots treated with 200, 100 ppm N and 50 ppm P, but later flowering was observed in - N plots.
l l O C d Fresh weight of t o p L > V '-11%45
v%
4
-r s n ~ = 1 % 3 8
20t -v w 8 0
Fresh weight of new corm
Number o f leaves L S D N S
Number of florets LS.D N S A
A.
-
.I\.2%
.A
/*
&A/Fig 13 Effects of nutritional treatments on the height of plant, number of leaves, number of florets, fresh weight of top and fresh weight of new corm
From fig.. 13, no significant differences were observed in the height of plant, number of leaves and number of florets, although there were a few blind stalks in
34 Kiyoshi KOSUGI
-,N and several in other plots, and fresh weight of tops and new corms were increas. ed with increasing nitrogen.
In general, the color of leaves in the plots supplied with 50 ppm N or --,N was yellowish-green, which is clearly the nitrogen deficient symptom, and these plants showed weaker growth. In the plants of 200 ppm N, the color of leaves was dark green and the plants looked vigorous, but the color of roots was dark brown and the development of root system was poor.
4 3
1
Number of cormels 1 20-
-
-
10 -- 9-
8 - 7-
6-
5-
4-
3
-
Fresh weight of cormela,h f i - h - a t . M A-
*
Ap
8%
L I - N P K N K N K N N NO d ; ; i i i i z
1 2 4 1 2 1 2 4 1 2i b d
ii4
; i d
i h h
ii4
; 2 4 N N N 1 P 2 P 1 K 2 K 1 K 2 K 1 K 2 K 1 P 2 PFig 14 Effects of nutritional treatments on the number of cormels and fresh weight of cormel
-
A t the timP of flowering&-A A t the time of digging
Fig. 15. Effects of nutritional treatments on the contents of nitrogen, phosphorus and potassium in the top.
Studies on production and flowering in gladiolus 3 5
From fig. 1 4 it is seen that the number of cormels increased in the. plots supplied with low level nitrogen, and decreased remarkably in 200 ppm N plots, and there was no significant difference in the fresh weight of cormels.
% 2
N l ~ k a . ~ i J ~ i ~
a!
dP
A-A A'/kAeA
0 1 \,pa %-A A 7 3 4Fig 16. Eff'ects of nutritional treatments on the contents of nitrogen, phosphorus and potassium in new corm
I I I I L 1 " " I I l l I l l 1 1 1 1 L
1 2 4 1 2 1 2 4 1 2 4 1 2 4 1 2 4 1 2 4 1 2 4
N K N N N N N N
2 P 1 K Z K 1 7 2P K 1 K 2 K
2 P
Fig 17 Effects of nutritional treatments on the amounts of nitrogen, phosphorus and potassium absorbed by gladiolus
Figs. 15, 16 and 17 show that; absorption of nitrogen increased with increasing of nitrogen supply regardless of application rates of phosphorus or potassium. With increasing phosphorus supply, increased not only P absorption but also N absorp- tion, except the plot supplied with phosphorus alone. With increasing potassium supply increased K absorption slightly when it was supplied with 25, 50 ppm P or 100 ppm N, and decreased when it was supplied with 200 ppm N.
Kiyoshi KOSUGI
From the results mentioned above, it seems that nitrogen is related strongly to flowering in gladiolus, and the optimum nitrogen concentration for flowering is 100 ppm. And phosphorus promotes the effect of nitrogen.
(2). Effect of nutritional treatments of the previous year Experiment 25(27)
(Experiment of March to July, 1959.) Materials and methods
Table 33. -Effects of nutritional treatments on the contents of nitrogen, phosphorus and potassium in the corm of gladiolus
(Var Spotlight)
-
Treatment in previous Nutritional content in corm
( % in d r y matter) Number of Average Plot
1
year --I
cormsI
weight ofplanted corm
Studies on production and flowering in gladiolus 37
Corms of Spotlight variety which were shown in table 33 were planted in the bench with sand in the experimental greenhouse a t Kagawa University on March 19, 1959, and they were grown with water alone (no fertilizer was added).
The number of germinated corms, date of flowering, number of plants died, num- ber of blind plants, and number of flowered plants were recorded. On July 31, all plants were dug up, and the fresh weight of tops, fresh weight of corms, and num- ber of cormels were recorded.
Cormels of the same variety which were shown in table 35 were planted in the same greenhouse on March 20, and they were dug up on June 4, and the fresh
Table 34 -Effects of nutritional treatments in the previous year, on the percentage of
germinated corm, percentage of dead plant, percentage of blind plant, length of stalk with blind flower, and percentage of flowering in the year
*
less than 0.1 cm. Percentage of blind plant Plot Per centage of r K - g e r m i n a t e d Treatment in previous year1
Percentage of dead plant Length of stalk with blind flower Percentage flowering38 Kiyoshi Kosucr
weight of the plants were measured.
Results
The results obtained are shown in tables 34, 35, figs. 18, 19, 20 and 21.
Table 34 shows the percentage of germination and percentage of flowering were high in the plants to which nitrogen was applied in the previous year, and the per- centage of plants died and percentage of blind stalks were high in -N plots. Several malformed plants were observed in the plot in which 200 ppm N alone was applied. In fig. 18 earlier flowering is observed in the plants to which 100 ppm N and 25, 50 ppm P were applied in the previous year, and later flowering in -- N plots or the plots to which 200 ppm N alone was applied.
L
Fig 18 Effects of nutritional treatments in the previous year on the date of flowering in the current year
In fig. 19, no difference was observed in the number of leaves between the plants to which nitrogen was applied but not in the previous year, nevertheless, the num- ber of florets was increased in the plants to which nitrogen was applied in the pre- vious year.
Number
o f
leaves
2 ' " 1 " " " " ' " " ' " ' " ' ' " " 1 1 " ' I ' $ 1 2 4 7 2 1 2 1 2 4 1 2 1 2 4 1 2 1 2 4 I 2 4 1 2 4 1 2 1 1 2 4 1 2 4 N N P K N K N K N N N T 1 P 2 P l K 2 K l K 2N K 1N K 2N K!
1 P 2 P LFig 19 Effects of nutritional treatments in the previous year on the number of leaves and number of florets in the current year