Green synthesis of nanoparticles and their
applications to bio-environmental
著者
Vemu Anil Kumar
学位授与大学
東洋大学
取得学位
博士
学位の分野
バイオ・ナノサイエンス融合
報告番号
32663甲第399号
学位授与年月日
2016-09-25
URL
http://id.nii.ac.jp/1060/00008452/
Creative Commons : 表示 - 非営利 - 改変禁止 http://creativecommons.org/licenses/by-nc-nd/3.0/deed.jaDoctor’s Thesis
Green synthesis of nanoparticles and their applications to
bio-environmental fields
Vemu Anil Kumar
4R10130001
3
rdYear
Doctor Course
Course of Bio-Nano Science Fusion
Graduate School of Interdisciplinary New Sciences
Toyo University, Japan
Academic Year’s 2016
Preface
The present research is focused on the Green methodology to synthesise nanoparticles by using aqueous leaf extracts to application in bio-environmental fields. In chapter 2, Prunus yedoensis leaf extract was used to synthesise biocompatible silver nanoparticles. It is the fact; much leaf extracts posses’ supreme medicinal properties, where even raw leaf extracts are used to treat various dreadful infections and diseases. The prime motive of the work is to utilise the properties of Prunus
yedoensis leaf extract to synthesise silver nano particles which holds medicinal
properties and more over biocompatible, so that both the properties of silver nanoparticles and leaf extract can be utilised together in synthesising novel nanoparticles that can be used as a Nano medicine. In chapter 3, leaf extract of a weed species Solidago altissima was used to synthesise nanoparticles composed of silver and silver chloride which is a plasmonic photo catalyst; Solidago altissima is considered to be a potential threat for wetlands that cause economic damage to the agriculture fields in Japan. The leaf extract of the weed species consists of abundant chlorine components, which lead to synthesise silver chloride nanoparticles. In chapter 4, nanoparticles composed of silver and silver chloride were synthesised based on the methodology of chapter 3. The intention to support Japan economy as mentioned by the MEXT- Japan, with scientific knowledge is partially fulfilled by the present work, however an immense further research is to be proceeded.
This thesis is submitted for the degree of Doctor of Philosophy at the Toyo University, Kawagoe, Japan. The research done, to the best of my knowledge is original except the references mentioned. Neither this nor similar thesis of this work has been submitted for any other purposes.
CONTENTS
Preface………...(i)
Chapter 1 Introduction………1
Chapter 2 - Synthesis of biocompatible silver-filling organic compounds nanoparticles via bio-reduction using an extract from cherry leaves. 2.1 Introduction..………...……..………….11
2.2 Methodology 1……….………..14
2.3 Methodology 2……….………..17
2.4 Characterisation……….………18
2.5 Results and Discussion……….………...20
2.6 Conclusion……….……….41
Chapter 3 - Synthesis of nanoparticles composed of silver and silver chloride for a plasmonic photocatalyst using an extract from a weed Solidago altissima (golden rod). 3.1 Introduction……….………51
3.2 Methodology………….………..54
3.3 Characterisation……….………56
3.4 Results and Discussion……….………...59
3.5 Conclusion……….……….74
Chapter 4 - Synthesis of nanoparticles composed of silver and silver chloride for a plasmonic photocatalyst using an extract from needles of Pinus densiflora. 4.1 Introduction……….………83
4.2 Methodology………….………..85
4.3 Characterisation……….………87
4.4 Results and Discussion……….………...89
4.5 Conclusion……….……….97
Chapter 5 Conclusion………...………...(ii)
Acknowledgement………...(v)
The research focused on the phyto synthesis of nanoparticles by bio-reduction of metal salt solution with aqueous leaf extract of different plants. The work proceeded aiming at proper utilisation of aqueous leaf extracts and metal salts in synthesising nanoparticles, to bring the cost of synthesis as low as possible and to make the synthetic procedures as simple as possible following ambient conditions. At a maximum effort, toxic chemicals and complicated experimental protocols were avoided, even though better results were put forth in both synthesis and applications. A wide range of characterisation was executed to determine properties of the pristine nanoparticles, so that as-synthesised particles were used in various fields.
Metal nanoparticles (MNPs) are much significant in science and technology because of their extraordinary beneficial physical, chemical and biological properties to develop and engineer sophisticated modish products not only limited to research but also at commercial scale. Notable properties of MNPs are mainly due to high surface area to volume ratio and other properties like specific optical properties, mechanical strengths, lower melting points and specific magnetizations, which promote their applications in various fields. The intrinsic properties of MNPs are mainly determined by its size, shape, composition, crystallinity, surface functionality and solid / hollow structure which differs from bulk metals. In fact, these parameters can be controlled to fine-tune the properties. MNPs include pure metal nanoparticles, metal-oxide nanoparticles, alloy nanoparticles and composite nanoparticles coupled with some other non-metallic compounds. Among MNPs Silver nanoparticles (Ag NPs) are extensively studied for decades due to their unique surface plasmon resonance properties in visible region. 1
Nano silver have 120 years of history.2 Ag NPs are in significant demand at not only a research level, but also even a commercial one worldwide thanks to their distinctive physicochemical properties such as high electrical and thermal conductivities, surface enhanced Raman scattering ability, chemical stability, catalytic activity and nonlinear optical behavior 3. Ag NPs have been extensively used in the fields of medicine, physics, materials science, chemistry
45 and agriculture. 6 They have been actively utilized particularly in electronics,
photonics, chemical sensing/imaging, drug delivery/bio-labeling, 7, 8 textile industry, food industry,6 degradation of organic pollutants and water purification9. Ag NPs have also been used in recent years as an antimicrobial agent to prevent infections and have also found many uses in medical products, such as antibacterial surface coatings of stents, breathing tubes, heart valves, catheters, surgical masks, and wound dressings.10, 11. Ag NPs based consumer products extensive usage can be seen in personal care and cosmetics, textiles,
electronics, household products/home improvement, and
filtration/purification/sanitization devices.12. All together the applications of Ag NPs can be generally categorized under three, such as consumer goods, biomedicine and food production and packing. Project on Emerging Nanotechnologies (PEN) have stated the statistical data of utilization of Ag NPs in this generation.13
Synthesis of Ag NPs can be proceeded by physical, chemical and biological methods,14 15but biological syntheses are advantageous in such a sense that it is cost effective and environmentally friendly, and furthermore there is no need for high pressure, high temperature and toxic chemicals16. So
Synthesis of metal nanoparticles by green protocols is of great demand17.
Integration of green chemistry in the synthesis of nanomaterials promotes both performance and safety18. In the biological synthetic methods, either
microorganisms19, 20 or plant extracts21-23are commonly used. It is supposed that using plants for synthesis of Ag NPs may be quite reasonable even compared to the other biological methods since several elaborate processes such as cell culture maintenance and specific handling procedures under aseptic conditions can be eliminated24.
On the other hand Ag NPs when associated with other materials forms nano-composite materials that promotes applications in various fields based on their distinctive properties. In recent years Ag@AgCl nanoparticles drawn many researchers of its photo catalytic activity in visible light. Ag@AgCl NPs are acknowledged to be an efficient and stable photo catalyst under irradiation of visible light 25-29. Silver nanoparticles (Ag NPs), which are one of the noble
metal ones due to surface plasmon resonance (SPR) effect, have a strong visible light absorption ability 30; whereas Silver chloride nanoparticles (AgCl NPs), which posses promising electronic, magnetic, optical and catalytic properties 31; act as photosensitive semiconductor with a direct bandgap of 5.15 eV (241 nm) and indirect bandgap of 3.25 eV (382 nm)32 33. Nanoparticles composed of both Ag with AgCl (Ag@AgCl NPs) would therefore act as an efficient plasmonic visible light photo catalyst34, 35. Photo catalyst in general synthesised by hydrothermal method 36, in-situ anion exchange method 37 and
in-situ photoactive method 38. So there is a need to develop green methods to synthesise such nanoparticles.
References
1. M. Jakob, H. Levanon and P. V. Kamat, Nano Letters, 2003, 3, 353-358. 2. B. Nowack, H. F. Krug and M. Height, Environmental Science &
Technology, 2011, 45, 1177-1183.
3. Y. A. Krutyakov, A. A. Kudrinskiy, A. Y. Olenin and G. V. Lisichkin,
Journal, 2008, 77.
4. D. R. Bhumkar, H. M. Joshi, M. Sastry and V. B. Pokharkar,
Pharmaceutical Research, 2007, 24, 1415-1426.
5. C. A. J. Lin, T. Y. Yang, C. H. Lee, S. H. Huang, R. A. Sperling, M. Zanella, J. K. Li, J. L. Shen, H. H. Wang, H. I. Yeh, W. J. Parak and W. H. Chang, Acs Nano, 2009, 3, 395-401.
6. R. Nair, S. H. Varghese, B. G. Nair, T. Maekawa, Y. Yoshida and D. S. Kumar, Plant Science, 2010, 179, 154-163.
7. M. C. Daniel and D. Astruc, Chemical Reviews, 2004, 104, 293-346. 8. R. Guo, Y. Song, G. L. Wang and R. W. Murray, Journal of the American
Chemical Society, 2005, 127, 2752-2757.
9. N. Durán, P. D. Marcato, O. L. Alves, G. I. D. Souza and E. Esposito,
Journal of Nanobiotechnology, 2005, 3, 1-7.
10. U. Samuel and J. P. Guggenbichler, International Journal of Antimicrobial
Agents, 2004, 23, S75-S78.
11. Y. Li, P. Leung, L. Yao, Q. W. Song and E. Newton, Journal of Hospital
Infection, 2006, 62, 58-63.
12. S. W. P. Wijnhoven, W. Peijnenburg, C. A. Herberts, W. I. Hagens, A. G. Oomen, E. H. W. Heugens, B. Roszek, J. Bisschops, I. Gosens, D. Van de Meent, S. Dekkers, W. H. De Jong, M. Van Zijverden, A. Sips and R. E. Geertsma, Nanotoxicology, 2009, 3, 109-U178.
13. T. Quang Huy, N. Van Quy and L. Anh-Tuan, Advances in Natural
Sciences: Nanoscience & Nanotechnology, 2013, 4, 033001 (033020
pp.)-033001 (033020 pp.).
14. H. C. Chen, M. C. Roco, X. Li and Y. L. Lin, Nature Nanotechnology, 2008, 3, 123-125.
15. K. M. M. Abou El-Nour, A. Eftaiha, A. Al-Warthan and R. A. A. Ammar,
Arabian Journal of Chemistry, 2010, 3, 135-140.
16. C. N. Lok, C. M. Ho, R. Chen, Q. Y. He, W. Y. Yu, H. Sun, P. K. H. Tam, J. F. Chiu and C. M. Che, Journal of Biological Inorganic Chemistry, 2007, 12, 527-534.
17. S. Iravani, Green Chemistry, 2011, 13, 2638-2650.
18. M. J. Mulvihill, E. S. Beach, J. B. Zimmerman and P. T. Anastas, in
Annual Review of Environment and Resources, Vol 36, eds. A. Gadgil
and D. M. Liverman, Annual Reviews, Palo Alto, 2011, vol. 36, pp. 271-293.
19. D. Mandal, M. E. Bolander, D. Mukhopadhyay, G. Sarkar and P. Mukherjee, Applied Microbiology and Biotechnology, 2006, 69, 485-492. 20. K. N. Thakkar, S. S. Mhatre and R. Y. Parikh,
Nanomedicine-Nanotechnology Biology and Medicine, 2010, 6, 257-262.
21. A. K. Mittal, Y. Chisti and U. C. Banerjee, Biotechnology Advances, 2013, 31, 346-356.
22. H. P. Borase, B. K. Salunke, R. B. Salunkhe, C. D. Patil, J. E. Hallsworth, B. S. Kim and S. V. Patil, Applied Biochemistry and Biotechnology, 2014,
173, 1-29.
23. P. A. Poonam Patel, Sajjan Kanawaria, Sumita Kachhwaha, S. L. Kothari, in Nanotechnology and Plant Sciences, ed. M. H. A.-W. Manzer H. Siddiqui, Firoz Mohammad, Springer International Publishing, Switzerland, 2015, ch. 13, pp. 271-288.
24. S. S. Shankar, A. Rai, A. Ahmad and M. Sastry, Journal of Colloid and
Interface Science, 2004, 275, 496-502.
25. P. Wang, B. B. Huang, X. Y. Qin, X. Y. Zhang, Y. Dai, J. Y. Wei and M. H. Whangbo, Angewandte Chemie-International Edition, 2008, 47, 7931-7933.
26. X. C. Ma, Y. Dai, L. Yu, Z. Z. Lou, B. B. Huang and M. H. Whangbo,
Journal of Physical Chemistry C, 2014, 118, 12133-12140.
27. L. Han, P. Wang, C. Z. Zhu, Y. M. Zhai and S. J. Dong, Nanoscale, 2011,
28. H. Xu, H. M. Li, J. X. Xia, S. Yin, Z. J. Luo, L. Liu and L. Xu, Acs Applied
Materials & Interfaces, 2011, 3, 22-29.
29. Y. Y. Li and Y. Ding, Journal of Physical Chemistry C, 2010, 114, 3175-3179.
30. L. Ge, C. C. Han, J. Liu and Y. F. Li, Applied Catalysis a-General, 2011,
409, 215-222.
31. T. Hua and F. Wai Yip, Chemical Physics Letters, 2005, 406, 289-293. 32. S. Glaus and G. Calzaferri, Photochemical & Photobiological Sciences,
2003, 2, 398-401.
33. J. Tejeda, N. J. Shevchik, W. Braun, A. Goldmann and M. Cardona,
Physical Review B (Solid State), 1975, 12, 1557-1566.
34. C. C. Han, L. Ge, C. F. Chen, Y. J. Li, Z. Zhao, X. L. Xiao, Z. L. Li and J. L. Zhang, Journal of Materials Chemistry A, 2014, 2, 12594-12600.
35. M. S. Zhu, P. L. Chen, W. H. Ma, B. Lei and M. H. Liu, Acs Applied
Materials & Interfaces, 2012, 4, 6386-6392.
36. L. Xinhui, H. Jinlin, L. Jiajia, H. Yong, S. Yong, Y. Haijian, T. Guoxiu and Q. Haisheng, Materials Letters, 2013, 91, 129-132.
37. J. Cao, B. D. Luo, H. L. Lin, B. Y. Xu and S. F. Chen, Journal of
Hazardous Materials, 2012, 217, 107-115.
38. D. Lihong, T. Shanshan, Z. Junyi, Z. Peiying, Z. Lifan and T. Fengwei,
Materials Letters, 2013, 91, 245-248.
Chapter 2
Synthesis of biocompatible silver-filling organic
compounds nanoparticles via bio-reduction
using an extract from cherry leaves.
Abstract
Multi-functional silver nanoparticles are in significant demand in both fundamental and practical studies thanks to their distinctive physicochemical properties. Silver nanoparticles can be synthesised by physical, chemical and biological methods, but biological syntheses are environmentally friendly, and furthermore there is no need for high pressure, high temperature and toxic chemicals. Silver nanoparticles covered with organic compounds are synthesised by mixing a leaf extract from Yoshino cherry with aqueous solution of silver nitrate. The particles show their high mono-dispersibility in water and biocompatibility thanks to the compounds covering the silver nanoparticles, and high surface enhanced Raman scattering activity owing to the core silver nanoparticles. The antibacterial activity of the particles is also investigated using Escherichia coli and Bacillus subtilis.
2.1 Introduction
Prunus yedoensis belongs to Rosaceae family and is commonly called Yoshino
cherry (Sakura). It is a deciduous flowering cherry plant, which is widely cultivated in various countries1 2. It occurs as natural hybrid flowering cherry plant in Japan and is widely cultivated in other temperate countries. It is a hybrid cherry probably between Prunus speciosa as father plant and Prunus
pendula f. ascendens as mother 3. A variety of Prunus species have been extensively studied since they possess admirable medicinal properties. Traditional medicine such as ‘Yaeng-Pi’ and ‘Hua-Pi’, which have been used for the treatment of cough, urticaria, pruritus, dermatitis, asthma, and measles 4 5, are in fact produced from Prunus yedoensis. The antioxidant and antiviral activities and the antihyperglycemic effect have also been intensively examined
6 7. The tree bark as a Japanese folk medicine is used for detoxification and in
additional used as a cough medicine, as an expectorant, to ease swelling, and to apply sores. Cherry bark extracts has been used to produce a commercial product called Brocin, which is being used to treatment coughs and mucus. Flavonoid glycosides present in the extracts are believed to be the probable reason for its medicinal functions. It was reported that P. yedoensis contains a large amount of different types of flavonoids 8 and the structures of the
flavonoids contained in mature leaves of P. yedoensis were identified as
5,4′-dihydroxy-7-methoxyisoflavone 4′-O-glucoside (prunetrin),
5,7,3′,4′-tetrahydroxyflavonol 3-O-glucoside (isoquercitrin), catechin, epicatechin, cyanidin 3-O-monoglucoside (chrysanthemin), and procyanidin. 9 10. Based on the admirable properties like presence of valuable flavonoid glycosides in the plant and its various extracts, considering their outstanding properties; e.g., anticancer, antihyperglycemic 7 antioxidant 11 anti-inflammatory 12 13 vasorelaxant 14 and antifungal precursory 15 effects and activities, in the present study the leaf extract of this medicinal plant species was used to exploit its properties in the synthesis of Ag NPs (silver nanoparticles) and later as synthesised particles used in various applications.
Highlights:
A green reliable method where no toxic chemicals, high temperature or pressure or any sophisticated conditions was utilized during the synthesis.
The temperature variations during the reaction had an absolute influence on the synthesis of nanoparticles in order to maintain their size and shape.
Re-nucleation and agglomeration of nanoparticles was prevented up to certain limit by following the new protocol.
Definite organic compounds capping layer was formed around the particles, which was the prime reason for biocompatibility.
Stability of particles in aqueous solution for several weeks. High SERS performance.
Antibacterial efficacy is quite considerable that even at low concentrations as-synthesized particles exhibited delay in growth of bacteria.
~~[RJ®
[f0
[ffii]@
[fi)~@~
[ffii]
®~DlJ @@~
2.2 Methodology – 1
The fresh plant leaves of Prunus yedoensis were collected from the Kawagoe Campus, Toyo University, Japan, and washed with millipore water to remove surface filth. The leaves were cut into small pieces; approximately 1.0 x 1.0 cm. 10g of the leaf pieces were boiled in 100ml deionized water for 15 min and filtration of the mixture was carried out by using filter paper (Whatman Cat No 1002-185) to obtain fresh aqueous leaf extract. The leaf extract was refrigerated at 4 oC for future use. 20 ml of the aqueous leaf extract was mixed with 60 ml of 1mM aqueous solution of AgNO3 (Sigma-Aldrich, Japan) under continuous
stirring at 37 oC for 60 min. This mixture centrifuged at 15000 rpm for 30 min to obtain the Ag NPs. Thus obtained pellet was purified after dispersing it in millipore water, followed by centrifugation at 15000 rpm for 30 min.
Results and Discussion
The plasmon resonance peak recorded by using UV-Vis-NIR spectroscopy was the primary confirmation of the synthesised nanoparticles. The leaf components are responsible for the reduction of the AgNO3 to synthesize Ag NPs. A typical
observation and study was done using Transmission Electron Microscope analysis, in order to understand the nucleation and growth of the synthesised particles when different parameters were changed in the synthetic protocol.
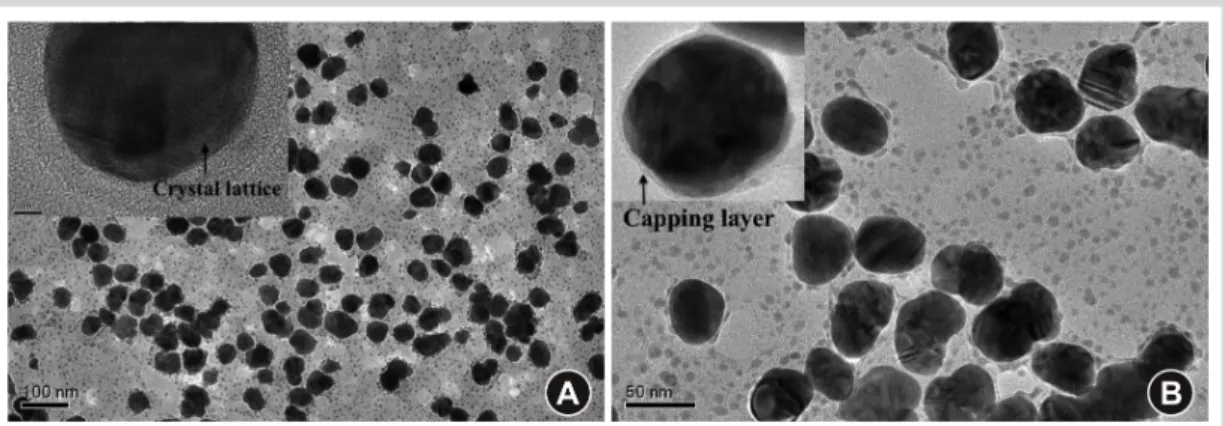
Figure 1 shows the transmission electron micrograph, it is noticed that the
particles were aggregated moreover small particles were formed, revealing that the nucleation and growth of the crystal is not constant. In order to over come this issue certain experiments were performed to determine the factors affecting the synthesis mechanism. Here with, a conclusion step was followed to determine the crystal growth based on alteration in temperature and achieved a considerable results.
Figure 1 (a) Wide view of nanoparticles and small particles of different sizes
were also present, inset – crystal lattice fringes (b) Nanoparticles covered with a capping layer, inset- capping layer around the particle.
2.3 Methodology – 2
Fresh plant leaves of Prunus yedoensis were collected from the Kawagoe Campus, Toyo University, Japan, and washed with millipore water to remove surface filth. The leaves were cut into squares of approximately 1.0 × 1.0 cm. 10 g of the leaf pieces were boiled in 100 ml millipore water for 15 min and filtration of the mixture was carried out using filter paper (Whatman Cat No 1002-185) to obtain a fresh aqueous leaf extract. The leaf extract was refrigerated at 4 °C. 20 ml of the aqueous leaf extract was mixed with 60 ml of 1 mM aqueous solution of AgNO3 (Sigma-Aldrich) rigorously at 4 °C. The mixture
(pH 5.8) was transferred to conical flask which was at 37° C in water bath and the temperature raise was observed from 4 °C to 30 °C within 5 min, and from 30 °C to 37 °C at a rate of 273.25K min-1 for 55 min under continuous stirring. This mixture was centrifuged at 15000 rpm for 30 min and finally a pellet was obtained. The pellet was purified after dispersing it in millipore water, followed by centrifugation at 15000 rpm for 30 min. Thus obtained nanoparticles were well characterized and further analysed for their biocompatibility, surface enhanced Raman scattering (SERS), and anti-bacterial efficacy.
2.4 Characterization of Ag NPs
The optical properties of the as-synthesized NPs were characterized by an ultraviolet-visible (UV-Vis) spectrophotometer (DU 730, Beckman Coulter) in the range from 200 to 1000 nm at a resolution of 1 nm. The morphology and structures of the Ag NPs were studied using a transmission electron microscope (TEM) (JEM2200FS, JEOL) at an acceleration voltage of 200 kV. Particles’ samples for TEM observation were prepared drying a droplet of a particles’ suspension on a carbon coated copper grid (Cu 200 mesh, JEOL) at room temperature. The crystal nature of the particles was determined by an X-ray diffractometer (XRD) (Smart Lab, Rigaku), using a Cu Kα X-ray with a wavelength of 0.154 nm, a voltage of 45 kV and a current of 200 mA, and employing the grazing-incidence X-ray diffraction procedure with scanning 2θ from 30° to 90° at 6.05 degrees per min at an incident angle of 0.01 degree. The zeta potential of the Ag NPs dispersed in millipore water were measured (pH 6) using a particle analyser (Zeta Nanosizer, Nano ZS, Malvern). The elemental composition of the particles was analysed by energy dispersive X-ray spectroscopy (EDS) (JEM2200FS, JEOL) at an accelerating voltage of 200 kV. The chemical functional groups of the organic compounds capping the particles were analysed by Fourier transform infrared spectroscopy (FT-IR) (Nicolet iS50, Thermo Fischer Scientific), scanning the samples from 400 to 4000 cm-1 at a
resolution of 4 cm-1. The particles were dried in vacuum and samples for FT-IR
measurement were prepared by the KBr pellet method 16. The elemental and chemical bonding states of the particles were studied by XPS (Axis-HIs, Kratos analytical). Argon ion etching of the samples was performed for 90 s at 1.33 × 10⁻⁵ Pa. Pre and post-etching measurement of the particles was recorded at 3.99 × 10⁻⁷ Pa to analyse the composition of the core particles and capping compounds around the particles.
~@~ill]~~~
@l[Jl]cQ]
2.5 Results and Discussion UV- Vis - NIR spectroscopy
Silver nanoparticles were successfully synthesised by mixing a leaf extract from
Prunus yedoensis with an aqueous solution of 1 mM AgNO3. The colour of the
solution changed from pale green to brown (Figure 2 (a)), which is an indication of the occurrence of the reduction reaction, noting that the brown colour is induced by the surface plasmon resonance (SPR) of Ag NPs 17. The time variation of the absorption spectrum of the solution during the synthetic procedure is shown in Figure 2 (b).
Figure 1. Photograph of aqueous solution of a leaf extract and purified
nanoparticles and the time variation of the absorption spectrum of the aqueous solution during the synthetic process of nanoparticles. A leaf extract from P.
yedoensis was mixed with aqueous solution of silver nitrate at time 0. (a)
Photograph of aqueous solution of a leaf extract (left) and purified nanoparticles (right). The colour changed from pale green at time 0 to brown 60 min after mixing. (b) Time variation of the absorption spectrum of the aqueous solution. The intensity of the peak in the absorption spectrum at around 430 nm gradually increased. Note that the peak intensity of the spectrum reached the unmeasurable range of the UV-Vis-NIR spectrophotometer 45 min after mixing. It is supposed that Ag NPs were gradually synthesised judging by the increase in the intensity of the SPR peak at around 430 nm 18 (Figure 3). In other words,
the leaf extract from Prunus yedoensis acted as a reducing agent of AgNO3. 400 500 600 700 800 0 1 2 3 Time [min] 0 5 10 15 20 25 30 35 40 45 A bs or ba nc e Wavelength [nm] 430nm (a) (b)
Figure 3 Absorption spectrum of purified Ag NPs dispersed in millipore water.
Transmission electron microscopy and scanning electron microscopy
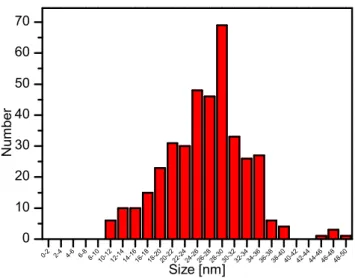
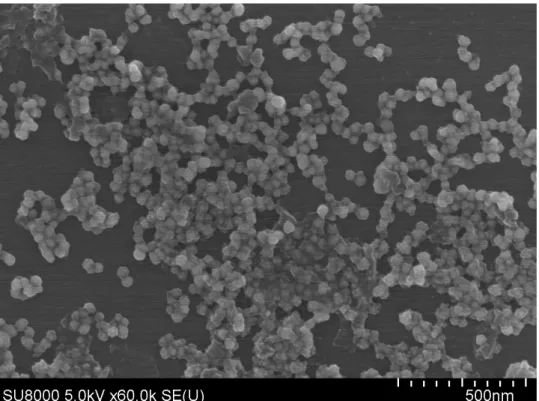
TEM images of as-synthesized particles are shown in Figure 4. Each particle was covered with a layer of some material, the component of which will be characterised later. The core particles were not perfectly spherical, but crystallised (Figure 4(c), 2(d)). According to the TEM image (Figure 4(c)), the selected area electron diffraction image (Figure 4(d)), The diameter of a core silver particle, which was measured from TEM images targeting at least 100 particles, was 26.3 ± 6.4 nm (see Figure 5 for the distribution of the diameter of the core particles), whereas the thickness of the layer covering the particles was 2.6 ± 0.5 nm (see Figure 6 for the distribution of the thickness of the layers). Note that particles of the order of several nanometers were also observed. In the Figure 7 scanning electron microscope image shows the as-synthesised particles were covered with a layer of material.
200 400 600 800 1000 0.0 0.5 1.0 1.5 2.0 A bs or ba nc e Wavelength [nm] 430 nm
Figure 4 TEM and SAED images of nanoparticles. (a) Wide view of
nanoparticles. The diameter of each particle is quite uniform. (b) Magnified image of a nanoparticle. A core particle is covered with a layer of some materials. (c) Lattice fringes. The gap between two neighbouring fringes is 0.23 nm, which coincides with that of silver. (d) SAED image. The indices indicate that the core particle is composed of silver.
Figure 5 Distribution of the diameter of the core Ag NPs.
Figure 6 Distribution of the thickness of capping layers
0-2 2-44-6 6-88-1010-1212-1414-1616-1818-2020-2222-2424-2626-2828-3030-3232-3434-3636-3838-4040-4242-4444-4646-4848-50 0 10 20 30 40 50 60 70 N um be r Size [nm] 0-0. 5 0. 5-1 1-1. 5 1. 5-2 2-2. 5 2. 5-3 3-3. 5 3. 5-4 4-4. 5 0 5 10 15 20 25 30 35 N um be r Size [nm]
Figure 7 Wide view of Ag NPs covered with a capping layer
X-ray diffraction
The crystalline structure of the core particles was face-centered cubic (FCC), noting that the X-ray diffractogram was in good agreement with the standard data of the Joint Committee on Powder Diffraction Standards (JC-PDF) file 4-783 19. It showed well-defined 2θ peaks at 38.14°, 44.48°, 64.42° and 77.64°,
which, respectively, correspond to (111), (200), (220), and (311) reflections (see
Figure 8). This data determine the crystal geometry of the core Ag NPs to be
face-centred cubic. The metallic nature of the Ag NPs confirmed by the XRD profile coincides with the previous study 20. According to the Debye-Scherrer
equation 21 the mean size of a crystal domain was calculated to be 10.3 nm
based on the full width at the half maximum (FWHM) of the (111) Bragg’s reflection.
Figure 8 X-ray diffractogram of as-synthesised nanoparticles.
Zeta potential
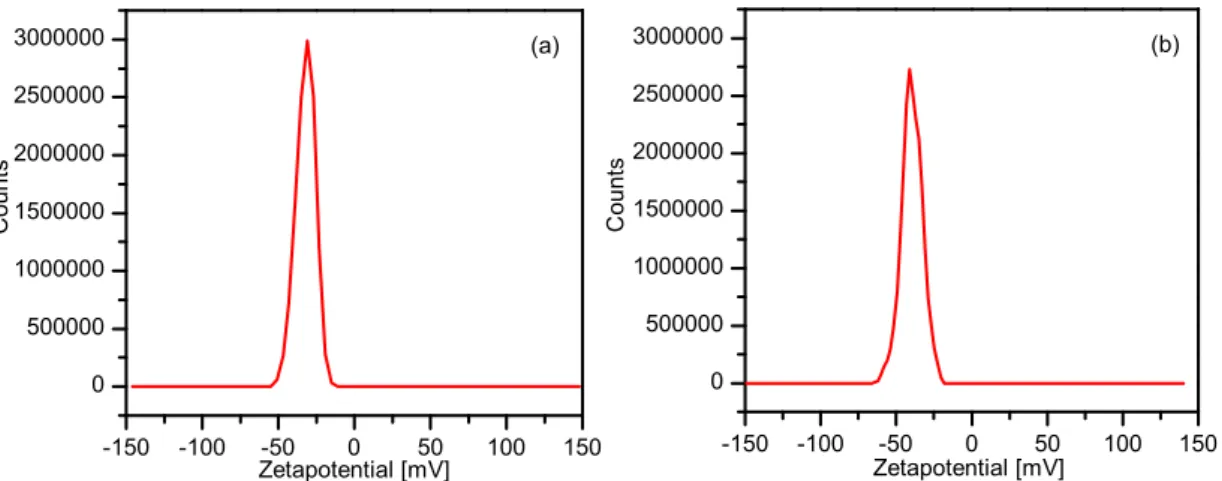
The Ag NPs were stably dispersed in water without any serious coagulation, judging by the visual observation of the solution (see Figure 2). In general, when the absolute value of the zeta potential of particles is lower than 20 mV, the particles tend to be unstable in the solution and the precipitation of particles occurs 22, whereas the particles are stably dispersed when the absolute value of the zeta potential is higher than 20 mV 23. In the present case, The zeta
potentials of the particles in millipore water measured immediately and 4 weeks after purification were, respectively, - 32.0 ± 6.3 and - 35.4 ± 7.0 mV and as a result, the Ag NPs were stably dispersed in millipore water (see Figure 9) 24.
30 40 50 60 70 80 90 0 100 200 300 (311) (220) (200) In te ns ity [ C P S ] 2θ [deg] (111)
Figure 9 Distributions of the zeta potentials of particles in millipore water
measured (a) immediate after purification of Ag NPs and (b) 4 weeks after purification.
Energy dispersive X-ray spectroscopy
The EDS spectrum showed a strong signal of Ag La at 3.0 keV, which confirms that the inner particles are composed of silver (Figure 10). The Carbon signal was detected from the organic layer capping around the particles and the grid, the Copper signal was detected from the grid.
Figure 10 Elemental analysis of nanoparticles by EDS.
-150 -100 -50 0 50 100 150 0 500000 1000000 1500000 2000000 2500000 3000000 Zetapotential [mV] C ou nt s (b) -150 -100 -50 0 50 100 150 0 500000 1000000 1500000 2000000 2500000 3000000 C ou nt s Zetapotential [mV] (a)
Fourier transform infrared spectroscopy
According to the FT-IR spectrum shown in Figure 11, the functional groups on the capping layers were very similar to those of the leaf extract. The peaks at around 3400 cm-1 (corresponding to O–H), 1600 cm-1 (C=O, C=C) and 1000 cm-1 (C–O) are in accordance with those of some flavonoids such as cathechin, epicathechin, isoquercitrin and cyanidin compounds 25-28 and therefore it is supposed that the capping layers were composed of flavonoids.
Figure 11 FT-IR spectra of as-synthesised particles (represented in red) and
the leaf extract (in blue). The peaks at around 3400, 1600 and 1000 cm-1, respectively, correspond to (O–H), (C=O, C=C) and (C–O).
X-ray photoelectron spectroscopy
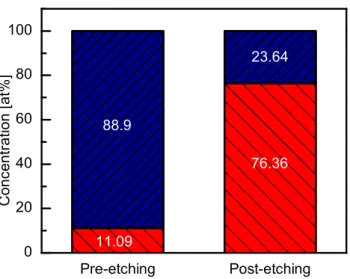
The XPS analysis depicts the elementary composition of the particles and the atomic percentage of carbon and silver were determined. According to the pre-etching and post-pre-etching XPS data; that is, the intensities of the peaks of Ag3p, Ag3d, O1s and C1s (Figure 12 (a)), the present particles are composed of Ag NPs conjugated with some materials containing carbon.
According to the Gaussian-Lorentzian curve fitting, in Figure 12 (c) the pre-etching peaks of C1s correspond to a binding energy of 284.9 eV. It is therefore supposed that alkyl carbon (C-C) or hydro carbon (C-H) were detected on the surface of the compounds capping the Ag NPs. The pre-etching and post-etching XPS data were analysed to define the chemical nature of pristine Ag NPs. Figure 12 (b) shows peaks of Ag3d core levels and the details are
4000 3500 3000 2500 2000 1500 1000 500 0 20 40 60 80 100 T ra ns m itt an ce [ % ] Wavenumbers [cm-1] O-H C=O,C=C C-O
summarised in Table 1 29. The peaks of Ag3d5/2 and Ag3d3/2 were fitted with
Gaussian-Lorentzian curves. The pre-etching data indicate the existence of Ag-O/Ag-C, whereas the post-etching data metallic Ag, noting that the binding energies of the pre-etching data shifted towards higher ones after etching, which confirms the conversion of Ag-O/Ag-C into metallic Ag 30. The FWHM values of the pre-etching data (broad peak) were lower than those of the post-etching data (narrow peak), which confirms the switching of Ag-O/Ag-C species to Ag-metal 31. The atomic percentages of silver and carbon were summarised in Figure 13. Ag 3d 5/2 B.E - FWHM Ag3d 3/2 B.E - FWHM Pre-etching 367.80 - 0.98 373.90 - 0.95 Post-etching 367.98 - 0.74 373.99 - 0.76
Table 1 Pre-etching and post-etching data of Ag3d 5/2 and Ag3d 3/2, representing the peak position of the binding energies (B.E.),
Figure 12 XPS spectra of as-synthesised particles measured under pre-etching
(represented in blue) and post-etching (red) conditions. (a) Overall spectra; (b) Ag3d; (c) C1s. 292 290 288 286 284 282 280 In te ns ity [ ar b. un its ]
Binding energy [eV] 284.9 (c) 376 374 372 370 368 366 364 In te ns ity [ ar b. un its ]
Binding energy [eV]
373.99 367.98 373.9 367.88 (b) 1000 800 600 400 200 0 C1s Ag3d Ag3p In te ns ity [ ar b. un its ]
Binding energy [eV] Ag3p
Ag3d
C1s O1s
Figure 13 Atomic percentages of silver and carbon composing nanoparticles.
Elemental analyses were carried out by XPS before and after etching of the nanoparticles. The red bars represent silver, whereas the blue ones carbon.
Biocompatibility investigation by an Alamar blue assay, cell staining and hemolysis study
A test cell line; L929, was cultured in a 25 cm3 flask, which contained Dulbecco’s modified eagle media (DMEM) (Gibco, Life Technologies) supplemented with 10% foetal bovine serum and 1% penicillin-streptomycin. The cells were seeded in 96-well plates with DMEM at a cell number density of 3 × 10³ and 5 × 10³ cells per well (CPW) and incubated for 48 and 24 h,
respectively. Then, the media were removed and replaced by fresh ones and the cells of 3 × 10³ and 5 × 10³ CPW were incubated in the presence of a
different concentration of particles; 0, 10, 20, 40, 80 and 100 µg mL-1, and a different concentration of the aqueous solution of the leaf extract; 0, 10, 20, 40, 80 and 100 µL mL-1 for 48 and 24 h, followed by treatment with an Alamar blue reagent for 3 h. The incubation was performed in an atmosphere of 5% CO2 at
37 °C. The fluorescence intensity of the solution was then measured using a multi detection micro plate reader (Powerscan HT, Dainippon Sumitomo pharma Co., Ltd, Japan) with an excitation wavelength of 530 nm and emission wavelength of 590 nm. The cells in the media in the absence of particles acted as the positive control. The metabolic activity and proliferation of cell line L929 in the presence of Ag NPs were analysed and Figure 14 (a) shows the cell
Pre-etching Post-etching 0 20 40 60 80 100 76.36 23.64 11.09 C o n ce n tr a tio n [ a t% ] 88.9
viability in the presence of the Ag NPs. Even in the case of high concentrations of Ag NPs used in the assay; i.e., 80 and 100 µg ml-1, the cell viability was still high, whereas in the case of the other lower concentrations of Ag NPs, the particles’ cytotoxicity was very low. Note that the leaf extract also showed its high biocompatibility (Figure 14 (b)). The present result is in good agreement with the one previously reported by Moulton et al 32, where the biocompatibility of of green synthesized Ag NPs was investigated using HaCaT cells. There have been several reports showing evidence of a high biocompatibility of surface modified or capped Ag NPs 33-35, whereas on the contrary, naked Ag NPs exhibited cytotoxicity and genotoxicity 36-38.
Figure 14 Viability of cell line L929 estimated by an Alamar blue assay. (a)
Viability of cells cultivated in the presence of Ag NPs. (b) Viability of cells cultivated in the presence of the leaf extract. The blue bars represent the cell viability assessed using 5000 cells per well incubated for 24h, whereas the red ones the cell viability estimated using 3000 cells per well incubated for 48 h.
In addition to the Alamar blue assay, the cell viability of cell line L929 in the presence of a different concentration of Ag NPs was investigated using a fluorescent stain; It was also performed using calcein-AM (Dojindo Molecular Technologies Inc.) and propidium iodide (Dojindo Molecular Technologies Inc.) to determine the cell viability which induce green and red fluorescence, respectively, for alive and dead cells 39. Initially, cells of 5 × 10³ CPW were seeded in a 96-well plate with DMEM and incubated for 24 h in an atmosphere of 5% CO2 at 37 °C. Then, the media were removed and replaced by fresh ones
and the cells of 5 × 10³ CPW were incubated with a different concentration of particles; 0, 10, 20, 40, 80 and 100 µg mL-1, and a different concentration of the aqueous solution of the leaf extract; 0, 10, 20, 40, 80 and 100 µL mL-1, for 24 h. 100 µL of calcein AM (2 µmol) / propidium iodide stain (4 µmol) was introduced into each well and the cells were incubated for 15 min. Fluorescence images were captured using a confocal laser scanning microscope (A1si+, Nikon Corp.) with an excitation wavelength of 488 and 561 nm. The confocal fluorescence images shown in Figure 15 indicates that the present Ag NPs did not promote any adverse effect on the proliferation of the test cell line and leaf extract also did not promote any adverse effect (Figure 16).
Figure 15 Confocal fluorescence images of cell line L929 in the presence of Ag
NPs. (a) Bright field images. (b) Alive cells (green). (c) Dead cells (red). The scale bar represents 200 µm.
Figure 16 Confocal fluorescence images of cell line L929 in the presence of the
leaf extract without any particles. (a) Bright field images. (b) Alive cells (green). (c) Dead cells (red). The scale bar represents 200 µm.
Hemocompatibility of the Ag NPs was also examined using sheep’s and rabbits’ RBCs for further confirmation of biocompatibility of the Ag NPs and the study was carried out as follows 40. RBCs were separated from fresh sheep’s and
(PBS) (10 mL) was added to the RBCs, then followed by centrifugation twice at 1500 rpm for 5 min. The RBCs were suspended in PBS (10 mL). The RBCs’ suspension (900 µL) was added to the particles/PBS solution (100 µL), the concentration of the particles of which was set at 10, 20, 40, 80 or 100 µg mL-1, and the RBCs’ suspension was also added to the leaf extract/PBS solution (100 µL) of 10, 20, 40, 80 or 100 µL mL-1. The solution was introduced into 2 mL centrifuge tubes and incubated under a gentle rotation at 37 ºC for 60 min. The tubes were finally centrifuged at 1500 rpm for 5 min at 20 ºC and the absorption of incident photons of 540 nm wavelength was measured using the UV-Vis-NIR spectrophotometer (DU 730, Beckman coulter). An aqueous solution of RBCs with Triton X-100 (Sigma-Aldrich, Japan) was used as the positive control.
The hemolytic activity of the Ag NPs was determined by the amount of hemoglobin released from the RBCs in the presence of Ag NPs, which is shown in Figure 17. Hemolysis of the Ag NPs and leaf extract which was normalised by the positive control 41, was only 10 % even when the concentration of Ag
NPs was as high as 100 µg ml-1. We suppose that the hemocompatibility of the Ag NPs was high, thanks to the organic compounds probably flavonoids capping the Ag NPs 42 and therefore we believe that the present Ag NPs can be
used for biomedical studies 43.
Figure 17 Effect of the concentration of particles on the hemolytic activity. The
blue bars represent sheep’s RBCs, whereas red ones rabbit’s RBCs. RBCs incubated with Triton X-100 acted as the positive control.
0 20 40 60 80 100 Concentration of particles [80 40 µ20g mL-1]10 Control 100 H e m o ly si s [% ]
Application of Ag NPs in antibacterial activity and SERS assay Antibacterial assay
To examine the antibacterial activity of the particles, the time variation of the bacterial growth was measured, culturing two bacterial species; Escherichia coli at 37 ºC and Bacillus subtilis at 30 ºC, in Nutrient broth No.2 (Oxoid) media supplemented with the aqueous solution of particles of 2, 4, 8 or 16 µg mL-1, and with a leaf extract solution of 2, 4, 8 or 16 µL mL-1 for 16 h. The optical density (O.D) values at 600 nm were recorded every 30 min using an OD-Monitor (C&T, Taitec Corp.) and the growth curves were obtained.
The time variations of the bacterial growth for up to 4 h 30min are shown in Figure 18 (a) (b). Figure 19 (a) (b) shows the time variations of the bacterial growth for 16 h. The growth of both Bacillus subtilis (Gram-positive) and
Escherichia coli (Gram-negative) was reduced in the presence of Ag NPs even
when the concentration of the particles was as low as 16 µg ml-1, noting that the
antibacterial effect of the leaf extract was not significant (Figure 19 (c) (d)).It is therefore supposed that the present Ag NPs possess some antibacterial activity, which corroborates with the study of Liong et al. 44. Antibacterial activity of the encapsulated silver nanocrystals and their interaction towards both the gram positive and gram negative bacterial cells was previously discussed by Liong et al, which implies to the present report on Ag NPs44. I Sondi et al.
reported that the bacterial growth was not completely inhibited by Ag NPs in a liquid medium and it was obvious in the present study that the growth rate was delayed as the concentration of the Ag NPs increased 45; 46.
Figure 18 Time variations of the growth of bacteria. (a) Growth of Escherichia
coli in the presence of Ag NPs. (b) Growth of Bacillus subtilis in the presence of
Ag NPs. (c) Growth of Escherichia coli in the presence of the leaf extract. (d) Growth of Bacillus subtilis in the presence of the leaf extract.
Figure 19 Time variation of the growth of bacteria. (a) Escherichia coli (b)
Bacillus subtilis. 1 2 3 4 5 0.0 0.1 0.2 0.3 0.4 Control 2 µg mL-1 4 µg mL-1 8 µg mL-1 16 µg mL-1 O D 6 00 Time [h] (a) 1 2 3 4 5 0.0 0.1 0.2 0.3 0.4 Control 2 µg mL-1 4 µg mL-1 8 µg mL-1 16 µg mL-1 O D 6 00 Time [h] (b) 1 2 3 4 5 0.0 0.1 0.2 0.3 0.4 0.5 Control 2 µL mL-1 4 µL mL-1 8 µL mL-1 16 µL mL-1 O D 6 00 Time [h] (c) 1 2 3 4 5 0.0 0.1 0.2 0.3 0.4 0.5 Control 2 µL mL-1 4 µL mL-1 8 µL mL-1 16 µL mL-1 O D 6 00 Time [h] (d) 2 4 6 8 10 12 14 16 18 0.0 0.1 0.2 0.3 0.4 0.5 0.6 0.7 0.8 Control 2 µg mL-1 4 µg mL-1 8 µg mL-1 16 µg mL-1 O D 6 00 Time [h] (a) 2 4 6 8 10 12 14 16 18 0.0 0.2 0.4 0.6 0.8 1.0 1.2 Control 2 µg mL-1 4 µg mL-1 8 µg mL-1 16 µg mL-1 Time [h] O D 6 00 (b)
Surface enhanced Raman scattering
The SERS characteristics were investigated using an aqueous solution of rohdamine B. 0.1 mM rohdamine B solution was dropped onto dried Ag NPs and a layer of the leaf extract placed on a glass substrate and Raman spectra were obtained using a micro-Raman spectroscopic system (Lab Ram HR800UV, Horiba Jobin Yvon S.A.S.) with an excitation wavelength of 633 nm. The spot diameter and power of the laser beam were, respectively, 2 µm and 48 µW and the spectra were obtained with a 2-sec integration.
Raman spectra of an aqueous solution of rhodamine B, which was dropped onto Ag NPs placed on a glass substrate, was obtained, the result of which is shown in Figure 20. It is clearly shown that Raman signals were greatly enhanced in the presence of Ag NPs and therefore the present particles are highly SERS active, whereas there was no recognizable signals of rhodamine B when it was dropped on the surface of the glass substrate and the leaf extract alone.
Raman shift (cm-1) 47 Lit Ag NPs Assignment 1648 1648 Aromatic C−C stretching 1529 1530 1506 1507 1433 1437 1356 1358
1280 1280 C−C bridge band stretching
1201 1201 Aromatic C−H bending
620 622 Aromatic bending
Figure 20 Raman spectra of 0.1 mmol aqueous solution of rhodamine B. The
red curve represents a Raman spectrum of the rhodamine B solution dropped on dried Ag NPs, whereas the green and blue curves the spectra of the solution dropped on a dried leaf extract and on the glass substrate. Sharp peaks at 622, 1201, 1280, 1358, 1437, 1507, 1530, and 1648 cm-1 are typical ones of rhodamine B. 600 800 1000 1200 1400 1600 16 48 15 30 15 07 14 37 13 58 12 80 12 01 62 2 Raman shift [cm-1] In te ns ity [ ar b. un its ]
2.6 Conclusion
Ag NPs were synthesised by mixing a leaf extract from P. yedoensis with aqueous solution of AgNO3. The particles showed their high dispersibility in
water, biocompatibility, surface enhanced Raman scattering activity and antibacterial activity. We believe that the significant features possessed by the present Ag NPs were derived from the properties of both organic compounds capping the particles and core particles and therefore the Ag NPs may well be actively utilised in the field of biomedicine; e.g., as nano agents for bio-imaging, nano media for photothermal therapy, nano vehicles for drug delivery and detectors of biomolecules and biomaterials. It is also inferred from the previous and present studies that metal-filling organic compounds nanoparticles may commonly be synthesised via bio-reduction using plants’ extracts.
References
1. H. Innan, R. Terauchi, N. T. Miyashita and K. Tsunewaki, 1995, 70, 185-196.
2. M. S. Roh, E. J. Cheong, I. Y. Choi and Y. H. Joung, Scientia
Horticulturae, 2007, 114, 121-128.
3. S. Ohta, S. Osumi, T. Katsuki, I. Nakamura, T. Yamamoto and Y. I. Sato,
Journal of the Japanese Society for Horticultural Science, 2006, 75,
72-78.
4. D. Ahn, Illustrated Book of Korean Medicinal Herbs, Seoul: Kyohak publishing, 1998.
5. J. Kim, Illustrated Natural Drugs Encyclopedia. color edition, Seoul: Namsandang, 1997.
6. H. S. Yook, K. H. Kim, J. E. Park and H. J. Shin, American Journal of
Chinese Medicine, 2010, 38, 937-948.
7. K. Jo, S. E. Lee, S. W. Lee and J. K. Hwang, Natural Product Research, 2012, 26, 1610-1615.
8. R. Hegnauer, Biochemistry Systematics and Ecology, 1973, 1, 191-197. 9. N. Ishikura, Phytochemistry, 1972, 11, 2555-2558.
10. N. Ishikura, Y. Watanabe and S. Teramoto, The Botanical Magazine,
Tokyo, 1989, 102, 547-560.
11. HyunAhJung, HaeYoungChung, AeRaKim and JaeSueChoi, Archives of
Pharmacal Research, 2002, 25, 865-872.
12. J. Lee, G. Yang, K. Lee, M. H. Lee, J. W. Eom, I. Ham and H. Y. Choi,
Bmc Complementary and Alternative Medicine, 2013, 13, 9.
13. Y. Q. Zhang, L. Guan, Z. Y. Zhong, M. Chang, D. K. Zhang, H. Li and W. Lai, International Journal of Cosmetic Science, 2014, 36, 527-530.
14. K. Lee, I. Ham, G. Yang, M. Lee, Y. Bu, H. Kim and H. Y. Choi, Bmc
Complementary and Alternative Medicine, 2013, 13, 6.
15. T. Ito and K. Kumazawa, Bioscience, Biotechnology, and
Biochemistry, 1995, 59, 1944-1945.
16. N. B. Colthup, L. H. Daly and S. E. Wiberley, Introduction to Infrared and
17. P. Mulvaney, Langmuir, 1996, 12, 788-800.
18. R. R. Naik, S. J. Stringer, G. Agarwal, S. E. Jones and M. O. Stone,
Nature Materials, 2002, 1, 169-172.
19. P. Velmurugan, S. M. Lee, M. Iydroose, K. J. Lee and B. T. Oh, Applied
Microbiology and Biotechnology, 2013, 97, 361-368.
20. S. Elzey and V. H. Grassian, Journal of Nanoparticle Research, 2010,
12, 1945-1958.
21. P. Scherrer, Bestimmung der Gro¨ße und der inneren Struktur von
Kolloidteilchen mittels Ro¨ntgenstrahlen. Nachrichten von der Gesellschaft der Wissenschaften zu Go¨ttingen,
Mathematisch-Physikalische Klasse, 1918.
22. A. M. El Badawy, T. P. Luxton, R. G. Silva, K. G. Scheckel, M. T. Suidan and T. M. Tolaymat, Environmental Science & Technology, 2010, 44, 1260-1266.
23. J. Eastoe, in Micro Emulsions, ed. T. Cosgrove, 2005, ch. 5, pp. 77-97. 24. A. K. Suresh, M. J. Doktycz, W. Wang, J. W. Moon, B. H. Gu, H. M.
Meyer, D. K. Hensley, D. P. Allison, T. J. Phelps and D. A. Pelletier, Acta
Biomaterialia, 2011, 7, 4253-4258.
25. M. M. Ramos-Tejada, J. D. G. Duran, A. Ontiveros-Ortega, M. Espinosa-Jimenez, R. Perea-Carpio and E. Chibowski, Colloids and Surfaces
B-Biointerfaces, 2002, 24, 297-308.
26. A. M. Mendoza-Wilson and D. Glossman-Mitnik, Journal of Molecular
Structure-Theochem, 2006, 761, 97-106.
27. J. T. Han, M. H. Bang, O. K. Chun, D. O. Kim, C. Y. Lee and N. I. Baek,
Archives of Pharmacal Research, 2004, 27, 390-395.
28. L. K. Singh, T. Karlo and A. Pandey, Spectrochimica Acta Part
a-Molecular and Biomolecular Spectroscopy, 2014, 118, 938-943.
29. C. D.Wagner, W. M. Riggs, L. E. Davis, J. F. Moulder and G. E. Muilenburg, Handbook of X-ray Photoelectron Spectroscopy, Perkin-Elmer Corp., Physical Electronics Division: Eden Prairie, Minnesota, 1979.
30. Y. L. Mikhlin, E. A. Vishnyakova, A. S. Romanchenko, S. V. Saikova, M. N. Likhatski, Y. V. Larichev, F. V. Tuzikov, V. I. Zaikovskii and S. M. Zharkov, Applied Surface Science, 2014, 297, 75-83.
31. T. Miyama and Y. Yonezawa, Journal of Nanoparticle Research, 2004, 6, 457-465.
32. M. C. Moulton, L. K. Braydich-Stolle, M. N. Nadagouda, S. Kunzelman, S. M. Hussain and R. S. Varma, Nanoscale, 2010, 2, 763-770.
33. P. K. Prabhakar, S. Raj, P. R. Anuradha, S. N. Sawant and M. Doble,
Colloids and Surfaces B-Biointerfaces, 2011, 86, 146-153.
34. E. I. Alarcon, K. Udekwu, M. Skog, N. L. Pacioni, K. G. Stamplecoskie, M. Gonzalez-Bejar, N. Polisetti, A. Wickham, A. Richter-Dahlfors, M. Griffith and J. C. Scaiano, Biomaterials, 2012, 33, 4947-4956.
35. A. Mandal, V. Meda, W. J. Zhang, K. M. Farhan and A. Gnanamani,
Colloids and Surfaces B-Biointerfaces, 2012, 90, 191-196.
36. M. Ahamed, M. S. AlSalhi and M. K. J. Siddiqui, Clinica Chimica Acta, 2010, 411, 1841-1848.
37. P. V. AshaRani, G. L. K. Mun, M. P. Hande and S. Valiyaveettil, Acs
Nano, 2009, 3, 279-290.
38. R. de Lima, A. B. Seabra and N. Duran, Journal of Applied Toxicology, 2012, 32, 867-879.
39. T. Schatton, G. F. Murphy, N. Y. Frank, K. Yamaura, A. M. Waaga-Gasser, M. Waaga-Gasser, Q. Zhan, S. Jordan, L. M. Duncan, C. Weishaupt, R. C. Fuhlbrigge, T. S. Kupper, M. H. Sayegh and M. H. Frank, Nature, 2008, 451, 345-U311.
40. V. Stanic, D. Janackovic, S. Dimitrijevic, S. B. Tanaskovic, M. Mitric, M. S. Pavlovic, A. Krstic, D. Jovanovic and S. Raicevic, Applied Surface
Science, 2011, 257, 4510-4518.
41. A. Mishra, N. K. Kaushik, M. Sardar and D. Sahal, Colloids and Surfaces
B-Biointerfaces, 2013, 111, 713-718.
42. J. M. Zook, M. D. Halter, D. Cleveland and S. E. Long, Journal of
43. Y. K. Chen, X. B. Zheng, Y. T. Xie, C. X. Ding, H. J. Ruan and C. Y. Fan,
Journal of Materials Science-Materials in Medicine, 2008, 19, 3603-3609.
44. M. Liong, B. France, K. A. Bradley and J. I. Zink, Advanced Materials, 2009, 21, 1684-+.
45. I. Sondi and B. Salopek-Sondi, Journal of Colloid and Interface Science, 2004, 275, 177-182.
46. J. A. Lemire, J. J. Harrison and R. J. Turner, Nature Reviews
Microbiology, 2013, 11, 371-384.
47. J. T. Zhang, X. L. Li, X. M. Sun and Y. D. Li, Journal of Physical
Chemistry B, 2005, 109, 12544-12548.
Chapter 3
Synthesis of nanoparticles composed of silver
and silver chloride for a plasmonic photocatalyst
using an extract from a weed Solidago altissima
(golden rod).
Abstract
Phyto synthesis of nanomaterials is advantageous since it is economical, eco-friendly and simple and, what is more, in the synthetic protocols, non-toxic chemicals and biocompatible materials are used. Here, a green synthetic methodology of nanoparticles composed of silver and silver chloride (Ag@AgCl NPs) is developed using a leaf extract of Solidago altissima as a reducing agent. Utilisation of a terrestrial weed for the synthesis of Ag@AgCl NPs is a novel environmentally friendly approach considering that no toxic chemicals, external halide source or elaborate experimental procedures are included in the process. The optical properties and elemental compositions of as-synthesised Ag@AgCl NPs are well characterised and the degradation of an organic dye; i.e., Rhodamine B (RhB), is investigated using the Ag@AgCl NPs. We find that degradation of RhB is effectively achieved thanks to both surface plasmon resonance and semiconductor properties of Ag@AgCl NPs. The surface-enhanced Raman scattering and anti-bacterial activities are also examined.
3.1 Introduction
Weed species would in general cause hazardous situations on agricultural lands, which may eventually trigger loss of native biodiversity as well as serious economic damage 1 2. A terrestrial weed; Solidago altissima, belonging to the Asteraceae (Compositae) family, is commonly called golden rod. S. altissima is a native plant of North America and became a common alien plant in Japan several hundred years ago 3. It is well known that S. altissima can grow in agricultural fields under various conditions, and the growth of rice seedlings, for example, can be seriously inhibited by S. altissima, which is mainly caused by allelo-chemicals such as 2-cis-dehydromatricaria ester (cis-DME) and methyl-10-(2-methyl-2-butenoyloxy)-2-cis-8-cis-decadiene-4,6-diynoate 4 5 , released from its rhizomes.
Phyto synthesis of nanomaterials would be advantageous in such a sense that it is economical, eco-friendly and simple and, what is more, in the synthetic protocols, non-toxic chemicals 6, 7 and biocompatible 8 materials are
used. Synthesis of metal nanoparticles using such green protocols is in great demand 9 since no toxic chemicals are emitted into the environment 10 and the synthetic devices can be easily scaled up since the procedures do not require any extreme conditions such as high pressure, energy and temperature. A variety of plant species have been used in the synthesis of nanoparticles 11 and
it is known that Ag@AgCl NPs can also be phyto synthesised 12.
Ag@AgCl NPs were synthesised based on a green protocol using an extract of S. altissima for the first time. The structures and elements of the particles are well characterized and the photocatalytic activity of as-synthesized Ag@AgCl NPs is examined using Rhodamine B (RhB). We find that the degradation of RhB is effectively achieved thanks to both SPR and semiconductor properties of Ag@AgCl NPs. The surface enhanced Raman scattering (SERS) and anti-bacterial activities are also investigated. We suppose that the present approach to the synthesis of nanoparticles using a weed may encourage the utilisation of hazardous plants for the creation of novel nanomaterials, and that this may also help in the battle to conserve Nature.
Highlights:
Aqueous leaf extract of a terrestrial weed was used in the synthesis and it acted as both reducing agent and halide supplement.
Photo reduction during the synthesis has a notable influence on synthesis of Ag@AgCl NPs.
Efficient photocatalytic performance.
Antibacterial efficacy is quite high against both negative and gram-positive bacteria.
3.2 Phyto synthesis of Ag-AgCl NPs
Fresh plant leaves of S. altissima were collected on the Kawagoe Campus, Toyo University, Japan and cleaned with millipore water to remove the surface contaminants. 10 g of leaf pieces were heated in 100 mL of millipore water at 90 ºC for 90 min, followed by filtration (Whatman Cat No 1002-185) to obtain an aqueous plant leaf extract. The leaf extract was refrigerated at 4°C for further use. 20 mL of the aqueous leaf extract was mixed with 60 mL of 1 mM aqueous solution of silver nitrate (AgNO3) (Sigma-Aldrich, Japan) at 4°C,and the mixture
was stirred for 30 min in the dark and then exposed to light (Power density: 1 sun = 100 mW cm-2, Exposed area: 3 × 3 cm2) (HAL 320, Asahi spectra Co., Ltd.) for 30 min. The mixture was centrifuged at 15000 rpm for 40 min to pelletize the product. The pellet was purified by dispersing it in millipore water, followed by centrifugation at 15000 rpm for 40 min.
3.3 Characterisation of Ag@AgCl NPs
The optical properties of as-synthesised NPs were characterized by an ultraviolet-visible-near infrared (UV-Vis-NIR) spectrophotometer (DU 730, Beckman Coulter) in the range from 200 to 1000 nm at a resolution of 1 nm, and a UV diffuse reflectance spectroscope (DH2000-DUV, USB2000, Ocean Optics Inc) in the range from 250 to 600 nm. The morphology of the particles was analyzed using a transmission electron microscope (TEM) (JEM2200FS, JEOL) at an acceleration voltage of 200 kV with a scan snap & orius camera and software (Gatan). Samples for TEM observation were prepared on a carbon coated copper grid (Cu 200 mesh, JEOL), dropping and drying nanoparticles’ suspension on the grid. The elemental composition of the particles was analyzed by energy dispersive X-ray spectroscopy (EDS) (SU6600, Hitachi equipped with OXFORD X- MaxN). The crystal nature of the particles was determined by an X-ray diffractometer (XRD) (Smart Lab, Rigaku), using a Cu Kα X-ray of 0.154 nm wavelength supplied by a 9 kW rotating Cu anode X-ray generator, and employing a grazing-incidence X-ray diffraction geometry with a scanning diffraction angle (2θ) from 25° to 90° at 1.5° min-1 at an incident angle of 0.1°. The elemental and chemical bonding states of the nanoparticles were studied by an X-ray photoelectron spectroscope (XPS) (Axis-HIs, Kratos analytical) equipped with a non-monochromatic Al Kα X-ray of an energy of 1486.61 eV, pass energy of 80 eV and step energy of 0.1 eV at lower than 1.0 × 10⁻⁸ Torr. Samples for XPS were prepared on a hydro fluoric acid treated silicon wafer, dropping and drying nanoparticles’ suspension on the wafer. The photo luminescence spectra (PL) of the particles were determined, using a spectrofluormeter (FP 6500, Jasco).
Characterisation of a leaf extract
The chemical functional groups of the organic compounds responsible for the reduction reaction were analysed by Fourier transform infrared spectroscopy (FT-IR) (Nicolet iS50, Thermo Fischer Scientific), scanning the IR from 400 to 4000 cm-1 at a resolution of 4 cm-1. The leaf extract was centrifuged at 15000 rpm for 45 min, the supernatant was removed and the pellet was dried in vacuum. Samples for FT-IR measurement were prepared by the KBr pellet method 13. The elemental composition of the leaf extract was analysed by EDS and XPS. Samples for EDS and XPS were prepared on a hydro fluoric acid treated silicon wafer, dropping and drying an aqueous leaf extract on the wafer.
~®~lliJ~U~
@)[fi]cQ]
3.4 Results and Discussion Synthesis of Ag@AgCl NPs
Ag@AgCl NPs were successfully synthesised by the following two-step procedure; (1) The reduction of Ag+ (AgNO3)using an aqueous leaf extract of S.
altissima to synthesise AgCl NPs, and (2) the photo reduction of AgCl NPs to
synthesise Ag@AgCl NPs. The chemical compounds present in the aqueous leaf extract such as terpenoids 14, glycosides 15, 16, acetylenes 17, 18, phenols 3 and components containing chlorine (Cl-) 19 were supposed to be responsible for the reduction reaction 20 21 to synthesise AgCl NPs in the first procedure, noting that no external chlorine components or any additional chemicals were supplied during the synthesis (see Figure 1 for FTIR, EDS and XPS analyses of the leaf extract). FTIR spectrum of a leaf extract is shown in Figure 1(a). The peak positions corresponds to 3354.07 cm-1 (N-H, stretch), 2921.79 and 2851.17 cm-1 (C-H, stretch), 1640.75 cm-1 (N-H, bend), 1384.19 and 1327.46
cm-1 (S=O), 1156.92 and 1076.78 cm-1 (C-O), 781.52 cm-1 (C-Cl), 611.77 and
521.64 cm-1 (C-X) 22. Note that the peak at 781.52 cm-1 represents chlorine related compounds. The EDS spectrum of a leaf extract is shown in Figure 1(b). The peak positions represent phosphorous, sulfur and chlorine that were present in the leaf extract. The XPS data; i.e., the peaks of C1s, O1s and Cl2p, show that the present leaf extract was composed of some compounds bonded with carbon, oxygen and chlorine (see Figure 1(c)). Figure 1(d) shows two peaks corresponding to Cl2p3/2 and Cl2p1/2 centered at 198.29 and 199.95,
which represent chorine related components are present in the leaf extract23. The peaks of C1s correspond to a binding energy of 284.6, 286.06, 293.09 and 295.72 eV (see Figure 1(e)).
Figure 1. Characterisation of a leaf extract. (a) FTIR spectrum, (b) EDS
spectrum, (c),(d),(e) XPS spectra.
The second procedure was performed by irradiation of light into the reaction mixture. Ag@AgCl NPs were synthesised owing to the high photosensitivity of AgCl 24 25. A pair of electron and hole are generated in AgCl
via photon activation, and therefore it is supposed that the photogenerated electron promoted the conversion of Ag+ ion into Ag0 atom 25-27, resulting in the
was confirmed by the time variation of the UV-Vis-NIR spectrum of the reaction mixture during the synthetic procedure. As shown in Figure 2, the time variation of the peak intensity observed in the visible region depicts the gradual synthesis of Ag@AgCl NPs. Figure 3 shows the UV-Vis-NIR spectrum of the purified Ag-AgCl NPs dispersed in millipore water, where the plasmonic resonance peak at 462 nm is attributed to Ag, whereas the absorption peak at 246 nm to AgCl 28. The UV-Vis diffuse reflectance spectrum of dried Ag@AgCl NPs shows some absorbance in the visible light region due to surface plasmon resonance (SPR) in metallic Ag clusters in the powders 29, while the absorbance in the UV region is caused by AgCl NPs coupled with Ag NPs (see Figure 4) 30, which suggests that the present Ag@AgCl NPs can be used as an effective plasmonic photo catalyst in visible light 31.
UV-Vis-NIR Spectroscopy and UV-Vis diffuse reflectance spectroscopy
Figure 2. UV-Vis-NIR spectra of reaction mixture at regular intervals of time.
The absorption peak at 462 nm increases gradually, representing the growth of Ag@AgCl NPs during the synthesis.
Figure 3. Absorption spectrum of purified Ag@AgCl NPs dispersed in millipore
water.
Figure 4. Absorption spectrum of dried Ag@AgCl NPs on a silicon substrate.
Spectroflourometery
The PL spectrum of the Ag@AgCl NPs at room temperature (24 ± 2 ºC) showed emission bands at 318 and 470 nm when excited with photons of 200 nm wavelength, which also clarifies the semiconductor features of the present Ag@AgCl NPs (Figure 5).