Title
Studies on the Roles of MicroRNA-145 in Canine and Human
Cancers( 本文(Fulltext) )
Author(s)
山田, 名美
Report No.(Doctoral
Degree)
博士(獣医学) 甲第403号
Issue Date
2013-09-24
Type
博士論文
Version
ETD
URL
http://hdl.handle.net/20.500.12099/47367
※この資料の著作権は、各資料の著者・学協会・出版社等に帰属します。Studies on the Roles of MicroRNA-145
in Canine and Human Cancers
(MicroRNA-145 のイヌおよびヒト悪性腫瘍
に お け る 機 能 解 析 に 関 す る 研 究
)
2013
The United Graduate School of Veterinary Sciences, Gifu University
(Gifu University)
CONTENTS
ABBREVIATIONS
4
GENERAL INTRODUCTION
5
Chapter 1. Basic Study for Fascin-1 Targeting Therapy Using
MicroRNA-145 in Canine Malignant Melanoma
12
1-1. INTRODUCTION
13
1-2. MATERIALS and METHODS
16
1-3. RESULTS
20
1-4. DISCUSSION
23
FIGURES and TABLES
25
SUMMARY
33
Chapter 2. Catenin δ-1 as a Novel Target Gene of MicroRNA-145
to Regulate Wnt/β-catenin Signaling in Human Colon Cancer
Cells
34
2-1. INTRODCTION
35
2-2. MATERIALS and METHODS
37
2-3. RESULTS
44
FIGURES
54
SUMMARY
64
CONCLUSIONS
65
ACKNOWLEDGMENTS
68
REFERENCES
70
SUMMARY in English
75
SUMMARY in Japanese
79
ABBREVIATIONS
Apc, adenomatous polyposis coli
GAPDH, glyceraldehyde 3-phosphate dehydrogenase GTP, guanosine triphosphate
HRP, horseradish peroxidase
LEF/TCF, lymphoid enhancer factor/T-cell factor mRNA, messenger ribonuclease
c-Myc, v-myc myelocytomatosis viral oncogene homolog (avian) ORF, open reading frame
PAK4, p21-activated kinase 4 PVDF, polyvinylidene difluoride
RT-PCR, reverse transcription-polymerase chain reaction TRAIL, TNF-related apoptosis-inducing ligand
UTR, untranslated region
GENERAL INTRODUCTION
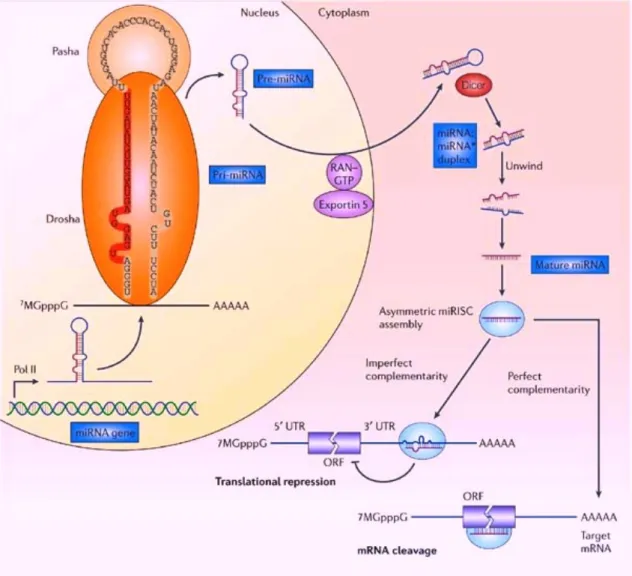
MicroRNAs (miRNAs or miRs) are non-coding single-stranded RNAs of 18-25 nucleotides and constitute a novel class of gene regulators that are highly conserved beyond species (8, 13). They negatively regulate their targets in two ways depending on the degree of complementarity between the miRNA and the target. As shown in Figure 1, miRNAs are generally transcribed by RNA polymerase Ⅱ (Pol Ⅱ) in the nucleus to form large primary-miRNA (pri-miRNA) transcripts, which are capped (7MGpppG) and
polyadenylated (AAAAA). These pri-miRNA transcripts are processed by the RNase Ⅲ enzyme Drosha and its co-factor Pasha, and become the precursor-miRNA (pre-miRNA), which are less than 70-nucleaotide. RAN-GTP and exportin 5 transport the pre-miRNA in to the cytoplasm. Subsequently, another RNase Ⅲ enzyme, Dicer, processes the pre-miRNA to generate a transient 22-25 nucleotide miRNA:miRNA* duplex. This duplex is then loaded into the miRNA-associated multiprotein RNA-induced silencing complex (miRISC), which includes the Argonaute proteins. The mature single-stranded miRNA is preferentially retained in this complex. The mature miRNA then binds to complementary sites in the mRNA target to negatively regulate gene expression in two ways depending on the degree of complementarity between the miRNA and its target. The miRNAs that bind to mRNA
targets with imperfect complementarity block target gene expression at the level of protein translation. Complementary sites for miRNAs using this mechanism are generally found in the 3’-untranslated regions (3’UTRs) of the target mRNAs. The miRNAs that bind to their mRNA target sites with perfect (or nearly perfect) complementarity induce target-mRNA cleavage. Complementary sites for miRNAs using this mechanism are generally found in the coding sequence or open reading frame (ORF) of the target mRNAs. The 5’ end of the miRNA is crucial for the stability and proper loading of the miRNA into the miRISC, and is also important for biological function. Therefore, most bioinformatics algorithms use a “miRNA seed” that encompasses the first 2-8 bases of the mature miRNA sequence to search for complementarity to sequences in the 3’UTR of all mRNAs. A single miRNA might bind to as many as 200 target genes that have various biological functions including transcription factors, secreted factors, receptors and transporters. Therefore, miRNAs potentially control the expression of about one-third of human mRNAs.
It has been shown that miRNAs control cell growth, differentiation, and apoptosis; consequently, impaired miRNA expression has been implicated in carcinogenesis, and miRNAs that are associated with cancer are referred to as “oncomirs” or “anti-oncomirs”. As shown in Table 1, aberrant expressions of miRNAs in various human cancers
have been reported. Thus, oncomirs and anti-oncomirs are likely to have a significant effect on gene therapies that are designed to block cancer progression. Because spontaneous cancers in pet dogs and humans share many features, including histological appearance, tumor genetics, molecular targets, biological behavior, and response to conventional therapies, canine spontaneous cancer is considered an ideal model of human cancer. As mentioned above, many miRNAs are conserved beyond species, and concerning to my focusing miRNA, miR-145, hsa-miR-145 is coded in human chromosome 5 and cfa-miR-145 is coded in canine chromosome 4, and they have completely matched sequences, 5’-guccaguuuucccaggaaucccu-3’. It was previously confirmed that miR-145 commonly down-regulated in canine melanoma tissues and cell lines, and human colon cancer tissues compared with their normal counterparts (Figure 2A, 2B). Furthermore, it has been indicated that in canine melanoma, miR-145 was directly targeting c-Myc and Fascin-1, the same target genes of miR-145 in human cancer (31). Therefore, miR-145 is now considered to be a common anti-oncomir in canine and human cancer, and to have some common anti-tumor mechanisms through targeting the same genes. Consequently, clarification of the roles of miR-145 in canine cancer and application of this miRNA to canine cancer treatment can contribute to human medicine and vice versa. However, study of
miR-145 in canine cancer and its target genes and/or anti-cancer mechanism has not advanced yet.
In this doctoral dissertation, I focused on canine malignant melanoma and human colorectal cancer as intractable cancers, and validated the tumor-suppressive mechanisms of commonly down-regulated miR-145 through exploring functions of its target genes. The present study consists of 2 chapters as follows:
In Chapter 1, the expression of fascin-1, one of the potential target genes of miR-145 (31), was validated in canine melanocytic tumors, and it was discussed whether miR-145 functions as anti-oncomir through the regulation of fascin-1 expression in canine malignant melanoma.
In Chapter 2, the novel role of miR-145 through the regulation of catenin δ-1, a potential oncogene, was validated using human colorectal cancer cells, and it was discussed whether miR-145 has a role in dysregulated Wnt/β-catenin signaling in colorectal cancer.
Figure 1. The biogenesis of microRNAs. This figure is cited from reference number (13) and modified.
Table 1. Dysregulated miRNAs previously reported in human cancers. C a n c e r U p - r e g u l a t e d m i R N A s D o w n - r e g u l a t e d m i R N A s B r a i n t u m o r m i R - 2 1 , 2 2 1 m i R - 1 2 8 , 1 4 3 , 1 4 5, 1 8 1 B r e a s t c a n c e r m i R - 9 - 1 , 1 0 b , 1 7 - 5 p , 2 1 , 2 9 b - 2 , 3 4 , 1 4 6 , 1 5 5 , 1 8 1 b - 1 , 2 1 3 l e t - 7 , m i R - 1 5 a , 1 6 , 1 2 5 a , 1 2 5 b , 1 2 7 , 1 4 5, 2 0 4 L u n g c a n c e r m i R - 1 7 - 5 p , 1 7 - 9 2 , 2 1 , 2 4 - 2 , 1 0 6 a , 1 2 8 b , 1 4 6 , 1 5 0 , 1 5 5 , 1 9 1 , 1 9 2 , 1 9 7 , 1 9 9 a - 1 , 2 0 3 , 2 0 5 , 2 1 0 , 2 1 2 , 2 1 4 l e t - 7 , m i R - 9 , 2 6 a - 1 - p , 2 7 b , 2 9 b - 2 , 3 0 a - 5 p , 3 2 , 3 3 , 9 5 , 1 0 1 - 1 , 1 2 4 , 1 2 4 a - 3 , 1 2 5 a , 1 2 5 a - p , 1 2 6 , 1 4 0 , 1 4 3 , 1 4 5, 1 8 1 c - p , 1 9 8 , 1 9 2 - p , 1 9 9 b - p , 2 1 6 - p , 2 1 8 - 2 , 2 1 9 - 1 , 2 2 0 , 2 2 4 E s o p h a g e a l c a n c e r m i R - 2 1 , 9 3 m i R - 1 4 3 , 1 4 5, 2 0 3 , 2 0 5 G a s t r i c c a n c e r m i R - 2 1 , 2 4 - 1 , 2 4 - 2 , 2 5 , 9 2 - 2 , 1 0 7 , 1 9 1 , 2 1 4 , 2 2 1 , 2 2 3 l e t - 7 , m i R - 1 4 3 , 1 4 5 C o l o r e c t a l c a n c e r m i R - 1 7 - 5 p , 2 0 a , 2 1 , 2 4 - 1 , 2 4 - 2 , 2 9 b - 2 , 3 0 c , 3 1 , 3 2 , 9 6 , 1 0 6 a , 1 0 7 , 1 2 8 b , 1 3 5 b , 1 5 5 , 1 8 3 , 1 9 1 , 2 2 1 , 2 2 3 l e t - 7 , m i R - 3 4 , 1 2 7 , 1 3 3 b , 1 4 3 , 1 4 5 H e p a t i c c a n c e r m i R - 1 5 b , 1 8 a , 2 1 , 1 0 6 b , 2 2 1 , 2 2 2 , 2 2 4 l e t - 7 , m i R - 1 0 1 , 1 2 2 a , 1 2 5 a , 1 4 3 , 1 4 5, 1 9 5 , 1 9 9 a , 2 0 0 a P a n c r e a t i c c a n c e r m i R - 1 7 - 5 p , 2 0 a , 2 1 , 2 4 - 1 , 2 4 - 2 , 2 5 , 2 9 b - 2 , 3 0 c , 3 2 , 9 2 - 2 , 1 0 0 , 1 0 6 a , 1 0 7 , 1 2 5 b , 1 2 8 b , 1 4 6 , 1 5 5 , 1 8 1 a , 1 8 1 b - 1 , 1 9 1 , 1 9 6 b , 1 9 9 a - 1 , 2 1 2 , 2 1 4 , 2 2 1 , 2 2 3 , 3 0 1 , 3 7 6 a m i R - 1 3 9 , 1 4 2 - p , 1 4 3 , 1 4 5, 3 4 5 , 3 7 5 P r o s t a t e c a n c e r m i R - 1 7 - 5 p , 2 0 a , 2 1 , 2 5 , 3 0 c , 3 2 , 9 2 - 2 , 1 0 6 a , 1 4 6 , 1 8 1 b - 1 , 1 9 1 , 1 9 9 a - 1 , 2 1 4 , 2 2 3 m i R - 1 5 a , 1 6 , 1 4 3 , 1 4 5, 2 1 8 - 2 C e r v i c a l c a n c e r m i R - 2 1 , 1 9 9 a m i R - 1 4 3 , 1 4 5 B - c e l l C L L m i R - 1 7 - 9 2 , 1 5 5 m i R - 1 5 a , 1 6 , 1 4 3 , 1 4 5, 1 9 2 , 2 1 3 , 2 2 0
Figure 2. MiR-145 is commonly down-regulated in canine melanoma and human colon cancer. (A) miR-145 expression levels in canine normal mucosa tissues, oral melanoma tissues, and cell lines. This figure is cited from reference number (31) and modified. (B) miR-145 expression levels in human colon tumor tissues (T) and adjacent normal tissues (N). This figure is cited from reference number (2) and modified.
Chapter 1
Basic Study for Fascin-1 Targeting Therapy Using
MicroRNA-145 in Canine Malignant Melanoma
1-1. INTRODUCTION
Malignant melanoma (melanoma) is the most common canine oral malignancy, comprising 30-40% of all oral tumors (27). Canine oral melanoma is a highly aggressive tumor with a high propensity for invasion and metastasis in up to 90% of cases (38). Standard therapeutic modalities such as surgery, radiation therapy and chemotherapy cannot significantly prolong the survival of dogs with advanced-stage oral melanoma (37). Overall, the median survival time of canine oral melanoma cases is only 8 months (4, 24, 27). On the other hand, canine cutaneous melanocytic tumors are mostly melanocytomas and only 13% of them are melanomas (27). Concerning the tumor location, canine melanomas mainly occur in the oral cavity and the digit, whereas human melanomas mainly occur in the skin. However, both canine and human melanomas are aggressive, regardless of their location. Pathogenesis of human melanoma is attributed to the combination of genetic predisposition and exposure to an ultraviolet radiation (26). According to the World Health Organization (WHO), human melanomas account for only 4% of skin neoplasms, however, they are responsible for 74% of all skin tumor-related deaths. Because of early detection and appropriate therapy, the outcome for melanoma has improved in humans; however, advanced-stage melanoma is still associated with an extremely poor
median survival time, ranging from 2 to 8 months (28). Thus, melanoma is one of the most important malignant tumors in dogs and humans. A number of molecular biology studies of melanoma have been performed; however, there have been no significant therapeutic breakthroughs to date (6, 18, 28).
As shown in Table 1, miR-145, which is transcribed as the same pri-miRNA with miR-143 at chromosome 5q33 in human, is commonly down-regulated in various human cancers. Growing evidence indicates that miR-145 function as an anti-oncomir in most types of human cancer; however, the detailed mechanism of tumor-suppressive effect of miR-145 has not fully understood. The high-throughput methodologies used for the study of miRNAs in human cancers can also be applied to dogs, and these recent studies indicate that the dog may prove to be an ideal model for the study of miRNAs, because naturally occurring cancers in pet dogs and humans share many features, including histological appearance, tumor genetics, molecular targets, biological behavior and response to conventional therapies. In fact, Noguchi et al. have recently shown that miR-145 expression was significantly down-regulated in both canine oral melanoma cell lines and tumor tissues compared with that in normal mucosa tissues (31). Ectopic expression of miR-145 in the cell lines down-regulated fascin-1 and c-Myc, implicating that miR-145 targets the same genes observed
in human cancers (31). In this chapter, focusing on the role of fascin-1, one of the target genes of miR-145, I investigated the association between fascin-1 expression and tumor malignancy of canine melanoma, and suggested the potential for the future application of miR-145 replacement therapy to canine melanoma.
1-2. MATERIALS and METHODS
1-2-1. Dogs and Tissue Preparation
This retrospective study included 56 cases with melanocytic lesions of the oral cavity or skin collected between 2004 and 2011 at the Department of Veterinary Pathology, Gifu University. All samples were obtained by surgery or biopsy and immediately fixed in 10% neutral-buffered formalin. After fixation, the tissue samples were embedded in paraffin, sectioned (section thickness; 4 µm), and stained with haematoxylin and eosin (H&E). In all cases, two board (Japanese College of Veterinary Pathologists)-certified pathologists (M.M. and H.S.) confirmed the histological diagnoses according to the WHO International Histological Classification of Tumors of Domestic Animals (16, 19). Nine samples were from tumors in the skin that were diagnosed as melanocytomas, while 47 were from tumors in the oral cavity that were diagnosed as melanomas. Complete tumor staging, including physical examination, complete blood count, chemistry profile, radiographs, and/or computed tomography scans (CT scans), and local lymph node evaluation, were performed on 41 cases of melanoma admitted to the Department of Veterinary Clinical Oncology at Gifu University. For the remaining 6 melanoma cases, we obtained information about their stage at the time of biopsy or surgery from the referring veterinarians. On the basis of the modified WHO clinical
staging system for canine oral melanoma (Table 2) (27), the 47 samples were sorted into 4 groups: stage I (n = 7), stage II (n = 15), stage III (n = 14), and stage IV (n = 11).
1-2-2. Immunohistochemistry
For IHC, 4-µm sections were mounted on silane-coated slides (Matsunami, Osaka, Japan), deparaffinised, and rehydrated. For antigen retrieval, the slides were immersed in Target Retrieval Solution (DakoCytomation, Glostrup, Denmark) for 3 min at 120°C in an autoclave. Endogenous peroxidase activity was blocked with 0.3% H2O2 in methanol for 20 min at room temperature. To prevent the
primary antibody binding to non-specific proteins, the slides were treated with Protein Block Serum-Free (DakoCytomation) and incubated with the primary anti-fascin-1 antibody (Fascin antibody, 55K2; Abcam, Cambridge, UK; diluted 1:5000) overnight at 4°C. The slides were washed 3 times with phosphate-buffered saline and incubated for 30 min at room temperature with the secondary antibody (Envision System Labelled Polymer-HRP anti-Mouse; DakoCytomation). The sections were washed in distilled water, reacted in 3-amino-9-ethyl carbazole (AEC) for 30 min, counterstained with Mayer’s haematoxylin, and mounted with Ultramount Aqueous Permanent Mounting Medium (DakoCytomation).
1-2-3. Immunohistochemical Evaluation
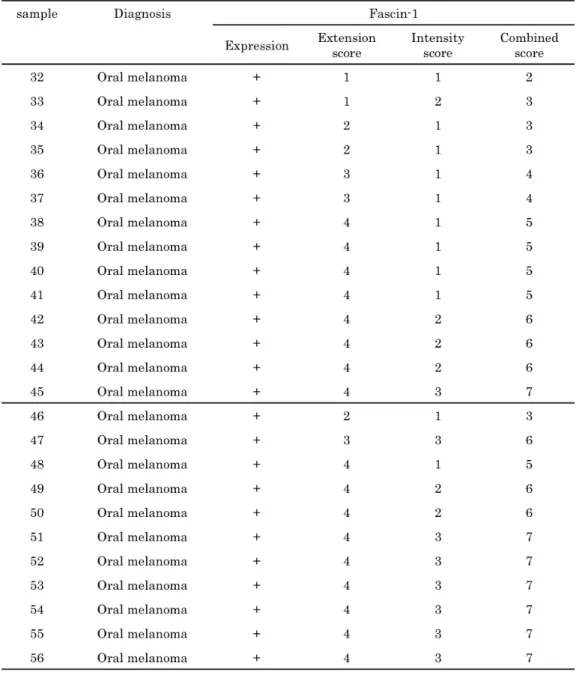
Immunohistochemical evaluation was performed by one pathologist (MM) without knowledge of the details of each case. In each case, extent of fascin-1 staining was calculated as the mean of the proportion of positive cytoplasmic staining in 8–10 representative fields. Extent of staining was scored semi-quantitatively using a 0–4 scale: 0 = no expression, 1 = 1–25%, 2 = 26–50%, 3 = 51–75%, and 4 = 76–100%. Staining intensity was classified into 3 groups by comparing the staining intensity of tumor cells with internal positive controls (fibroblastic cells and/or endothelial cells): 1 = weaker than internal controls, 2 = same as internal controls, and 3 = stronger than internal controls. The sum of the extent and intensity scores was calculated. The combined scores were sorted into 4 groups: negative = total score 0, weak staining = 2–3, moderate staining = 4–5, and strong staining = 6– 7.
1-2-4. Evaluation of the Staining Distribution
In each case, localization of fascin-1-positive tumor cells was observed as part of histological evaluation. We divided the localization into two patterns: positive cells were diffusely distributed or localized
within the tumor. If localized, we recorded the location, e.g. marginal region of tumor, central region of the tumor, or both.
1-2-5. Statistical Analysis
To determine whether the combined scores for fascin-1 differed by classification and phenotype (invasive or not), the Kruskal–Wallis test with Dunn’s multiple comparison test and the unpaired t test with Welch’s correction were used, respectively. To calculate the survival rate and differences between survival curves, the Kaplan-Meier method and log-rank test were performed. All statistical analyses were conducted using the GraphPad Prism software system (GraphPad Software, Inc., La Jolla, CA, USA). A p-value < 0.05 was considered significant.
1-3. RESULTS
1-3-1. Fascin-1 expressions in melanocytomas and melanomas
First, fascin-1 expression was determined in all melanocytic tumor samples. Fascin-1 expression was detected in 5/9 (56%) melanocytomas and in 7/7 (100%) stage I, 14/15 (93%) stage II, 14/14 (100%) stage III, 14/15 (93%) stage IV melanomas. Diffuse cytoplasmic staining with occasional cytoplasmic membrane staining of tumor cells were commonly observed. Representative examples of negative staining, weak staining, moderate staining and strong staining are shown in Figure 3.
1-3-2. Distribution of fascin-1 expressing tumor cells
Specific observation was obtained that fascin-1 was especially up-regulated in some tumor cells in the tumor marginal region. This pattern was observed in some melanoma cases (10/47, 21%), regardless of clinical staging (Figure 4). In contrast, fascin-1 expression was observed only diffusely in melanocytoma cases.
1-3-3. Association between the fascin-1 combined scores and clinical stages
Next, the extent and intensity of fascin-1 staining were evaluated, and the combined scores were calculated (Table 3). The fascin-1
combined scores [mean and standard deviation (SD)] for melanocytoma, stage I melanoma, stage II, stage III and stage IV were 1.56 ± 1.59, 4.14 ± 1.57, 3.47 ± 1.60, 4.57 ± 1.45 and 6.18 ± 1.25, respectively. A significant difference was noted between stage II and stage IV (p < 0.01).
1-3-4. Association between the fascin-1 combined scores and advanced clinical stages or invasive phenotypes
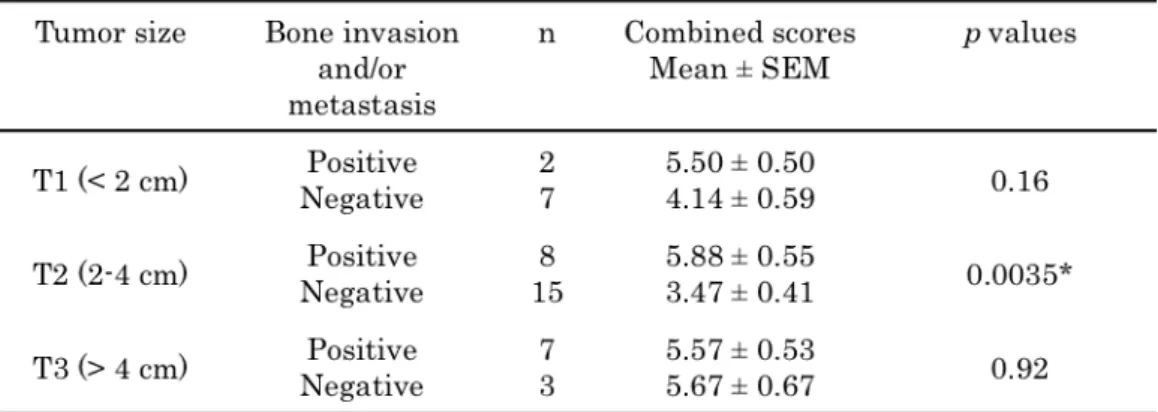
The mean and SD of the fascin-1 combined scores were also calculated based on the modified clinical staging classification system [i.e. melanocytoma group, malignant but non-advanced-stage group (stage I and stage II) and advanced-stage group (stage III and stage IV)] (Table 4). Significant difference was noted between the non-advanced-stage group and the advanced-stage group (p < 0.05). Additionally, when melanomas were grouped according to evidence implicating their invasiveness, for example, bone invasion, lymph node metastasis and distant metastasis, for primary tumors of the same size (T1: <2 cm, T2: 2-4 cm, T3: >4 cm) (Table 5), the mean and standard error of the mean (SEM) of the fascin-1 combined scores were significantly higher in the invasive tumors of the T2 group (p < 0.01). with regard to tumor invasiveness, osteolysis and/or reactive bone hyperplasia in the neighboring regions of tumor were diagnosed as
bone invasion by using CT scans and/or radiographs. Lymph node metastasis was diagnosed by fine needle biopsy, and distant metastasis was also diagnosed using CT scans and/or radiographs.
1-3-5. Association between the fascin-1 combined scores and overall survival
Finally, the correlation between fascin-1 expression intensity and survival was evaluated. Follow-up information until death was available for 16 melanoma cases, and these cases were classified into two groups (strong and weak/moderate staining) according to their fascin-1 combined scores. The median survival time of the strong staining group (58 days, n = 5) was significantly shorter than that of the weak/moderate staining group (115 days, n = 11) (log-rank test, p = 0.0136) (Figure 5). Follow-up information was available for two melanocytoma cases too, where the patient was alive for 379 days in one case and 319 days in the other. However, because of the low number of cases, statistical analysis was not performed.
1-4. DISCUSSION
Previously, it was reported that miR-145 is down-regulated in canine melanoma cell lines and tissues samples, and that miR-145 functions as an anti-proliferative miRNA through the down-regulation of fascin-1 and c-myc (31).
In this chapter, I focused on the expression of fascin-1 and its role in canine melanoma. Fascin-1 is actin-bundling protein, which plays a critical role in the organization of actin-based structures, including filopodia, dendrites and microspikes. Recently, fascin-1 has been highlighted because of the positive correlation between fascin-1 expression and aggressive clinical behavior including short survival time, local invasion, and high metastatic rate, of several human cancers (5, 17, 21). Filopodia, membranous cell protrusions, are normally observed in developing neurons and dendritic cells that are highly motile and are also known to be a critical hallmark of the invasive phenotype of tumor cells (3, 40, 43). Fascin-1 appears to provide tumor cells with invasive properties that may confer increased metastatic potential. Therefore, fascin-1 is now considered to be a promising candidate as a prognostic marker and a therapeutic target for metastatic cancers. Consistent with past studies, my data revealed that fascin-1 expression in canine melanoma was also correlated with aggressive clinical behaviors including advanced clinical stage, local
invasion, metastasis and short survival time. As a histological diagnostic tool, the combined score of fascin-1 expression and its localization within the tumor can be a novel indicator to predict the clinical course of canine melanoma. Although, fascin-1 expression was also detected in 56% of melanocytoma cases, it was the extent and intensity of fascin-1 staining that is significantly associated with malignant behavior. However, there is no significant difference in fascin-1 expression between melanocytomas and stage I/II melanomas. This phenomenon reflects the difficulty of a single diagnostic technique for differentiating benign melanocytic neoplasm from malignant one.
In conclusion, in this chapter, fascin-1 overexpression was shown to be associated with the clinical malignancy of canine melanoma. This finding indicates that dysregulation of miR-145 contributes to carcinogenesis and/or progression in canine melanoma. In future study, expression levels of miR-145 and fascin-1 need to be validated in a larger sample set of canine melanoma tissues.
Figure 3. Fascin-1 expression detected by immunohistochemical staining in canine melanocytic tumors. (A) Negative staining in cutaneous melanocytoma with positive fibrovascular cells as an internal control (arrowhead). (B) Weak cytoplasmic staining in oral melanoma. (C) Moderate cytoplasmic staining in oral melanoma. (D) Strong cytoplasmic staining in oral melanoma (AEC ×400).
A B
Figure 4. Fascin-1 expression was locally strong (A; rectangle) in the marginal region of oral melanoma (AEC; A: ×100, B; ×400).
Table 4. Fascin-1 combined scores of canine melanocytic tumors with the modified clinical staging classification.
Table 5. Relationship between the invasive behavior and the fascin-1 combined scores of oral melanomas separated into groups based on size.
Figure 5. Kaplan-Meier overall survival probability of dogs with oral melanomas. A significant difference (p = 0.0136) was noted between the fascin-1 strong staining and moderate/weak staining groups (log-rank test).
SUMMARY
In this chapter, it was verified that fascin-1 overexpression was associated with the clinical malignancy of canine melanoma including advanced clinical stage, local invasion, metastatic behavior and short survival time. This finding indicates that dysregulation of miR-145 contributes to carcinogenesis and/or progression in canine melanoma through fascin-1 expression.
Chapter 2
Catenin δ-1 as a Novel Target Gene of
MicroRNA-145 to Regulate Wnt/β-catenin
2-1. INTRODUCTION
Previously, Akao et al. reported that miR-145 is down-regulated in various kinds of cancers including colorectal cancer, and also that the intra-tumoral injection of miR-145 significantly suppressed tumor growth in human colon cancer cell-engrafted nude mice (1). In this chapter, human colorectal cancer DLD-1 and WiDr cells were used to validate the mechanisms of the tumor-suppressive effect of miR-145, and a new target gene regulated by miR-145 was explored for the future development of new therapeutic modalities.
Human colorectal cancer is one of the leading causes of cancer-related death worldwide. In spite of early screening and the development of new chemotherapeutic strategies, the survival rate of colorectal cancer has not been essentially improved in the past 20 years. Truncation of the Apc (adenomatous polyposis coli) protein occurs in more than 80% of colorectal cancers (35). Apc is a component of the β-catenin destruction complex, and β-catenin is a key element for driving Wnt/β-catenin signaling. Inactivation of Apc leads to the constitutive activation of Wnt/β-catenin, and that is considered to be the main cause of colorectal carcinogenesis (14, 33). However, the relationship between the constitutive activation of Wnt/β-catenin signaling and down-regulation of miR-145 in colorectal cancer has not
been fully understood yet. Thus, in this chapter, the roles of miR-145 in Wnt/β-catenin signaling was verified and discussed.
2-2. MATERIALS and METHODS
2-2-1. Cell culture and cell viability
Human colon cancer cell line DLD-1 and WiDr (29) were grown in RPMI-1640 medium supplemented with 10% (v/v) heat-inactivated FBS (Sigma-Aldrich Co., St. Louis, MO, USA) and 2 mM L-glutamine under an atmosphere of 95% air and 5% CO2 at 37°C. The number of viable
cells was determined by performing the trypan-blue dye exclusion test.
2-2-2. Transfection of colon cancer cells with miRNA or siRNA
DLD-1 and/or WiDr cells were seeded in 6-well plates at a concentration of 0.5 x 10⁵ per well (10-30% confluence) on the day
before the transfection. The mature type of miR-145 (mirVanaT M
miRNA mimic; ambion, Foster City, CA, USA) and its inhibitor (mirVana miRNA inhibitor; ambion) were used for the transfection of the cells, which was achieved by using cationic liposomes, LipofectamineT M RNAiMAX (Invitrogen, Carlsbad, CA, USA), according
to the manufacturer’s Lipofection protocol. The non-specific control miRNA (HSS, Hokkaido, Japan) sequence was 5’-GUA GGA GUA GUG AAA GGC C-3’, which was used as a control for non-specific effects (1, 30). The mature type of miR-145 used in this study was 5’-GUC CAG UUU UCC CAG GAA UCC CU-3’. Short interfering RNA (siRNA) for catenin δ-1 (siR-ctnnd1) was also used for the transfection of the cells.
The sequence of siR-ctnnd1 was 5’-UAU AGA AGG UGA CUG UGA UCC UGG G-3’ (Invitrogen). After indicated time points, the cells were harvested for mRNA and protein analyses.
2-2-3. Quantitative RT-PCR using real-time PCR
Total RNA was isolated from cells by using TRIzol containing phenol/guanidium isothiocyanate (Applied Biosystems) and treatment with DNase I. RNA concentration and purity were assessed by UV spectrophotometry. RNA integrity was checked by formaldehyde gel electrophoresis. For determination of the expression levels of mRNAs, total RNA was reverse-transcribed with PrimeScript® RT reagent Kit
(TaKaRa, Otsu, Japan). Quantitative PCR (qRT-PCR) was performed with primers specific for c-Myc and CyclinD1 by using SYBR® Premix
Ex TaqT M (TaKaRa). The primers for c-Myc and CyclinD1 were the
following: c-Myc-sense, 5’-TTC GGG TAG TGG AAA ACC AG-3’; c-Myc-antisense, 5’-CAG CAG CTC GAA TTT CTT CC-3’; CyclinD1-sense, 5’-AAC TAC CTG GAC CGC TTC CT-3’; and CyclinD1-antisense, 5’-CCA CTT GAG CTT GTT CAC CA-3’. GAPDH was used as an internal control. The relative expression levels of mRNAs were calculated by the ΔΔCt method.
Whole cells were homogenized in chilled lysis buffer comprising 10 mM Tris-HCl (pH 7.4), 1% NP-40, 0.1% deoxycholic acid, 0.1% SDS, 150 mM NaCl, 1 mM EDTA, and 1% Protease Inhibitor Cocktail (Sigma-Aldrich Co.) and stood for 20 min on ice. After centrifugation at 13,000 rpm for 20 min at 4°C, the supernatants were collected as whole cell protein samples. Nuclear protein and cytoplasmic protein were extracted by using a CelLyticT M NuCLEART M Extraction Kit
(Sigma-Aldrich Co.), according to the manufacturer’s technical bulletin. Protein contents were measured with a DC Protein assay kit (Biorad, Hercules, CA, USA). Ten micrograms of lysate protein was separated by SDS-PAGE using 7.5-15% polyacrylamide gels, and electroblotted onto a PVDF membrane (PerkinElmer Life Sciences, Inc., Boston, MA, USA). After blockage of nonspecific binding sites for 1 h with 5% nonfat milk in PBS containing 0.1% Tween 20 (TBS-T), the membrane was incubated overnight at 4°C with antibodies for β-catenin (Cell Signaling Technology, Inc., Danvers, MA, USA), phospho-β-catenin (Ser33/37/Thr41; Cell Signaling Technology), Histone H3 (Cell Signaling Technology), catenin δ-1 (Cell Signaling Technology), PAK4 (Cell Signaling Technology), CyclinD1 (Cell Signaling Technology), c-Myc (Cell Signaling Technology), or E-cadherin (Cell Signaling Technology) properly diluted with TBS-T containing 2% bovine serum albumin and 0.01% sodium azide. The
membrane was then washed 3 times with TBS-T, incubated further with HRP-conjugated horse anti-mouse or goat anti-rabbit IgG antibody (Cell Signaling Technology) at room temperature, and then washed 3 times with TBS-T. The immunoblots were visualized by use of Ammersham ECL Plus Western Blotting Detection Reagents (GE Healthcare, Buckinghamshire, UK). The quantity loaded was verified by re-incubating the same membrane with anti-β-actin antibody (Sigma-Aldrich Co.).
2-2-5. Luciferase reporter assay
DLD-1 cells were seeded in 6-well plates at a concentration of 0.5 x 10⁵ per well on the day before the transfection. Searching the Target
Scan 6.0 database (http://www.targetscan.org/) to find algorithm-based binding sites of miR-145, we found the predicted binding sites to be at position 5086-5092 in the 3’UTR of catenin δ-1 mRNA. The sequence region with the putative binding sequence of miR-145 was inserted into pMIR-REPORTT M Luciferase miRNA Expression Reporter Vector
(Applied Biosystems) according the manufacturer’s protocol. Moreover, we made another pMIR construct encompassing mutated seed sequence for miR-145 (Wild type; AACUGGA, mutant; AAUCAGA) by using PrimeSTAR® Mutagenesis Basal Kit (TaKaRa). The mutation of the
co-transfected with each reporter vector (0.5 µg/well) and 20 nM miR-145 or non-specific non-coding siRNA (Dharmacon, Tokyo, Japan), which was achieved by using LipofectamineT M RNAiMAX. Luciferase
activities were measured at 48 h after co-transfection by using Pikka-Gene Dual (TOYO B-Net, CO., Ltd., Tokyo, Japan) according to the manufacturer’s protocol. Luciferase activities were shown as the firefly luciferase/Renilla luciferase ratio.
2-2-6. Cell cycle analysis
Quantification of cellular DNA content at 48 h after transfection with non-specific control, miR-145, or siR-ctnnd1 at 20 nM was determined by using a cytometer. Briefly, the cells were harvested and fixed with 70% cold ethanol at -20°C overnight. The fixed cells were washed twice with PBS, resuspended in 100 µl PBS-based propidium iodide solution containing 0.1% Triton X-100 (Wako Pure Chemical Industries, Ltd., Osaka, Japan), 0.2 mg/ml RNase A (Invitrogen), and 20 µg/ml propidium iodide (Invitrogen), and incubated for 30 min at room temperature protected from the light. The DNA content in the cells was analyzed through the cytometer (The Tali® Image-Based
Cytometer, Invitrogen).
DLD-1 and WiDr cells were seeded on 13-mm glass coverslips (Matsunami Glass Ind., Osaka, japan) in 6-well plates. At 48 h after transfection with non-specific control, miR-145, or siR-ctnnd1 at 20 nM, cells were immunostained with anti-β-catenin antibody (Cell Signaling Technology) and anti-Phalloidin (Cytoskeleton Inc., Denver, CO, USA) according to the immunofluorescence staining protocol of Cell Signaling Technology. Labeled cells were observed with a Biorevo fluorescence microscope (Keyence, Osaka, Japan).
2-2-8. Wound healing assay
DLD-1 and WiDr cells for miR-145 transfection or catenin δ-1 knockdown were seeded into 12-well plates at a concentration of 0.5 x 10⁵ per well and transfected with miR-145 or siR-ctnnd1. A
straight-line scratch, which was made to simulate a wound, was made by a sterile pipette tip at 48 h after transfection. Cells were washed with PBS and refreshed with serum-free medium to exclude the effect of cell growth facilitated by serum. After overnight incubation at 37°C, the cells were fixed in absolute methanol. The initial gap length (0 h) and the residual gap length 24 h after the scratch were calculated from photomicrographs.
DLD-1 and WiDr cells for miR-145 transfection or catenin δ-1 knockdown were seeded into 6-well plates at a concentration of 0.5 x 10⁵ per well and transfected with miR-145 or siR-ctnnd1. Cells were
detached with trypsin at 48 h after the transfection, suspended at a concentration of 1.25 x 10⁵ per ml in 2 ml of serum-free RPMI, and
seeded into 8 µm porous BioCoat Matrigel chamber inserts (BD Biosciences, San Jose, CA, USA). The chamber inserts were placed in wells filled with 2.5 ml of RPMI supplemented with 10% FBS as chemoattractant. After 22 h of incubation, the upper side of the filter was scraped with a cotton tip to eliminate cells that had not migrated through it. The invasive ability of the cells was determined by counting the cells stained with Wright-Gimsa that had migrated to the lower side of the filter from photomicrographs.
2-2-10. Statistics
Differences were statistically evaluated by one-way ANOVA followed by Tukey’s method or the unpaired t test. All statistical analyses were conducted by use of the GraphPad Prism software system (GraphPad Software, Inc., La Jolla, CA, USA). A p-value < 0.05 was considered to be significant.
2-3. RESULTS
2-3-1. Ectopic expression of miR-145 in DLD-1 and WiDr cells exhibited growth inhibition through disturbance of the Wnt/β-catenin signaling pathway
Akao et al. previously confirmed the inhibitory effect of miR-145 on cell growth in 2 human colon cancer cell lines, DLD-1 and SW480 cells (2). I also confirmed that the number of viable DLD-1 and WiDr cells at 72 h after transfection with miR-145 was significantly decreased compared with that for the control (Figure 6A). I hypothesized that the ectopic expression of miR-145 inhibits cell growth through disturbing the Wnt/β-catenin signaling pathway in colon cancer cells. The pivotal point of Wnt/β-catenin signaling is nuclear translocation of β-catenin to form a complex with intranuclear LEF/TCF to activate transcription of predicted target genes such as CyclinD1 and c-Myc (9). In the current study, I focused on the effect of miR-145 on the intracellular localization of β-catenin and transcriptional activity of the target genes. By the ectopic expression of miR-145, the levels of intranuclear β-catenin were significantly decreased in DLD-1 and WiDr cells; and, the levels of phosphorylated β-catenin at its Ser33/37/Thr41, which generates a degradation signal, were also significantly decreased (Figure 6B). However, the total quantities of β-catenin were almost unchanged. Expectedly, the suppressive effects of miR-145 on the
expression of CyclinD1 and c-Myc were clearly demonstrated as evidenced by the down-regulation of their mRNA and protein expression levels after the transfection with miR-145 (Figure 6C and D).
2-3-2. Ectopic expression of miR-145 disturbed nuclear translocation of β-catenin through down-regulation of catenin δ-1
I further examined the mechanism underlying aberrant nuclear translocation of β-catenin caused by miR-145. I focused on catenin δ-1, because it is one of the predicted targets of miR-145 according to the Target Scan 6.0 database (http://www.targetscan.org/). Catenin δ-1 is a member of the Armadillo family of catenins and a known regulator of cytoskeletal reorganization and Rho GTPases (22). Recently, catenin δ-1 was found to be a binding partner for PAK4, a modulator of intracellular translocation of β-catenin (23). Interestingly, catenin δ-1 expression at the protein level was significantly down-regulated in DLD-1 and WiDr cells transfected with miR-145 (Figure 7). I performed a luciferase reporter assay for catenin δ-1 in the human colon cancer DLD-1 cells, and confirmed that nucleotide position 5086-5092 of catenin δ-1 3’UTR contained the actual target region of miR-145 (Figure 8A and B). Importantly, intranuclear translocation of PAK4 was also disturbed in the cells transfected with miR-145 in both
cells (Figure 7). In order to elucidate the role of catenin δ-1 in the nuclear translocation of PAK4 and β-catenin, I attempted gene silencing of catenin δ-1. As a result, the growth of DLD-1 and WiDr cells (Figure 9A), nuclear translocation of PAK4 and β-catenin (Figure 9B), and transcription of c-Myc and CyclinD1 were significantly inhibited (Figure 9C). I also examined the intracellular localization of β-catenin by immunofluorescence staining. As shown in Figure 10A, when DLD-1 cells were transfected with control, the fluorescence in the nucleus was stronger than that in the cytoplasm. On the other hand, in the cells transfected with miR-145 or siR-ctnnd1, the fluorescence was diffusely distributed in both the cytoplasm and nucleus. Such findings were also observed in the case of WiDr cells (Figure 10B). Furthermore, I examined cell cycle analysis to elucidate which phase-arrest affected the growth inhibition by exogenous miR-145 or silencing catenin δ-1. As shown in Figure 11, sub-G1 phase,
which means apoptotic cell population, was significantly increased in miR-145- or siR-ctnnd1-transfected cells compared with that of control (p < 0.05).
2-3-3. AntagomiR-145 reversed the inhibitory effects of miR-145 on cell growth, expression of catenin δ-1, and nuclear translocation of PAK4 and β-catenin
To further validate the role of miR-145 in disturbed translocation of β-catenin and its subsequent effect on target genes through the down-regulation of catenin δ-1, I tested the efficacy of antisense against miR-145 in WiDr cells. Combined treatment with miR-145 and antagomiR-145 clearly restored viable cell rate (Figure 12A), expression level of catenin δ-1, nuclear translocation of PAK4 and β-catenin, and expression levels of its downstream genes, c-Myc and CyclinD1 (Figure 12B).
2-3-4. Ectopic expression of miR-145 attenuated cell migration and invasion through the down-regulation of catenin δ-1 and E-cadherin in DLD-1 and WiDr cells
In a wound healing assay, the area of the wound remaining at 24 h after wound formation was 40.8 ± 0.6, 71.1 ± 1.9, 79.6 ± 2.9, and 96.4 ± 3.8% in control, siR-ctnnd1 (5 nM), siR-ctnnd1 (10 nM), and miR-145 (10 nM) transfected DLD-1 cells, and 33.0 ± 3.2, 76.3 ± 4.7, 91.9 ± 2.7, and 95.5 ± 4.1% in control, siR-ctnnd1 (10 nM), siR-ctnnd1 (20 nM), and miR-145 (20 nM) transfected WiDr cells, respectively (Figure 13A). Thus, a significant inhibitory effect on cell migration was observed in miR-145- or siR-ctnnd1-transfected cells compared with the control migration (p < 0.001). A dose-dependent effect was also observed for the siR-ctnnd1-transfected cells (p < 0.05). Furthermore, the
inhibitory effect was greater in the cells transfected with miR-145 than in those transfected with siR-ctnnd1 in DLD-1 cells (p < 0.01). In the Matrigel invasion assay, a significant inhibitory effect on cell invasion was also observed in miR-145- or siR-ctnnd1-transfected cells compared with that of control (Figure 13B). Catenin δ-1 is known to be a regulator of cadherin turnover and a modulator of cadherin-mediated adhesion by directly determining the amount of cadherin available at the cell surface to participate in cell adhesion (22). Significant down-regulation of E-cadherin was observed in cells transfected with miR-145 or siR-ctnnd1 (Figure 13C). The inhibitory effect on cell invasion and E-cadherin expression were greater in the cells transfected with siR-ctnnd1 than those transfected with miR-145 at 20 nM in both cell lines (p < 0.01 and p < 0.001).
2-4. DISCUSSION
In this chapter, the tumor-suppressive effects of miR-145 in DLD-1 and WiDr cells were revealed. Ectopic expression of miR-145 disturbed β-catenin translocation into the nucleus, thus resulting in significant down-regulation of the transcription of LEF/TCF target genes c-Myc and CyclinD1. c-Myc and CyclinD1 are critical genes involved in cell cycle progression. The cell cycle analysis clearly demonstrated that apoptotic cell death was induced by ectopic expression of miR-145 and/or silencing catenin δ-1. The down-regulation of c-Myc and CyclinD1 was supposed to cause G0/G1 arrest and increase G0/G1 phase
population. In this study, the increase of sub-G0 phase population may
have masked the increase G0/G1 phase population. Indeed, miR-145 has
been reported to induce caspase-dependent and –independent cell death and/or TRAIL-induced apoptotic cell death (32, 39). The cell cycle arrest caused by the down-regulation of c-Myc and CyclinD1 could also have contributed to the apoptosis induction.
I demonstrated that miR-145 modulated only the intracellular distribution of β-catenin but not the absolute quantity of β-catenin. Interestingly, β-catenin degradation was decreased rather than increased or unchanged in the miR-145-transfected cells, perhaps because decreased LEF/TCF-medicated transcription led to negative-feedback for formation of the β-catenin destruction complex.
Concerning with the feedback mechanism, it has also been reported that decreased LEF/TCF-mediated transcription induces miR-145 expression in colon cancer (36). This fact and my result together suggested that down-regulation of Wnt/β-catenin signaling could strengthen the inhibitory effects of miR-145 on itself, and that miR-145 expression and activation of Wnt/β-catenin signaling was inversely correlated with each other in colon cancer. Thus, the down-regulation of miR-145 can be an essential event for the activation of Wnt/β-catenin signaling at the early stage of colon carcinogenesis. I further demonstrated that the aberrant nuclear translocation of β-catenin by the ectopic expression of miR-145 was caused by down-regulation of catenin δ-1. For over a decade, the Armadillo catenins (β-catenin, γ-catenin, and catenin δ-1) were thought to be only cell-adhesion co-factors for the classical cadherins. However, accumulating evidence has now revealed that the Armadillo catenins are multifunctional nucleo-cytoplasmic shuttling proteins that regulate gene expression via interaction with DNA-binding transcriptional factors (34). This activity is best illustrated by β-catenin, which is translocated into the nucleus, where it functions as a co-transcriptional factor in Wnt/β-catenin signaling. In contrast to that of β-catenin, the role of catenin δ-1 has been less elucidated. Catenin δ-1 first attracted attention when the known transcriptional
factor Kaiso was identified as a catenin δ-1-specific binding partner (10). Kaiso inhibits β-catenin/TCF activation of target genes, and catenin δ-1 inhibits Kaiso’s activity (11). Thus, it is now thought that the Kaiso/catenin δ-1 complex is a modulator of the canonical Wnt/β-catenin signaling pathway (10). Recently, catenin δ-1 was also found to be a binding partner and substrate for group B PAKs, especially PAK4 (42). PAK4 belongs to a family of serine/threonine protein kinases, and is also known to be a nucleo-cytoplasmic shuttling protein (23). Cross talk between the canonical Wnt/β-catenin signaling pathway and PAK4 signaling pathway was also reported: nuclear accumulation of PAK4 can promote nuclear import of β-catenin and β-catenin/TCF-mediated gene transcription (23). In the current study, nuclear translocation of PAK4 and β-catenin was clearly disturbed by ectopic expression of miR-145 as well as by silencing catenin δ-1. The detailed mechanism was not elucidated in this study; however, catenin δ-1 was shown to certainly play a significant role as a modulator of the nucleo-cytoplasmic shuttling of PAK4 and β-catenin.
Moreover, I showed that miR-145 attenuated cell migration and invasion activities through the down-regulation of catenin δ-1 and E-cadherin. Catenin δ-1 is a component of the E-cadherin-catenin complex, and several studies demonstrated that catenin δ-1 is a regulator of cadherin turnover and a modulator of cadherin-mediated
adhesion by directly determining the amount of cadherin available at the cell surface to participate in cell adhesion (12, 20). In this study, the ectopic expression of miR-145 and gene silencing for catenin δ-1 caused significant down-regulation of E-cadherin. PAK4 is also known to be involved in a wide range of biological activities, including inhibition of cell adhesion and promotion of cell migration (41, 44). However, the down-regulation of PAK4 was not as obvious as that of catenin δ-1 in miR-145 transfected cells. Thus, I concluded that the inhibitory effect on cell migration and invasion observed in this study was partly through the down-regulation of catenin δ-1 and E-cadherin, and not through the down-regulation of PAK4. The reason why I said ‘‘partly’’ is that it has been already demonstrated miR-145 inhibits cell migration by directly targeting fascin-1 in bladder cancer, esophageal squamous cell carcinoma and prostate cancer (7, 15, 25). I also confirmed that miR-145 directly targeted fascin-1 in DLD-1 cells, based on the results of a luciferase assay (data not shown). In this current study, we confirmed that the inhibitory effect of miR-145 on cell motility was greater than that of silencing catenin δ-1 in DLD-1 cells. This is reasonable because miR-145 can attenuate cell motility through the down-regulation of Fascin-1, catenin δ-1, E-cadherin and other unknown genes.
directly targeted catenin δ-1; (2) down-regulation of catenin δ-1 decreased nuclear import of β-catenin with PAK4, which led to the down-regulation of β-catenin/TCF-mediated gene transcription; (3) down-regulation of catenin δ-1 may have also increased Kaiso’s activity, which could also have led to the down-regulation of β-catenin/TCF-mediated gene transcription; and (4) miR-145 attenuated cell migration and invasion activities by down-regulating not only fascin-1 but also catenin δ-1 and E-cadherin. Altogether, my model on the involvement of miR-145 in Wnt/β-catenin signaling pathway, which is depicted in Figure 14, suggests that miR-145 plays a central role in modulating nuclear translocation of β-catenin and β-catenin-dependent transcriptional activity through the down-regulation of catenin δ-1, which results in decreased nuclear translocation of PAK4 and/or increased activity of Kaiso.
Further study is needed to clarify the possible involvement of other miR-145-associated cascades for the development and regulation of colon carcinogenesis.
Figure 6. Effects of ectopic expression of miR-145 in DLD-1 and WiDr cells. (A) Effect of miR-145 on cell growth was examined at 72 h after the transfection (*p < 0.05, **p < 0.01, and ***p < 0.001). The viable cell number for the control miRNA is indicated as 100%. Data are expressed as the mean ± SD (n = 3). (B) Subcellular distribution of β-catenin protein was assessed at 72 h after the transfection with miR-145 at 40 nM. Cell lysates were collected and fractionated into cytoplasmic and nuclear extracts. The efficiency of fractionation was verified by staining for Histone H3 as a nuclear marker, and β-actin as a cytoplasmic marker and also as an indicator for contamination of cytoplasmic protein into the nuclear fraction (“n-β-actin” means intra-nuclear β-actin). Total (cytoplasmic and nuclear) level of β-catenin protein was assessed at 72 h after the transfection with miR-145 at 40 nM. β-catenin phosphorylation at its Ser33/37/Thr41 indicates β-catenin degradation. β-actin was used as a control for whole cell proteins. (C, D) The expression levels of mRNA and protein for c-Myc and CyclinD1, transcriptional target genes of the Wnt/β-catenin signaling pathway, were assessed at 72 h after the transfection with miR-145. (**p < 0.01 and ***p < 0.001).
F i g u r e 7 . Effects of ectopic miR-145 expression on catenin δ-1, total PAK4, and nuclear PAK4 in DLD-1 and WiDr cells. Expression levels of catenin δ-1, total PAK4, and nuclear PAK4 were assessed at 72 h after the transfection with miR-145 at 40 nM. Histone H3 was used as a control for nuclear protein, and β-actin was used for whole cell protein. β-actin was also used as an indicator for contamination of cytoplasmic protein into the nuclear fraction (“n-β-actin” means intra-nuclear β-actin). Densitometric values are reported for catenin δ-1 protein levels.
F i g u r e 8 . Validation of catenin δ-1 as a target for miR-145 in DLD-1 cells. (A) Sequence homology between nucleotide position 5086 and 5092 at 3’UTR of catenin δ-1 mRNA and mature miR-145. Wild type construct was designed including the predicted miR-145 binding site in 3’UTR of catenin δ-1 mRNA. The mutant construct obtained by site-directed mutagenesis by changing three base pairs of the seed sequence (5’ 2-8 bases) and insertion into pMIR reporter vector. (B) Luciferase activities after the co-transfection with control or miR-145 and each reporter vector are shown (*p < 0.05).
F i g u r e 9 . Effects of silencing catenin δ-1 on cell growth, catenin δ-1, and subcellular distribution of β-catenin and PAK4 in DLD-1 and WiDr cells. (A) Effects of silencing catenin δ-1 on cell growth was assessed at 72 h after the transfection with siR-ctnnd1 (***p < 0.001). (B) Total (cytoplasmic and nuclear) levels of catenin δ-1, β-catenin, and PAK4 protein, and the subcellular distribution of β-catenin and PAK4 were assessed at 72 h after the transfection with siR-ctnnd1. β-actin was used as a control for whole cell proteins, and Histone H3 was used for nuclear protein. n-β-actin was used as an indicator for contamination of cytoplasmic protein into the nuclear fraction. (C) Expression levels of c-Myc and CyclinD1 were assessed at 48 h after the transfection with siR-ctnnd1 at 10 nM or 20 nM (*p < 0.05, **p < 0.01, and ***p < 0.001). Expression levels of c-Myc and CyclinD1 were assessed at 72 h after the transfection with siR-ctnnd1.
F i g u r e 1 0 . Intracellular distribution of β-catenin in DLD-1 (A) and WiDr cells (B), respectively. Immunofluorescence staining was performed at 72 h after the transfection with control, miR-145 or siR-ctnnd1 (20 nM). Bar = 50 µm.
F i g u r e 1 1 . Effects of ectopic expression of miR-145 or silencing catenin δ-1 on cell cycle. (A) Typical histograms represent cell cycle distributions in the cells transfected with control, miR-145 or siR-ctnnd1. Cell cycle analysis by cytometer was performed at 72 h after the transfection. (B) Data are expressed as % of PI-positive cells and were given as the means ± SD of triplicated samples (*p < 0.05, **p < 0.01, and ***p < 0.001).
F i g u r e 1 2 . Effects of combined treatment with antagomiR-145 and miR-145 in WiDr cells. WiDr cells were transfected with non-specific control (40 nM), non-specific control (20 nM) + miR-145 (20 nM), or AntagomiR-145 (20 nM) + miR-145 (20 nM). Viable cell rate (A) and expression levels of catenin δ-1, nuclear β-catenin and PAK4, c-Myc and CyclinD1 (B) were assessed at 72 h after the transfection (**p < 0.01). Densitometric values are reported for catenin δ-1, nuclear β-catenin, nuclear PAK4, and c-Myc protein levels.
F i g u r e 1 3 . Effects of ectopic expression of miR-145 or silencing catenin δ-1 on cell migration and invasion of colon cancer cells. (A) Cell migration was evaluated by wound healing assay. The wound area at 24 h after a straight-line scratch had been made was assessed by microscopy (48 h after the transfection with non-specific control, miR-145 or siR-ctnnd1 at 5-20 nM). Percentage of wound area remaining was determined. The inhibitory effect on cell migration is shown as an increase in the percentage of the wound area remaining at 24 h when the wound area at 0 h was taken as 100%, which percentage is expressed as the mean ± SD (*p < 0.05, **p < 0.01, and ***p < 0.001). (B) Cell invasion was evaluated by the Matrigel invasion assay as described in the Materials and Methods section. Invasion rates are expressed as percentage (mean ± SD) compared with control (*p < 0.05, **p < 0.01, and ***p < 0.001).
F i g u r e 1 3 . ( C o n t i n u e d ) (C) Relative expression levels of E-cadherin were assessed by densitometric analysis at 72 h after the transfection with non-specific control, miR-145 or siR-ctnnd1 at 10 nM or 20 nM (***p < 0.001). β-actin was used as an internal control.
F i g u r e 1 4 . Schema showing the involvement of miR-145 in the Wnt/β-catenin pathway. In our model, we propose that miR-145 attenuates the nuclear translocation of β-catenin by down-regulating catenin δ-1, a substrate for the nucleo-cytoplasmic shuttling protein PAK4, and that this action decreases the intranuclear β-catenin level, which leads to reduced β-catenin-dependent transcription. Moreover, Kaiso is known to be a repressor for β-catenin/TCF transcription; and nuclear catenin δ-1 inhibits Kaiso’s transcriptional repression activity. Thus, the down-regulation of catenin δ-1 by miR-145 leads to increased Kaiso’s activity and repressed β-catenin/TCF transcription. MiR-145 regulates cell motility not only through directly targeting Fascin-1 but also catenin δ-1, which leads to the down-regulation of E-cadherin.
SUMMARY
In this chapter, it was demonstrated that miR-145 plays a pivotal role in the Wnt/β-catenin signaling pathway by perturbing the intracellular translocation of β-catenin. The ectopic expression of miR-145 inhibited the growth of human colorectal cancer cells by directly targeting catenin δ-1, thereby disturbing β-catenin translocation into the nucleus, which leads to the down-regulation of c-Myc and CyclinD1. These findings suggest that miR-145 is an important anti-oncomir that has critical roles in carcinogenesis and cancer progression through the regulation of multiple oncogenes.
Validation of the roles of miRNAs in canine and human cancers is valuable for understanding mechanisms of carcinogenesis and cancer progression. Furthermore, miRNAs are foreseen as a novel therapeutic modality and diagnostic biomarker in cancers. Previously, down-regulation of miR-145 in various kinds of cancers including canine malignant melanoma and human colorectal cancer has been reported, and miR-145 is increasingly considered to be a promising candidate for the miRNA replacement therapy. In this dissertation, I validated the tumor-suppressing mechanism of miR-145 by focusing on its target genes in canine malignant melanoma and human colorectal cancer for the future development of miR-145 replacement therapy. In chapter 1, it was validated that the expression of fascin-1, a target gene of miR-145, was correlated with clinical malignancies including advanced clinical stages, invasion and metastasis in canine malignant melanoma. This result was consistent with that in other human cancers and suggested that fascin-1 expression has the potential to be a new immunohistochemical marker to predict the clinical course of canine melanoma. In addition, targeted therapy for fascin-1 with miR-145 may represent a new strategy for the treatment of canine melanoma.
In chapter 2, it was validated that catenin δ-1, a new target gene of miR-145 found in this study, had a critical role in the Wnt/β-catenin
signaling in human colorectal cancer cells. Ectopic expression of miR-145, which led to the down-regulation of catenin δ-1, resulted in cell-growth suppression due to the decreased nuclear translocation of β-catenin and PAK4. The down-regulation of catenin δ-1 also led to the disturbed cell migration, and cell invasion through the down-regulation of E-cadherin. These results uncovered a novel role of miR-145 in the modulation of cell proliferation and migration/invasion in colorectal cancer. Altogether, these understandings of the tumor-suppressive mechanism of miR-145 can contribute to the future development of miR-145 replacement therapy.
I would like to express my extreme gratitude to my chief supervisor, Dr. Kohji Maruo, for his continuous support of my phD program. I would also like to acknowledge Dr. Yukihiro Akao and Dr. Takashi Mori for their informative instructions, valuable advice, and constructive criticism with inspiring suggestions during the tenure of the research work. Without their enthusiastic instruction, I would have never completed this work.
I would like to express thanks to Profs. Akihiro Oishi (Obihiro University of Agriculture and Veterinary Medicine), Yuji Uzuka (Iwate University), Makoto Shibutani (Tokyo University of Agriculture and Technology), and Tokuma Yanai (Gifu University) for giving me valuable ideas and supervising the doctoral thesis.
REFERENCES
(1) Akao, Y., Nakagawa, Y., Hirata, I., Iio, A., Itoh, T., Kojima, K., Nakashima, R., Kitade, Y. and Naoe, T. (2010). Role of anti-oncomirs miR-143 and -145 in human colorectal tumors. Cancer Gene Ther, 17, 398-408.
(2) Akao, Y., Nakagawa, Y. and Naoe, T. (2007). MicroRNA-143 and -145 in colon cancer. DNA Cell Biol, 26, 311-320.
(3) Arjonen, A., Kaukonen, R. and Ivaska, J. (2011). Filopodia and adhesion in cancer cell motility. Cell Adh Migr, 5, 421-430.
(4) Bergman, P. J. (2007). Canine oral melanoma. Clin Tech Small Anim Pract, 22, 55-60.
(5) Bi, J. B., Zhu, Y., Chen, X. L., Yu, M., Zhang, Y. X., Li, B. X., Sun, J. W., Shen, H. L. and Kong, C. Z. (2013). The Role of Fascin in Migration and Invasion of Urothelial Carcinoma of the Bladder. Urol Int. DOI: 10.1159/000346559.
(6) Cheng, Y., Zhang, G. and Li, G. (2013). Targeting MAPK pathway in
melanoma therapy. Cancer Metastasis Rev. DOI:
10.1007/s10555-013-9433-9.
(7) Chiyomaru, T., Enokida, H., Tatarano, S., Kawahara, K., Uchida, Y., Nishiyama, K., Fujimura, L., Kikkawa, N., Seki, N. and Nakagawa, M. (2010). miR-145 and miR-133a function as tumour suppressors and directly regulate FSCN1 expression in bladder cancer. Br J Cancer, 102, 883-891.
(8) Cho, W. C. (2010). MicroRNAs in cancer - from research to therapy. Biochim Biophys Acta, 1805, 209-217.
(9) Clevers, H. (2006). Wnt/beta-catenin signaling in development and disease. Cell, 127, 469-480.
(10) Daniel, J. M. (2007). Dancing in and out of the nucleus: p120(ctn) and the transcription factor Kaiso. Biochim Biophys Acta, 1773, 59-68. (11) Daniel, J. M. and Reynolds, A. B. (1999). The catenin p120(ctn)
transcription factor. Mol Cell Biol, 19, 3614-3623.
(12) Davis, M. A., Ireton, R. C. and Reynolds, A. B. (2003). A core function for p120-catenin in cadherin turnover. J Cell Biol, 163, 525-534. (13) Esquela-Kerscher, A. and Slack, F. J. (2006). Oncomirs - microRNAs
with a role in cancer. Nat Rev Cancer, 6, 259-269.
(14) Fearon, E. R. and Vogelstein, B. (1990). A genetic model for colorectal tumorigenesis. Cell, 61, 759-767.
(15) Fuse, M., Nohata, N., Kojima, S., Sakamoto, S., Chiyomaru, T., Kawakami, K., Enokida, H., Nakagawa, M., Naya, Y., Ichikawa, T. and Seki, N. (2011). Restoration of miR-145 expression suppresses cell proliferation, migration and invasion in prostate cancer by targeting FSCN1. Int J Oncol, 38, 1093-1101.
(16) Goldschmidt, M. H., Dunstan, R. W., Stannard, A. A., von Tscharner, C., Walder, E. J. and Yager, J. A. (1998). Histological classification of epithelial and melanocytic tumors of the skin of domestic animals. In: Shulmann, F. Y. [eds] World Health Organization International Histological Classification of Tumors of Domestic Animals, 2nd ed., pp. 38-40. Armed Forces Institute of Pathology, Washington, DC.
(17) Hanker, L. C., Karn, T., Holtrich, U., Graeser, M., Becker, S., Reinhard, J., Ruckhaberle, E., Gevensleben, H. and Rody, A. (2013). Prognostic impact of fascin-1 (FSCN1) in epithelial ovarian cancer. Anticancer Res, 33, 371-377.
(18) Hauschild, A., Agarwala, S. S., Trefzer, U., Hogg, D., Robert, C., Hersey, P., Eggermont, A., Grabbe, S., Gonzalez, R., Gille, J., Peschel, C., Schadendorf, D., Garbe, C., O'Day, S., Daud, A., White, J. M., Xia, C., Patel, K., Kirkwood, J. M. and Keilholz, U. (2009). Results of a phase III, randomized, placebo-controlled study of sorafenib in combination with carboplatin and paclitaxel as second-line treatment in patients with unresectable stage III or stage IV melanoma. J Clin Oncol, 27, 2823-2830.
(19) Head, K. W., Cullen, J. M., Dubielzig, R. R., Else, R. W., Misdorp, W., Patnaik, A. K., Tateyama, S. and van der Gagg, I. (2003). Histological classification of tumors of the alimentary system of domestic animals.