A genome-wide association study in the Japanese population identifies the 12q24 locus
for habitual coffee consumption: The J-MICC Study
Hiroko Nakagawa-Senda1,2,10, Tsuyoshi Hachiya3, Atsushi Shimizu3, Satoyo Hosono1,
Isao Oze4, Miki, Watanabe1, Keitaro Matsuo4,5, Hidemi Ito4,5, Megumi Hara6, Yuichiro
Nishida6, Kaori Endoh7, Kiyonori Kuriki7, Sakurako Katsuura-Kamano8, Kokichi
Arisawa8, Yora Nindita9, Rie Ibusuki9, Sadao Suzuki10, Akihiro Hosono10, Haruo
Mikami11, Yohko Nakamura11, Naoyuki Takashima12, Yasuyuki Nakamura13, Nagato
Kuriyama14, Etsuko Ozaki14, Norihiro Furusyo15, Hiroaki Ikezaki15, Masahiro
Nakatochi16, Tae Sasakabe2, Sayo Kawai2, Rieko Okada2, Asahi Hishida2, Mariko
Naito2, Kenji Wakai2, Yukihide Momozawa17, Michiaki Kubo17, Hideo Tanaka1
1Division of Epidemiology and Prevention, Aichi Cancer Center Research Institute
2Department of Preventive Medicine, Nagoya University Graduate School of Medicine
3Division of Biomedical Information Analysis, Iwate Tohoku Medical Megabank
4Division of Molecular and Clinical Epidemiology, Aichi Cancer Center Research
Institute
5Department of Epidemiology, Nagoya University Graduate School of Medicine
6Department of Preventive Medicine, Faculty of Medicine, Saga University
7Laboratory of Public Health, Division of Nutritional Sciences, School of Food and
Nutritional Sciences, University of Shizuoka
8Department of Preventive Medicine, Institute of Biomedical Sciences, Tokushima
University Graduate School
9Department of International Island and Community Medicine, Kagoshima University
Graduate School of Medical and Dental Sciences
10Department of Public Health, Nagoya City University Graduate School of Medical
Sciences
11Division of Cancer Prevention and Epidemiology, Chiba Cancer Center
12Department of Public Health, Shiga University of Medical Science
13Department of Food Science and Human Nutrition, Faculty of Agriculture, Ryukoku
14Department of Epidemiology for Community Health and Medicine, Kyoto Prefectural
University of Medicine
15Department of Environmental Medicine and Infectious Disease, Kyushu University
16Center for Advanced Medicine and Clinical Research, Nagoya University Hospital
17Laboratory for Genotyping Development, Center for Integrative Medical Sciences,
RIKEN
Supplement Table 1. Baseline characteristics of the study subjects according to site
Supplementary Table 2. Results of genome-wide association study adjusted for age, sex and smoking status
Supplementary Table 3. Results of genome-wide association study adjusted for age, sex , smoking status, and BMI
Supplement Table 1. Baseline characteristics of the study subjects according to site
Current alcohol drinkers (%)
Chiba 1,055 53.6 ± 9.9 66 1.5 ± 1.4 56.1 12.6 ± 22.8 22.5 ± 3.0 11.5 Okazaki 1,064 55.7 ± 9.1 45 1.6 ± 1.4 54.0 13.3 ± 22.4 22.4 ± 3.2 20.0 Shizuoka–Daiko 1,989 52.9 ± 9.7 56 1.6 ± 1.5 52.9 14.2 ± 29.8 23.3 ± 3.1 15.8 Takashima 543 56.5 ± 9.7 71 1.5 ± 1.4 55.9 13.1 ± 23.8 22.3 ± 3.1 15.7 Kyoto 1,088 49.8 ± 9.8 52 1.9 ± 1.6 46.6 10.4 ± 19.4 23.0 ± 3.3 20.0 Sakuragaoka 573 50.1 ± 9.4 38 1.5 ± 1.5 62.8 15.0 ± 23.7 22.4 ± 3.2 25.8 Sub-total 6,312 53.0 ± 9.9 55 1.6 ± 1.5 56.1 23.9 ± 28.5 22.7 ± 3.2 17.4 Aichi 1,150 55.1 ± 9.5 51 1.7 ± 1.5 56.3 13.4 ± 23.4 23.1 ± 3.2 21.7 Saga 1,897 56.8 ± 8.2 57 1.6 ± 1.6 51.8 18.1 ± 29.4 24.6 ± 3.6 20.8 Kagoshima 1,224 55.2 ± 8.3 58 1.7 ± 1.6 58.3 15.3 ± 23.4 23.9 ± 3.6 15.9 Tokushima 678 50.4 ± 8.9 33 2.2 ± 1.7 60 14.6 ± 23.7 23.1 ± 3.4 26.0 Sub-total 4,949 55.1 ± 8.8 53 1.7 ± 1.6 54.8 27.0 ± 28.3 23.4 ± 3.4 20.5
*Among current alcohol consumers
Current alcohol consumption (mean±SD) BMI (kg/m2) (mean±SD) Current smoking rate (%) Site N Age ± SD (year) Female (%)
Coffee consumption (mean±SD) (cups/day)
Supplementary Table 2. Results of genome-wide association study adjusted for age, sex and smoking status
SNP Chrb Gene Positionc EAd NEAe Rsqf Population AFg Betah SE(Beta)i Variance explained (%) P rs2074356a 12 HECTD4 112,645,401 A G 0.996 Discovery 0.252 0.2084 0.0293 0.82 1.2×10⁻¹²
(intron) Replication 0.224 0.1681 0.0363 0.42 3.6×10⁻⁶
Meta-analysis 0.240 0.1925 0.0228 0.62 3.1×10⁻¹⁷
aDirectly genotyped; bChromosome; cChromosomal position (GRCh37/hg19); dEffect allele; eNon-effect allele; fImputation quality in terms of R-square calculated by the Minimac3 software version 1.0.11; gAllele frequency of effect allele; hEffect size; iStandard error of effect size
Results listed in bold are associations whose P -values are less than of genome-wide significance ( P < 5×10⁻⁸).
Supplementary Table 3. Results of genome-wide association study adjusted for age, sex, smoking status, and BMI
SNP Chrb Gene(s) Positionc EAd NEAe Rsqf Population AFg Betah SE(Beta)i Variance
explained (%) P rs1957553 5 CLINT1–EBF1 157,506,734 G A 0.996 Discovery 0.2719 0.1394 0.0285 0.39 9.9×10⁻⁷ (intergenic) Replication 0.2756 -0.0174 0.0340 0.01 6.1×10⁻¹ Meta-analysis 0.2735 0.0746 0.0218 0.10 6.3×10⁻⁴ rs2074356a 12 HECTD4 112,645,401 A G 0.996 Discovery 0.2520 0.2078 0.0293 0.82 1.4×10⁻¹² (intron) Replication 0.2243 0.1674 0.0363 0.41 4.0×10⁻⁶ Meta-analysis 0.2398 0.1918 0.0228 0.62 4.0×10⁻¹⁷
aDirectly genotyped; bChromosome; cChromosomal position (GRCh37/hg19); dEffect allele; eNon-effect allele; fImputation quality in terms of R-square
calculated by the Minimac3 software version 1.0.11; gAllele frequency of effect allele; hEffect size; iStandard error of effect size
Supplementary Table 4. Results of conditional analysis around rs2074356
Supplementary Table 4. Results of conditional analysis around rs2074356
Betag SE(Beta)h P Beta SE(Beta) P
rs12227162 12 111,367,244 T C 0.208 0.1616 0.0323 5.7×10⁻⁷ 0.0087 0.0322 0.787 0.522 rs149607519 12 111,389,437 G C 0.213 0.1575 0.0317 6.8×10⁻⁷ 0.0081 0.0316 0.798 0.521 rs148177611 12 111,390,454 T TAGAA 0.215 0.1574 0.0317 6.8×10⁻⁷ 0.0088 0.0315 0.781 0.515 rs3809297 12 111,609,727 T G 0.256 0.1643 0.0319 2.5×10⁻⁷ -0.0065 0.0317 0.837 0.657 rs3809284 12 111,688,139 C T 0.906 0.2338 0.0473 7.9×10⁻⁷ 0.1691 0.0472 0.0003 0.037 rs11065992 12 112,085,496 C T 0.473 0.1509 0.0291 2.2×10⁻⁷ 0.0209 0.0290 0.471 0.441 rs3782886a 12 112,110,489 C T 0.288 0.1822 0.0287 2.3×10⁻¹⁰ 0.0076 0.0286 0.791 0.816 rs11066001 12 112,119,171 C T 0.284 0.1867 0.0290 1.3×10⁻¹⁰ 0.0074 0.0289 0.798 0.842 rs60125993 12 112,136,208 C CT 0.513 0.1422 0.0271 1.5×10⁻⁷ 0.0370 0.0269 0.169 0.328 rs11066008 12 112,140,669 G A 0.351 0.1827 0.0301 1.2×10⁻⁹ 0.0102 0.0299 0.733 0.719 rs11066015a 12 112,168,009 A G 0.275 0.1895 0.0292 8.1×10⁻¹¹ 0.0066 0.0290 0.821 0.870 rs4646776 12 112,230,019 C G 0.275 0.1906 0.0291 6.2×10⁻¹¹ 0.0072 0.0290 0.805 0.876 rs671a 12 112,241,766 A G 0.275 0.1894 0.0291 7.8×10⁻¹¹ 0.0060 0.0290 0.836 0.878 rs78069066 12 112,337,924 A G 0.280 0.1919 0.0295 7.7×10⁻¹¹ 0.0060 0.0293 0.839 0.879 rs2339904 12 112,378,350 T C 0.622 0.1437 0.0292 8.8×10⁻⁷ 0.0589 0.0291 0.043 0.198 rs11066132 12 112,468,206 T C 0.271 0.1948 0.0303 1.2×10⁻¹⁰ 0.0006 0.0301 0.983 0.907 rs116873087 12 112,511,913 C G 0.274 0.1904 0.0302 2.8×10⁻¹⁰ -0.0024 0.0300 0.938 0.899 rs11066150 12 112,518,803 A G 0.466 0.1739 0.0291 2.4×10⁻⁹ 0.0401 0.0290 0.167 0.464 rs147992802 12 112,552,274 T C 0.344 0.1995 0.0305 6.3×10⁻¹¹ 0.0257 0.0304 0.397 0.700 rs12231737 12 112,574,616 T C 0.281 0.1939 0.0298 8.2×10⁻¹¹ 0.0030 0.0297 0.918 0.903 rs144504271 12 112,627,350 A G 0.277 0.1943 0.0297 5.8×10⁻¹¹ 0.0036 0.0295 0.902 0.912 rs2074356a 12 112,645,401 A G 0.252 0.2011 0.0299 1.8×10⁻¹¹ 0.0000 0.0298 1.000 1.000 rs77768175 12 112,736,118 G A 0.253 0.1974 0.0329 1.9×10⁻⁹ -0.0083 0.0327 0.798 0.869 rs11066280a 12 112,817,783 A T 0.290 0.1759 0.0286 8.0×10⁻¹⁰ 0.0018 0.0285 0.949 0.817 rs11537471 12 112,834,586 G A 0.349 0.1852 0.0296 3.9×10⁻¹⁰ 0.0206 0.0294 0.485 0.678 rs139144808 12 113,470,025 TA T 0.225 0.1638 0.0329 6.4×10⁻⁷ 0.0484 0.0327 0.140 0.298
Adjusted for age and sex Adjusted for age, sex and rs2074356 dosage LDi R2
aDirectly genotyped; bChromosome; cChromosomal position (GRCh37/hg19); dEffect allele; eNon-effect allele; fAllele frequency of effect allele; gEffect size; hStandard error of effect size; iLinkage disequilibrium R2 with rs2074356
Supplement Table 5. Results of genome-wide association study using both discovery and replication subjects
Supplement Table 6. Minor allele frequency in the J-MICC samples for previously-reported SNPs
Supplementary Table 5. Results of genome-wide association study using both discovery and replication subjects
Adjustment SNP Chrb Gene(s) Positionc EAd NEAe Rsqf AFg Betah SE(Beta)i Variance
explained (%) P
Age, Sex rs573194563 5 CT49–DNAH5
(intergenic)
13,076,920 CA C 0.810 0.955 0.2708 0.0539 0.31 5.0×10⁻⁷
rs144504271 12 HECTD4
(intron)
112,627,350 A G 0.955 0.265 0.1887 0.0237 0.67 1.5×10⁻¹⁵ Age, Sex, Smoking status rs12094032 1 MAB21L3–ATP1A1
(intergenic) 116,891,363 G A 0.943 0.057 0.2139 0.0432 0.24 7.5×10⁻⁷ rs573194563 5 CT49–DNAH5 (intergenic) 13,076,920 CA C 0.810 0.955 0.2605 0.0527 0.28 7.8×10⁻⁷ rs4410790a 7 AGR3–AHR (intergenic) 17,284,577 C T 0.996 0.375 0.1020 0.0203 0.23 4.9×10⁻⁷ rs2074356a 12 HECTD4 (intron) 112,645,401 A G 0.996 0.240 0.1925 0.0234 0.65 1.7×10⁻¹⁶ Age, Sex, Smoking status, BMIrs12094032 1 MAB21L3–ATP1A1
(intergenic) 116,891,363 G A 0.943 0.057 0.2136 0.0432 0.24 7.8×10⁻⁷ rs573194563 5 CT49–DNAH5 (intergenic) 13,076,920 CA C 0.810 0.955 0.2597 0.0527 0.28 8.4×10⁻⁷ rs4410790a 7 AGR3–AHR (intergenic) 17,284,577 C T 0.996 0.375 0.1024 0.0203 0.24 4.4×10⁻⁷ rs2074356a 12 HECTD4 (intron) 112,645,401 A G 0.996 0.240 0.1920 0.0234 0.65 2.0×10⁻¹⁶
aDirectly genotyped; bChromosome; cChromosomal position (GRCh37/hg19); dEffect allele; eNon-effect allele; fImputation quality in terms of R-square calculated by the
Minimac3 software version 1.0.11; gAllele frequency of effect allele; hEffect size; iStandard error of effect size
Results listed in bold are associations whose P -values were less than of genome-wide significance ( P < 5×10⁻⁸).
Locus SNP PubMed ID(s) First Author Year
2p24 rs1260326a 25288136 Cornelis MC 2015 4q22 rs1481012 25288136 Cornelis MC 2015 6q21 rs2216084 27561104 Pirastu N 2016 rs6942255 27561104 Pirastu N 2016 rs7745311 27561104 Pirastu N 2016 rs7754744 27561104 Pirastu N 2016 rs9386630b 27561104 Pirastu N 2016 7p21 rs4410790a 21490707; 25288136 Cornelis MC; Cornelis MC 2011; 2015 rs6968554a 25288136 Cornelis MC 2015 rs6968865a 21357676 Sulem P 2011 7q11.23 rs7800944 25288136 Cornelis MC 2015 rs17685a 25288136 Cornelis MC 2015 7q31 rs382140a 21876539 Amin N 2012 11p13 rs6265a 25288136 Cornelis MC 2015
15q24 rs2470893a 21490707; 21876539; 25288136 Cornelis MC; Amin N; Cornelis MC 2011; 2012; 2015
rs2472297a 21876539; 25288136; 21357676 Amin N; Cornelis MC; Sulem P 2012; 2015; 2011
rs6495122a 21876539 Amin N 2012
17q11.2 rs9902453 25288136 Cornelis MC 2015
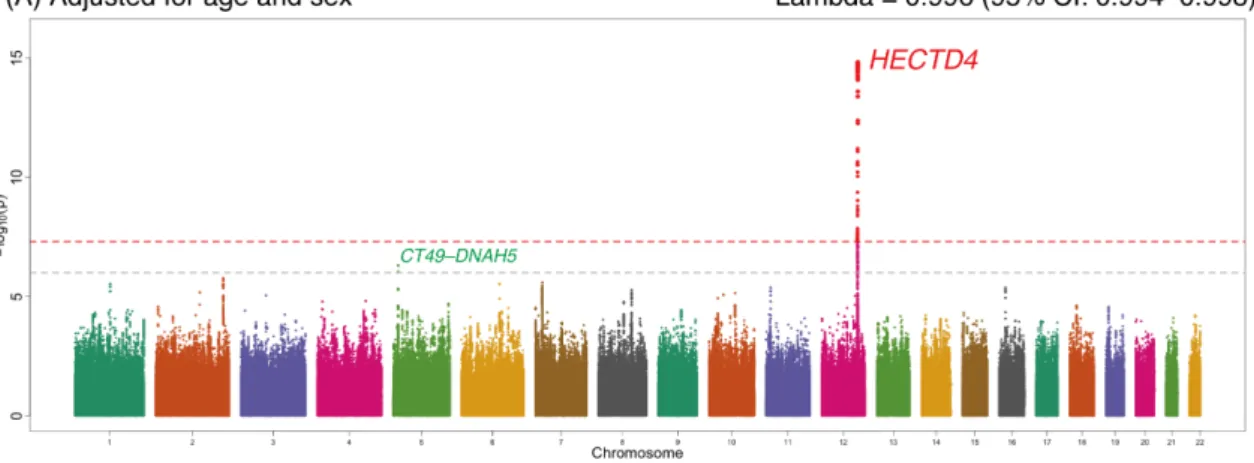
Figure S1. Genome-wide association signals from the combined analysis of discovery
and replication samples (N = 11,261). The x-axis represents chromosomal positions and the y-axis represents –log10 P-values calculated by a mixed linear model association
analysis. The grey and red dotted horizontal lines indicate the suggestive (P = 1 × 10⁻⁶) and genome-wide (P = 5 × 10⁻⁸) significance levels, respectively. Variants with
P-values indicating less than genome-wide significance (P <5 × 10⁻⁸) are shown in red. Results were adjusted for age and sex (A); for age, sex, and smoking status (B); and for age, sex, smoking status, and BMI (C). The inflation factor, lambda, is the median of the observed test statistics divided by the median of the expected test statistics. BMI, body-mass index; CI, confidence interval